
Managing multiple territories without clear performance visibility often leads to missed targets, delayed actions, and weak accountability. Many organizations still rely on static reports, manual Excel files, and fragmented data sources. As a result, leaders struggle to understand which territories are performing well and which need immediate attention.
That is exactly why the Territory Management KPI Dashboard in Power BI is a powerful, ready-to-use solution designed to bring clarity, speed, and control to territory-based performance management.
This professionally designed Power BI dashboard consolidates all territory KPIs into one interactive report. Instead of juggling multiple files, you get instant insights into MTD and YTD performance, Actual vs Target comparison, and Previous Year benchmarking—all in a single view. With Excel as the backend and Power BI as the visualization layer, the dashboard remains both flexible and easy to maintain.
## 🚀 Key Features of Territory Management KPI Dashboard in Power BI
✅ Interactive Month & KPI Group Slicers
Quickly filter performance by month and KPI group. All visuals update instantly based on your selection.
✅ MTD & YTD Performance Tracking
Monitor Month-to-Date and Year-to-Date performance for every KPI without manual calculations.
✅ Actual vs Target Comparison
Clearly see whether territories are meeting or missing targets using calculated ratios and visual indicators.
✅ Previous Year Comparison
Track growth and decline trends by comparing current-year performance with previous-year values.
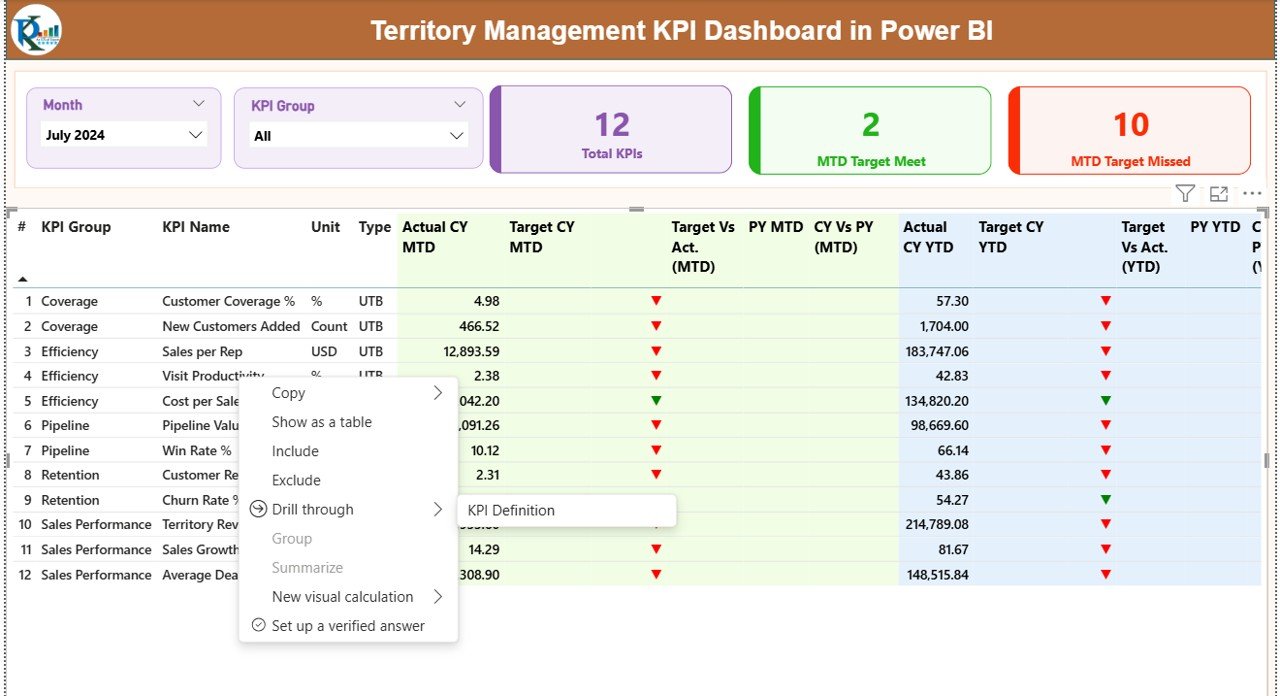
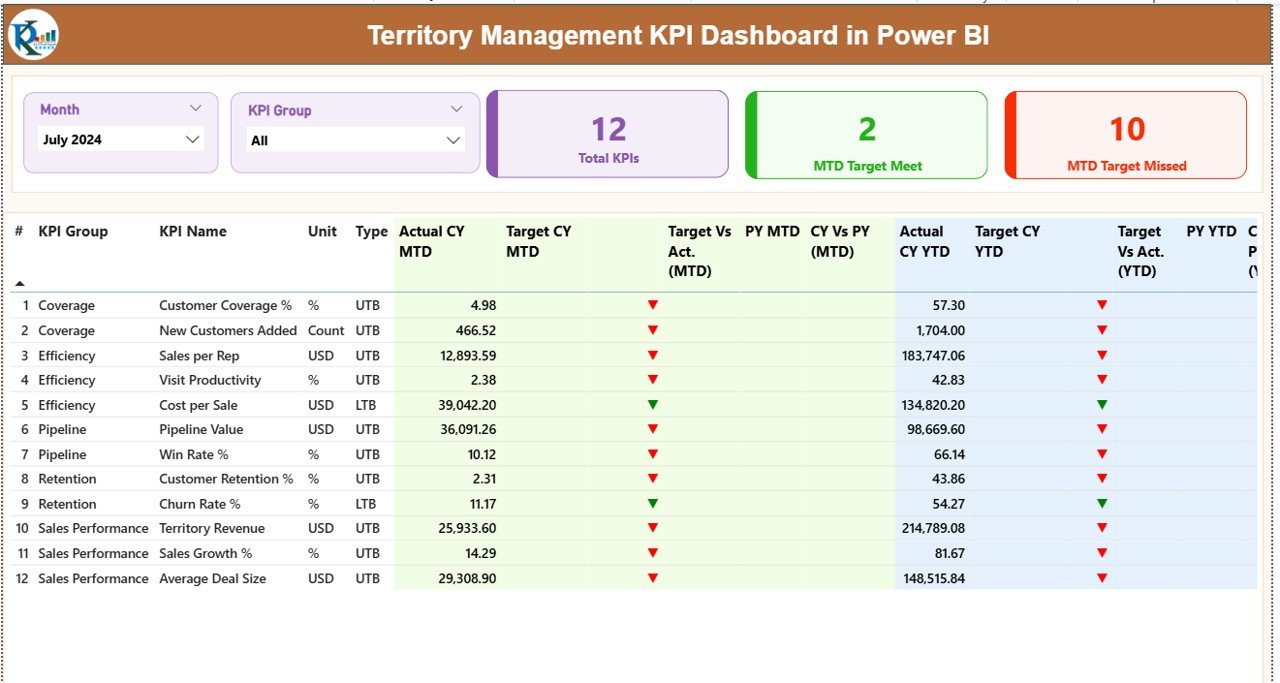
✅ Smart KPI Cards
Instantly view Total KPIs, MTD Target Met count, and MTD Target Missed count at the top of the dashboard.
✅ Visual Status Indicators
Up and down arrows with color coding highlight performance status for faster decision-making.
## 📦 What’s Inside the Territory Management KPI Dashboard in Power BI
This product includes a 3-page interactive Power BI report supported by a structured Excel data source.
📄 Summary Page
The main control center showing KPI cards, slicers, and a detailed KPI performance table with MTD and YTD metrics.
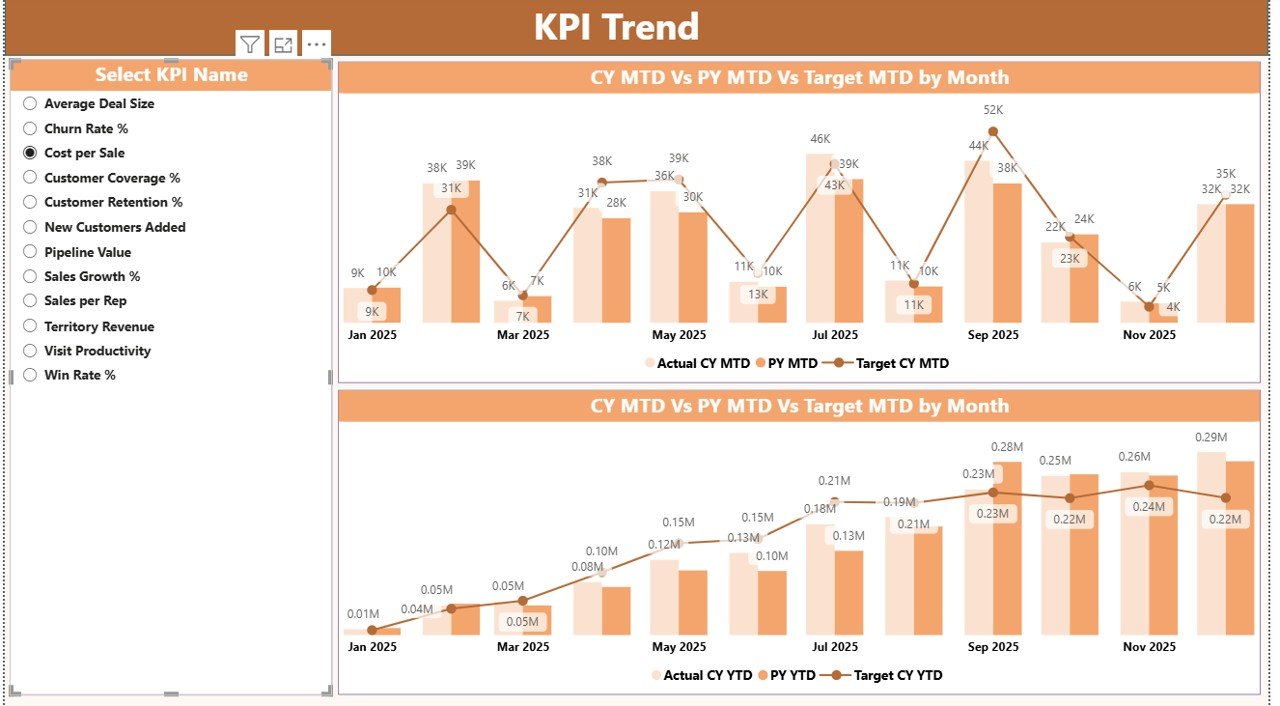
📈 KPI Trend Page
Two dynamic combo charts displaying MTD and YTD trends with Actual, Target, and Previous Year comparisons.
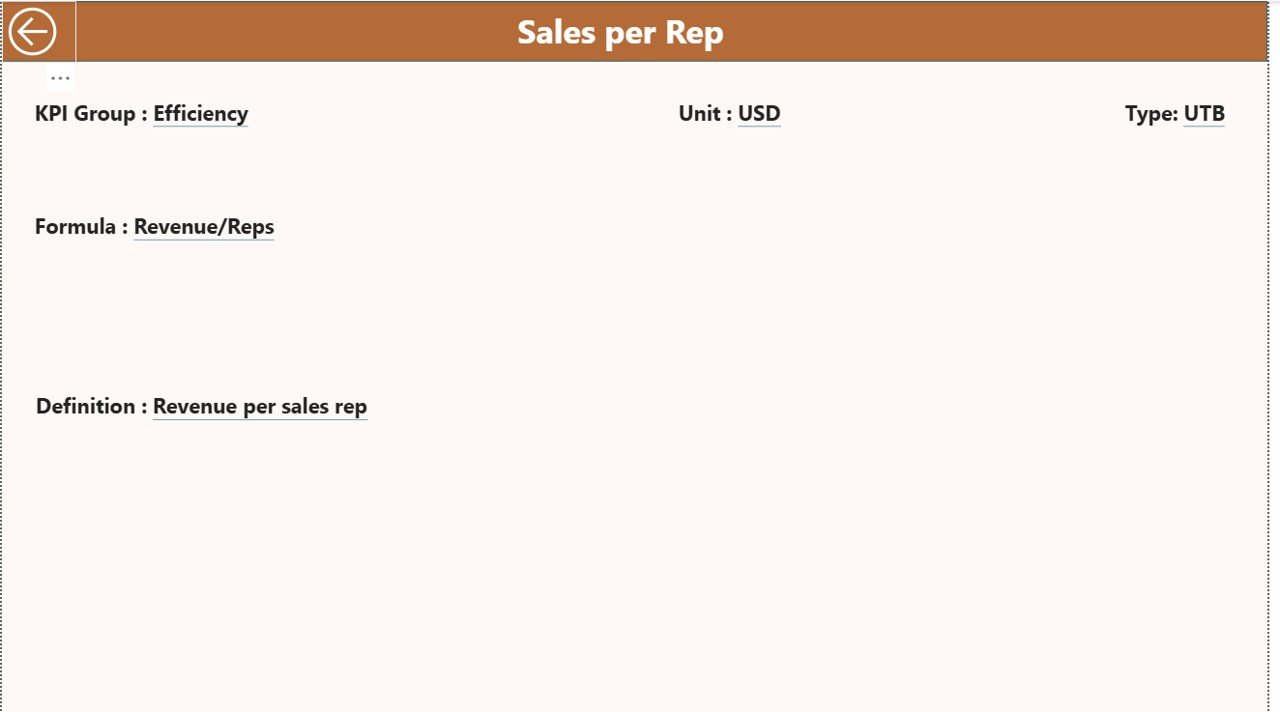
📘 KPI Definition Page
A drill-through page that explains KPI formulas, definitions, units, and KPI type (LTB or UTB) for clarity and governance.
📊 Excel-Based Data Input File
Includes:
-
Input_Actual sheet
-
Input_Target sheet
-
KPI Definition sheet
No complex modeling—just structured and easy data entry.
## 🧭 How to Use the Territory Management KPI Dashboard in Power BI
1️⃣ Update Actual and Target values in the Excel input sheets
2️⃣ Refresh the Power BI file
3️⃣ Select Month and KPI Group using slicers
4️⃣ Analyze MTD and YTD performance instantly
5️⃣ Drill through KPIs to understand definitions and formulas
This simple workflow ensures faster reporting and reliable insights.
## 👥 Who Can Benefit from This Territory Management KPI Dashboard in Power BI
🎯 Sales Managers & Regional Heads – Track territory-wise sales performance
🎯 Territory & Area Managers – Identify gaps and improvement areas
🎯 Business Analysts – Perform trend and variance analysis
🎯 Strategy & Leadership Teams – Support data-driven decisions
🎯 Operations & Service Teams – Monitor regional operational KPIs
Any organization managing performance across regions, zones, or territories can benefit from this dashboard.
Click here to read the Detailed Blog Post
Watch the step-by-step video tutorial:
👉 Visit our YouTube channel to learn step-by-step video tutorials
🔗 YouTube.com/@PKAnExcelExpert


Reviews
There are no reviews yet.