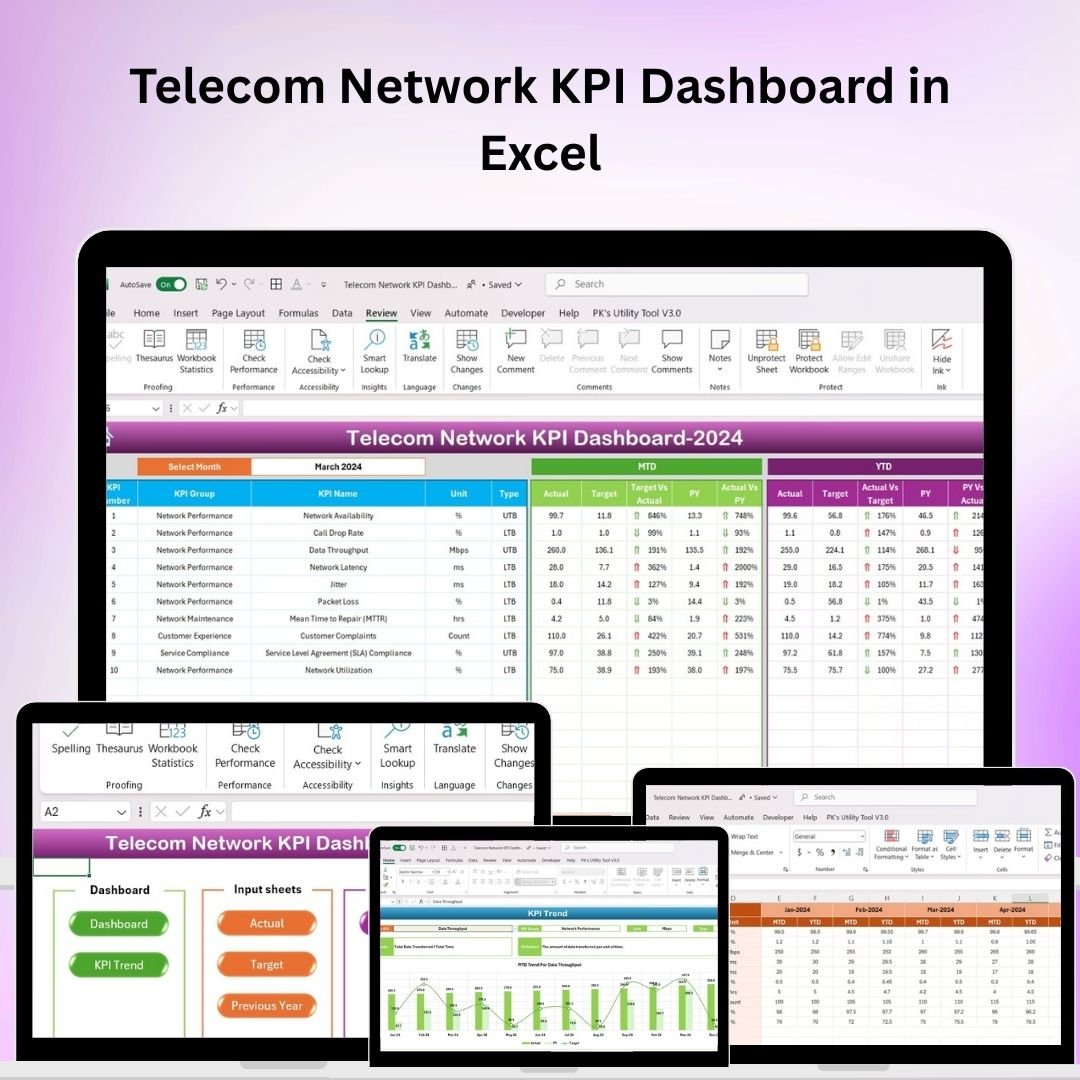
The Telecom Network KPI Dashboard in Excel is a powerful tool designed for telecom operators, network managers, and service providers to monitor the performance and health of their network infrastructure. This Excel-based dashboard helps track key performance indicators (KPIs) related to network reliability, uptime, speed, and user experience, ensuring that your telecom network operates at its optimal capacity.
With this dashboard, you can monitor critical network parameters like network availability, signal strength, data throughput, and more. The user-friendly interface, combined with detailed analytics, allows you to quickly identify areas that require improvement, optimize performance, and enhance customer satisfaction.
Key Features of the Telecom Network KPI Dashboard in Excel
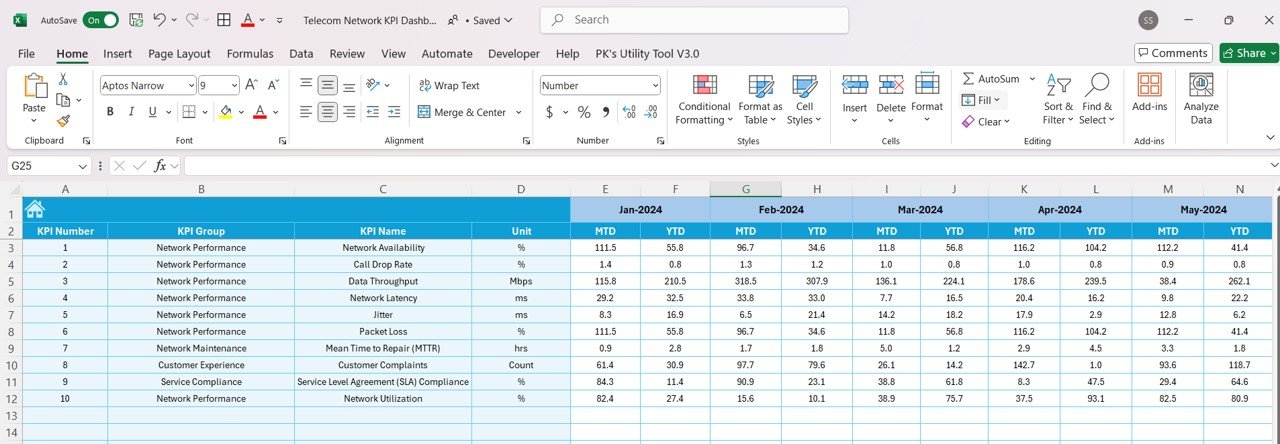
📊 Network Availability Tracking
Monitor the overall availability of your telecom network. Track network uptime and downtimes to ensure high levels of service and reliability.
📈 Signal Strength & Coverage Monitoring
Keep track of signal strength across various locations. Identify areas with poor coverage and optimize your network to provide better service to users.
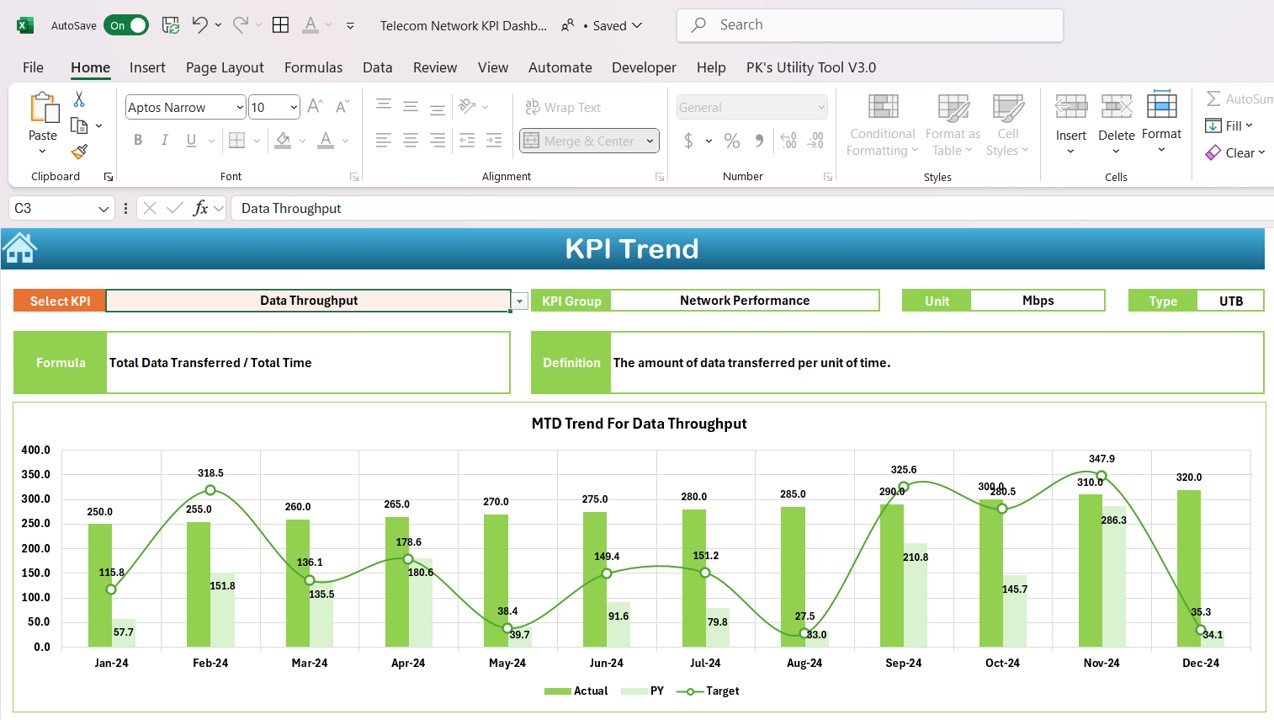
⚡ Data Throughput & Speed Analysis
Measure data throughput and network speed to assess whether the network meets performance expectations and provides optimal service to customers.
🔄 Real-Time Network Performance Tracking
Track network performance in real-time with automatic updates. Monitor performance metrics such as latency, jitter, packet loss, and network congestion to ensure seamless connectivity.
⚙️ Customizable KPIs & Metrics
The dashboard is highly customizable, allowing you to track additional network parameters relevant to your business. Add or modify KPIs as needed to reflect your specific performance goals.
📅 Time-Based Data Analysis
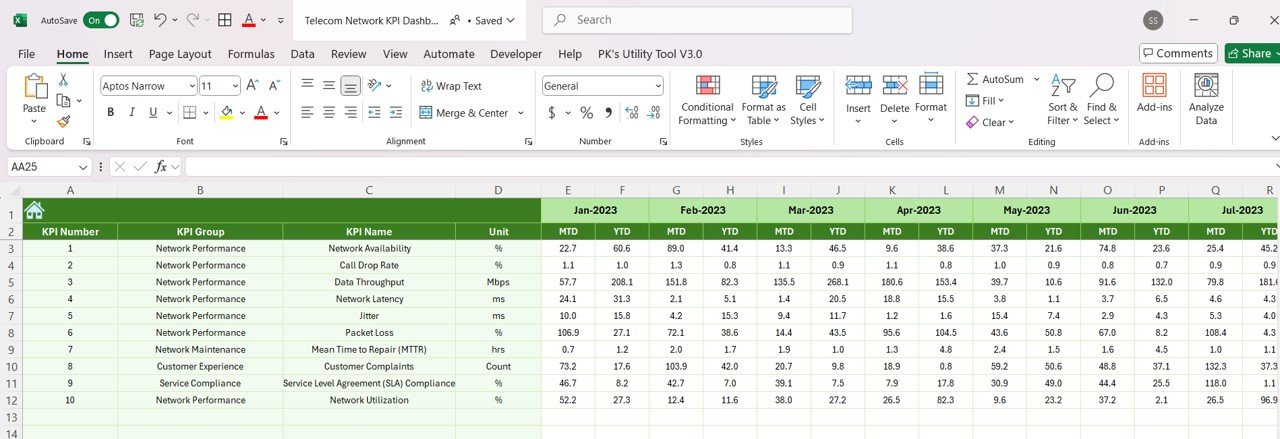
Analyze network performance over different periods (daily, weekly, monthly) to identify trends, seasonal variations, and performance improvements or declines over time.
Why You’ll Love the Telecom Network KPI Dashboard in Excel

✅ Real-Time Performance Monitoring
Stay on top of your network performance with real-time updates. Track critical KPIs and ensure that your network is always performing at its best.
✅ Optimize Network Performance
Identify bottlenecks, slowdowns, and areas with poor signal strength. Use the data to optimize network coverage and speed for an improved user experience.
✅ Enhance Customer Satisfaction
Monitor and improve the customer experience by analyzing factors like data throughput, signal strength, and network downtime. Ensure that your network provides reliable and fast services.
✅ Data-Driven Decision Making
Use the insights from the dashboard to make data-driven decisions that optimize your telecom network, reduce outages, and improve overall performance.
✅ Customizable & Scalable
Tailor the dashboard to your specific telecom network needs. Whether you’re a small telecom operator or managing a large network, this tool can scale to meet your requirements.
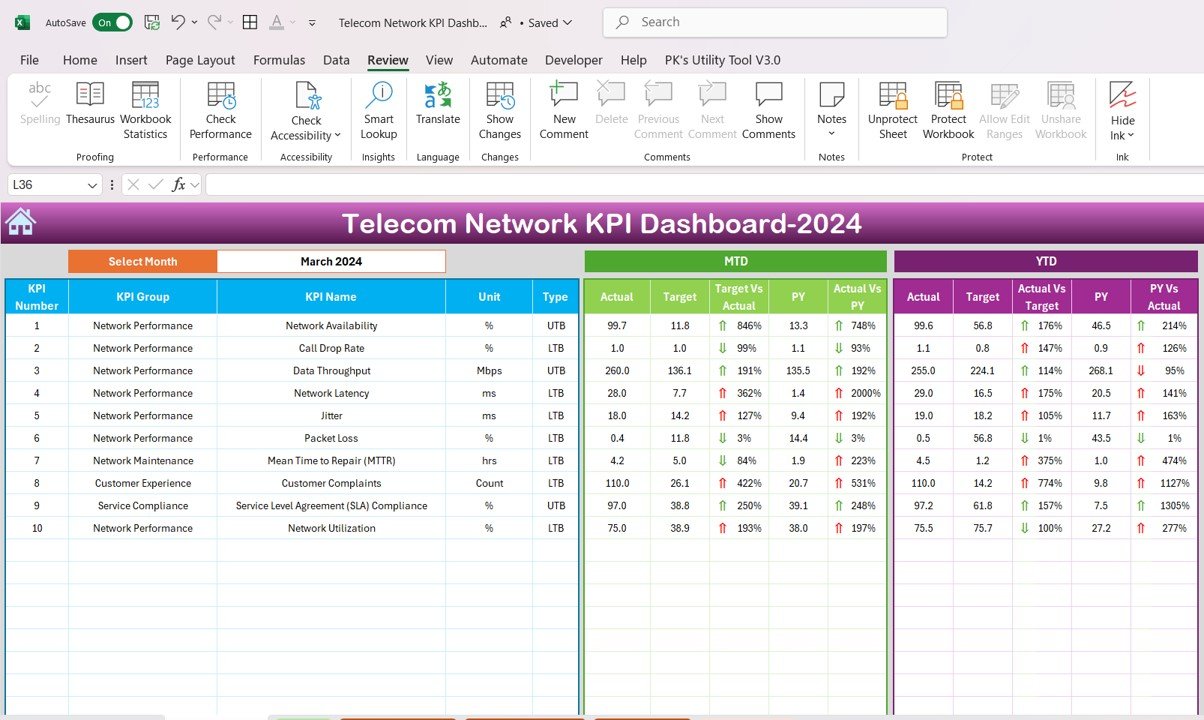
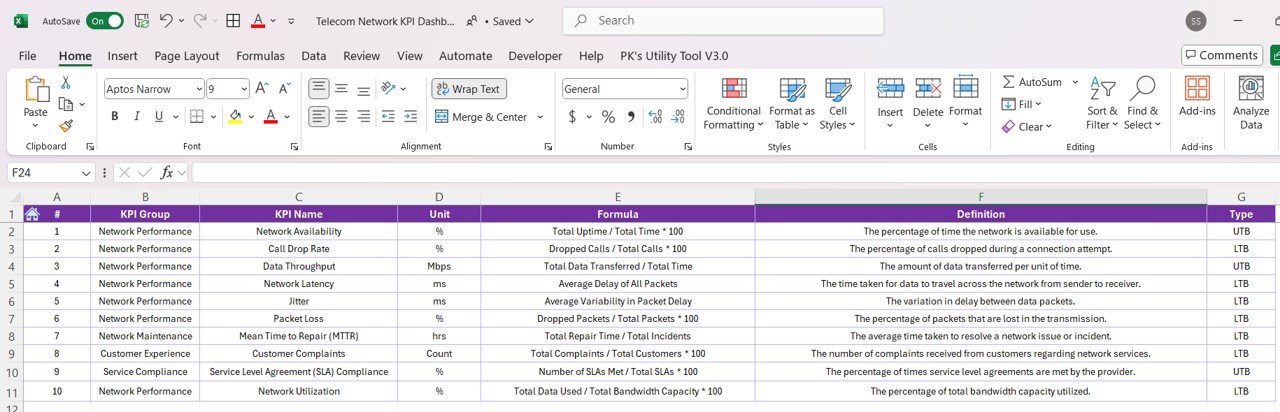
What’s Inside the Telecom Network KPI Dashboard in Excel?
-
Network Availability Tracking: Track uptime and downtime to maintain optimal network reliability.
-
Signal Strength Monitoring: Assess coverage and identify weak spots in your network.
-
Data Throughput & Speed Analysis: Monitor network speed and throughput for performance optimization.
-
Real-Time Network Monitoring: Track performance metrics such as latency and packet loss in real-time.
-
Customizable KPIs: Adapt the dashboard to track additional network parameters as needed.
-
Time-Based Data Analysis: Analyze trends and performance variations over time.
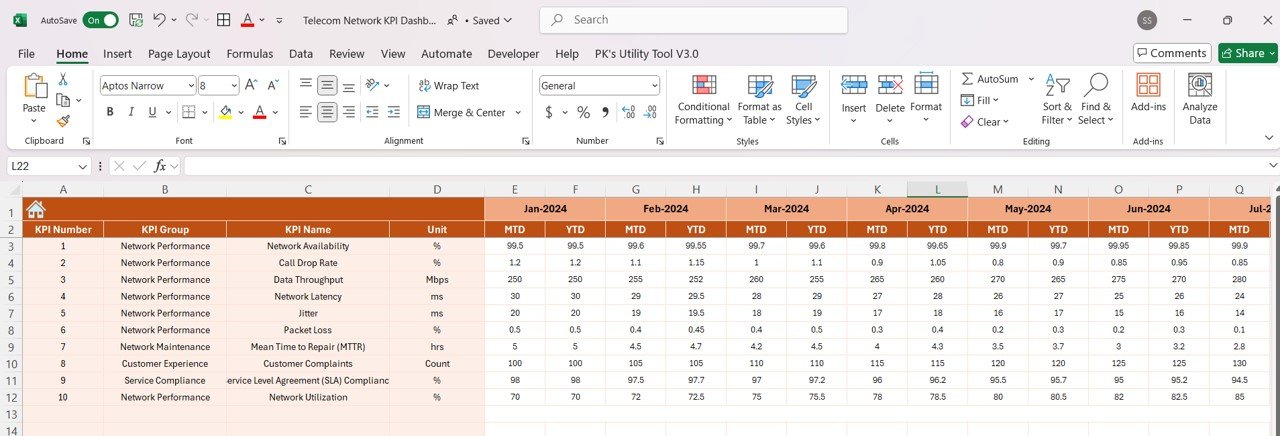
How to Use the Telecom Network KPI Dashboard in Excel
1️⃣ Download the Template: Access the Telecom Network KPI Dashboard in Excel instantly.
2️⃣ Input Network Data: Enter data related to network uptime, signal strength, speed, and other relevant KPIs.
3️⃣ Monitor Network Performance: Track key network performance indicators to ensure smooth operations.
4️⃣ Analyze Trends: Use time-based analysis to assess how your network is performing over different periods.
5️⃣ Optimize Your Network: Use the insights from the dashboard to make informed decisions that improve network reliability and performance.
Who Can Benefit from the Telecom Network KPI Dashboard in Excel?
🔹 Telecom Operators & Service Providers
🔹 Network Engineers & Technicians
🔹 IT Managers & Infrastructure Teams
🔹 Data Analysts & Telecom Analysts
🔹 Business Owners in the Telecom Industry
🔹 Large Enterprises with Telecom Network Infrastructure
Ensure that your telecom network is performing at its best with the Telecom Network KPI Dashboard in Excel. Monitor key performance metrics, track network issues, and improve service delivery to enhance overall customer satisfaction.
Click here to read the Detailed blog post
Visit our YouTube channel to learn step-by-step video tutorials
Youtube.com/@PKAnExcelExpert


Reviews
There are no reviews yet.