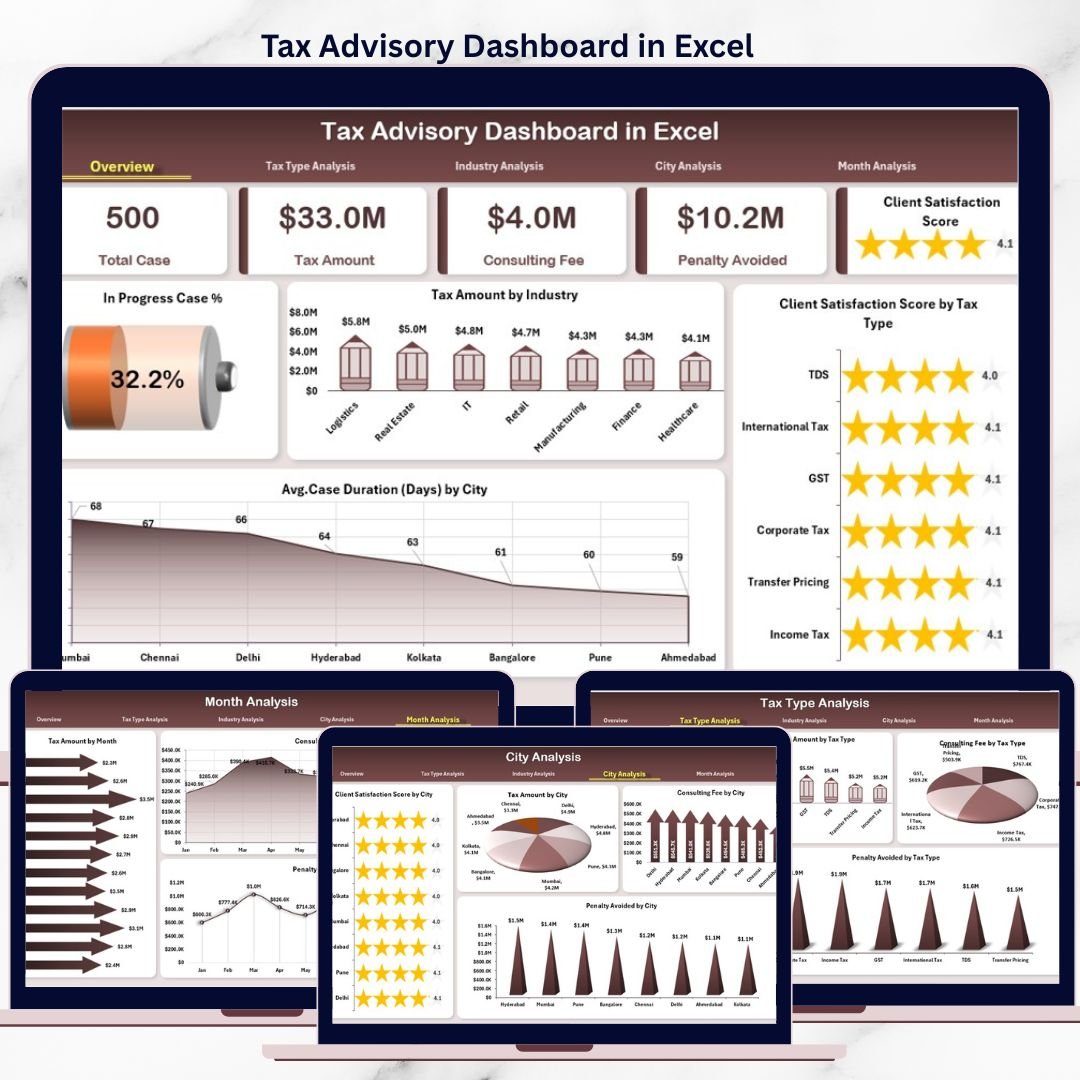
Managing tax advisory operations is not just about compliance—it is about visibility, performance, and value delivery. The Tax Advisory Dashboard in Excel is a professionally designed, ready-to-use Excel solution that converts raw tax advisory data into clear KPIs, interactive charts, and actionable insights.
Instead of working with scattered spreadsheets, delayed reports, and manual summaries, this dashboard gives you a single, centralized performance control panel for tax advisory operations. Whether you handle corporate tax, indirect tax, individual filings, or compliance consulting, this dashboard helps you stay proactive, organized, and data-driven.
🚀 Key Features of Tax Advisory Dashboard in Excel
✨ Centralized Tax Performance Tracking
Track all key tax advisory metrics—cases, fees, penalties avoided, satisfaction scores, and tax amounts—from one Excel file.
📊 Interactive Pivot Charts & KPIs
Dynamic pivot charts and KPI cards update instantly as you refresh data or apply slicers.
🧭 Built-in Page Navigator
Move across Overview, Tax Type, Industry, City, and Month analysis pages with one click.
🎯 Advanced Slicer Controls
Filter insights by tax type, industry, city, and month without touching formulas.
📈 Multi-Dimensional Analysis
Analyze performance by tax category, industry sector, geography, and time period.
⚙️ Excel-Only & Cost-Effective
No Power BI or third-party tools required—100% built using Excel native features.
🎨 Clean & Professional Layout
Designed for real business use with structured sheets and clear visuals.
📦 What’s Inside the Tax Advisory Dashboard in Excel
📁 Data Sheet
A structured input table to record all tax advisory case data such as tax type, industry, city, consulting fee, tax amount, penalty avoided, case duration, and satisfaction score.
📁 Support Sheet
Handles lookup tables, calculations, helper logic, and backend formulas to keep the dashboard fast and clean.
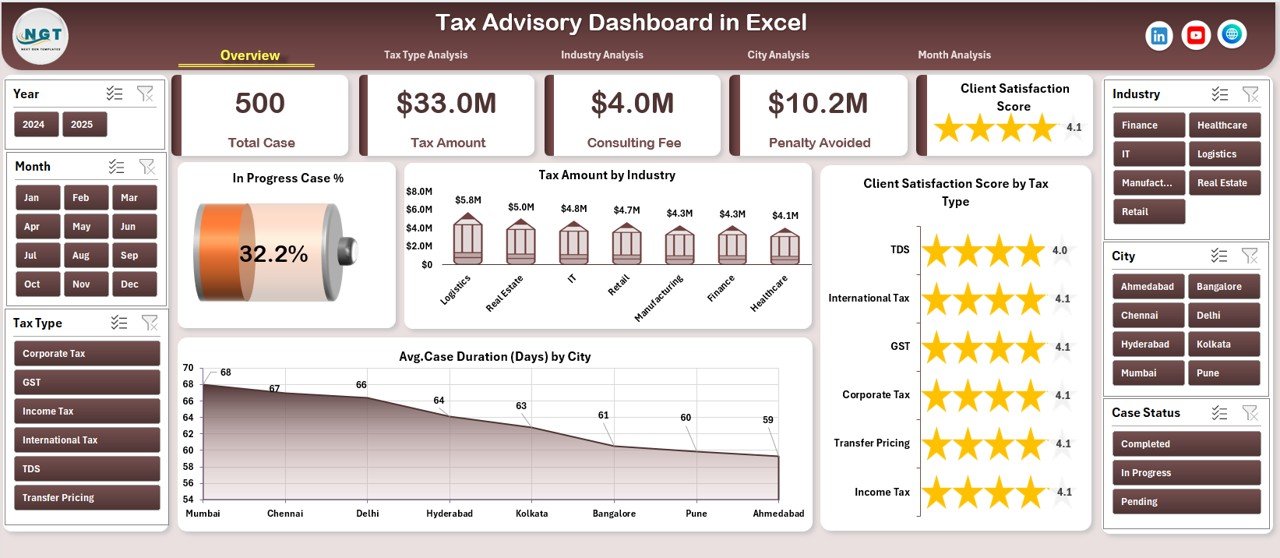
📁 Overview Page
High-level performance snapshot with KPI cards and summary charts for instant decision-making.
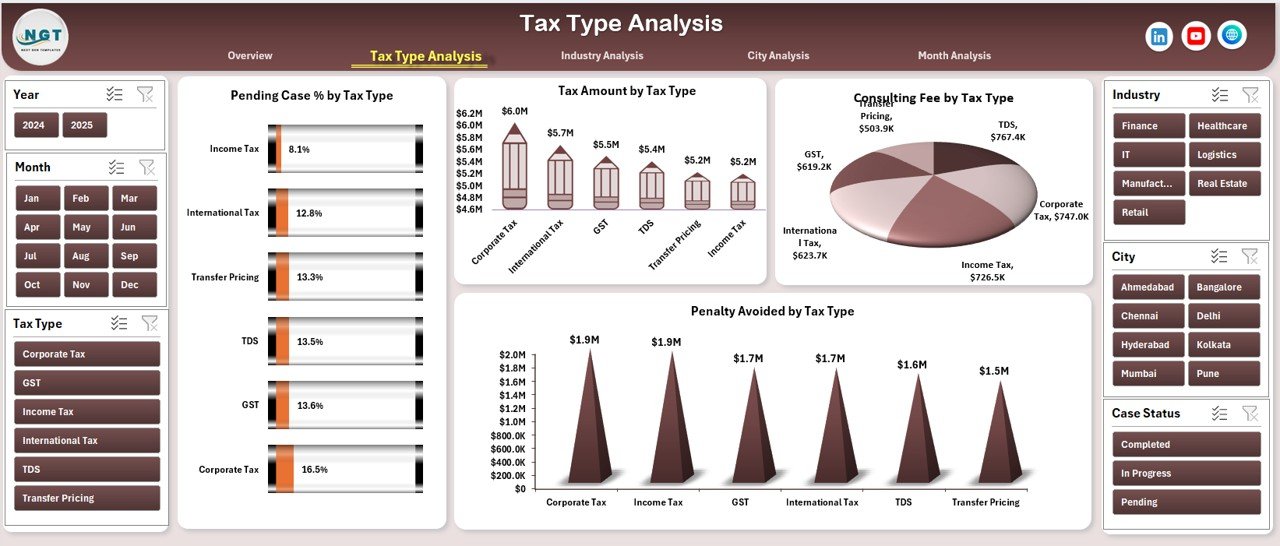
📁 Tax Type Analysis Page
Deep dive into backlog, revenue, penalties avoided, and workload by tax category.
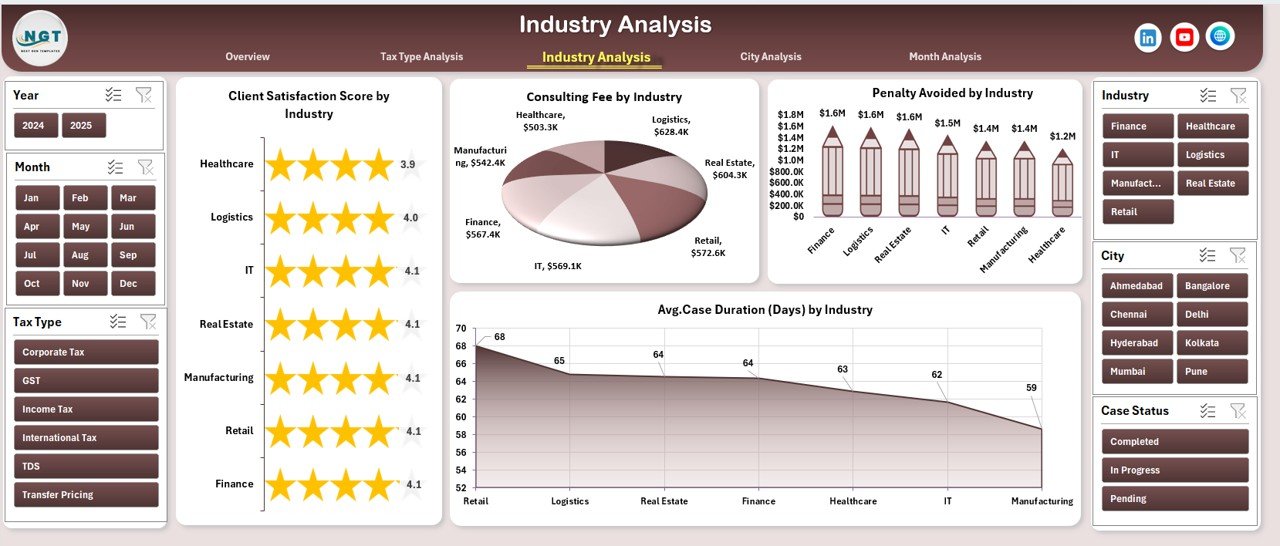
📁 Industry Analysis Page
Identify high-value industries, efficiency gaps, and satisfaction trends.
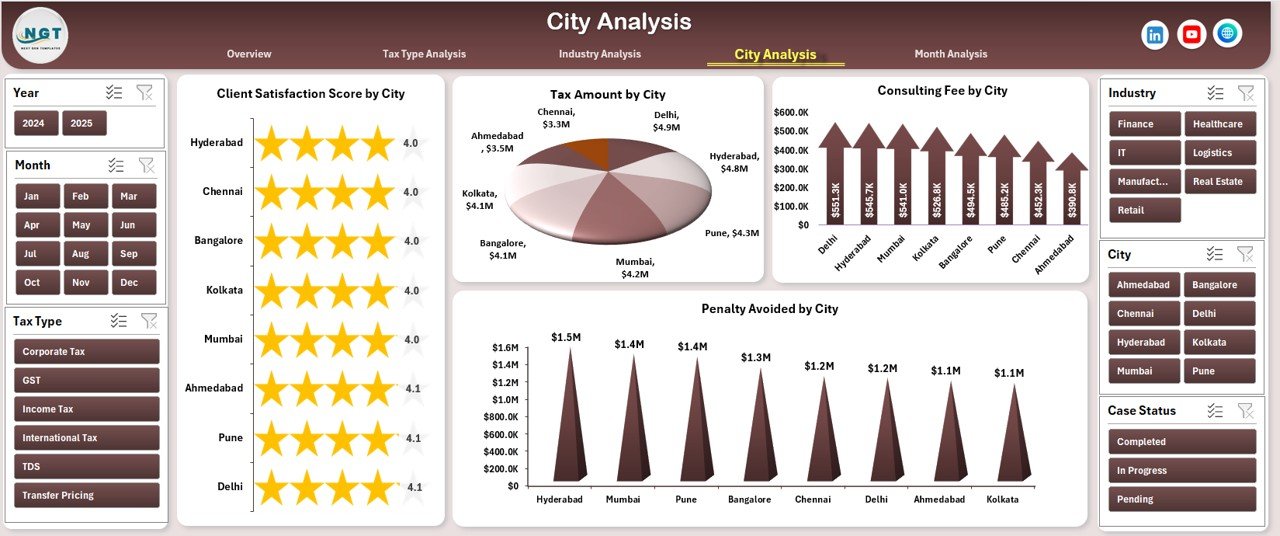
📁 City Analysis Page
Compare location-wise performance, revenue, and tax exposure.
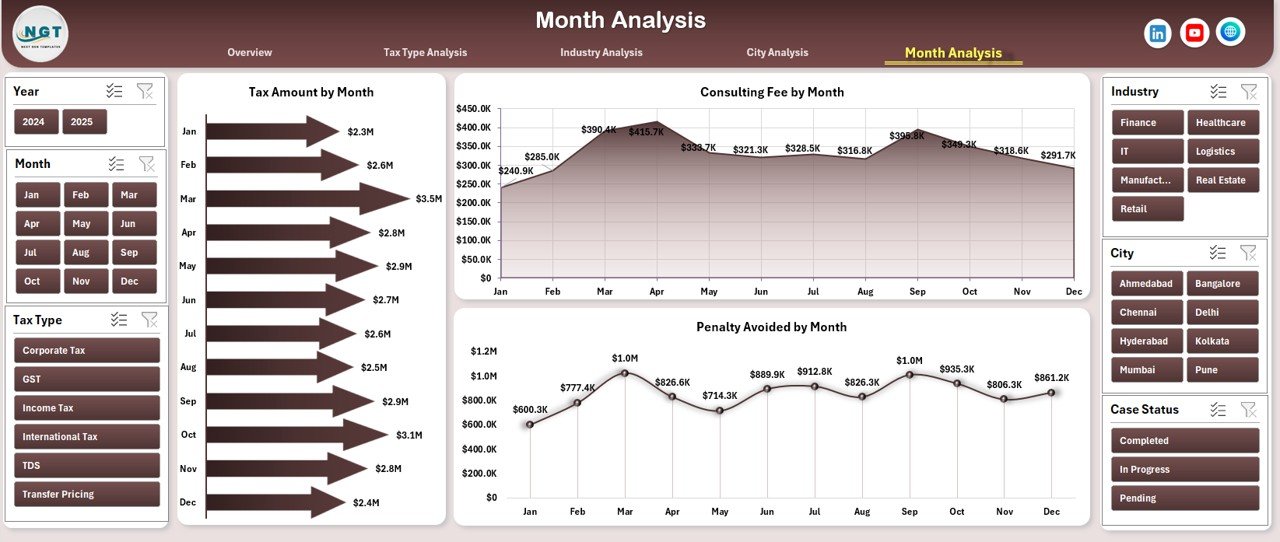
📁 Month Analysis Page
Track seasonal trends, workload fluctuations, and monthly revenue patterns.
📁 Page Navigator
Quick navigation panel for seamless user experience.
🛠️ How to Use the Tax Advisory Dashboard in Excel
1️⃣ Enter or paste your tax advisory records into the Data Sheet
2️⃣ Refresh pivot tables with one click
3️⃣ Use slicers to filter by tax type, industry, city, or month
4️⃣ Navigate pages using the Page Navigator
5️⃣ Instantly review KPIs, trends, and insights
6️⃣ Customize charts, KPIs, or colors as needed
No advanced Excel skills required—the logic stays hidden while insights stay visible.
👥 Who Can Benefit from This Tax Advisory Dashboard
👨💼 Tax Advisory Firms – Monitor performance, revenue, and efficiency
📊 Chartered Accountants – Track cases, penalties avoided, and client value
🏢 Corporate Tax Teams – Improve compliance monitoring and reporting
📈 Finance & Compliance Managers – Gain visibility across regions and services
🧾 Tax Consultants & Practitioners – Deliver better insights with less effort
If you work with tax data in Excel, this dashboard is built for you.
📘 Click here to read the Detailed blog post
🎥 Visit our YouTube channel to learn step-by-step video tutorials
👉 Youtube.com/@PKAnExcelExpert


Reviews
There are no reviews yet.