Modern synthetic fiber manufacturing demands speed, precision, and data-driven decision-making. Production efficiency, quality performance, operational costs, and business outcomes must be monitored continuously to remain competitive. However, many manufacturers still rely on disconnected spreadsheets and manual reporting, making performance tracking slow and inefficient.
That’s why we designed the Synthetic Fibers KPI Dashboard in Power BI — a powerful, ready-to-use analytics solution that converts complex manufacturing data into clear, interactive insights.
This professionally built Power BI dashboard helps organizations monitor KPIs in real time, analyze performance trends, and make smarter operational decisions using dynamic visuals and automated calculations. Instead of reviewing multiple reports, managers gain a centralized view of performance that enables faster action and improved productivity.
Whether you manage production operations, quality control, or manufacturing analytics, this dashboard delivers instant clarity without complex setup.
🚀 Key Features of Synthetic Fibers KPI Dashboard in Power BI
✅ Interactive KPI monitoring with dynamic slicers
✅ Month and KPI Group filters for flexible analysis
✅ Automated MTD & YTD performance tracking
✅ Target vs Actual comparison with status indicators
✅ Previous Year performance comparison
✅ Real-time visual performance insights
✅ Drill-through KPI definition analysis
✅ Excel-integrated backend for easy updates
The dashboard visually highlights KPI performance using intuitive indicators, allowing users to instantly identify success areas and performance gaps.
📦 What’s Inside the Synthetic Fibers KPI Dashboard in Power BI
This ready-to-use Power BI solution includes three interactive dashboard pages designed for complete manufacturing performance analysis:
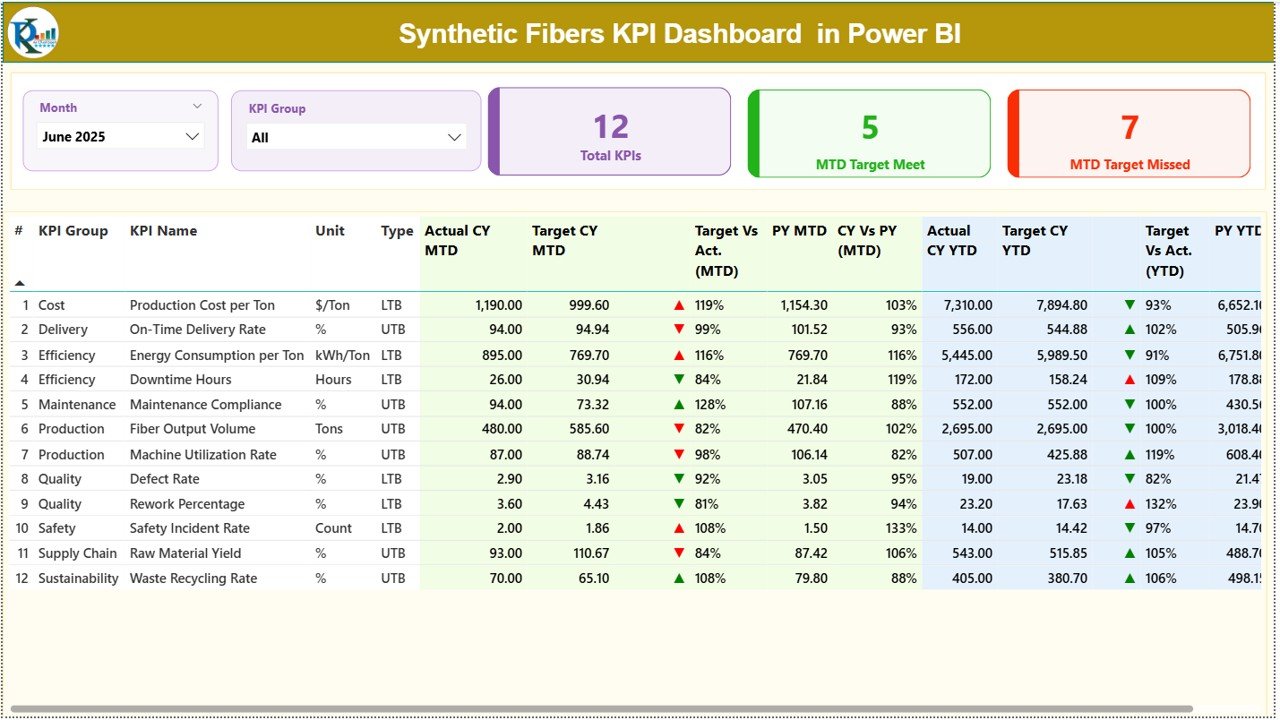
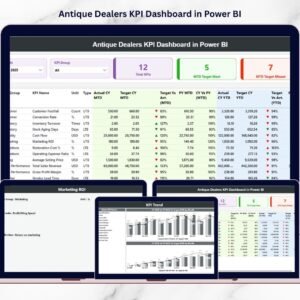
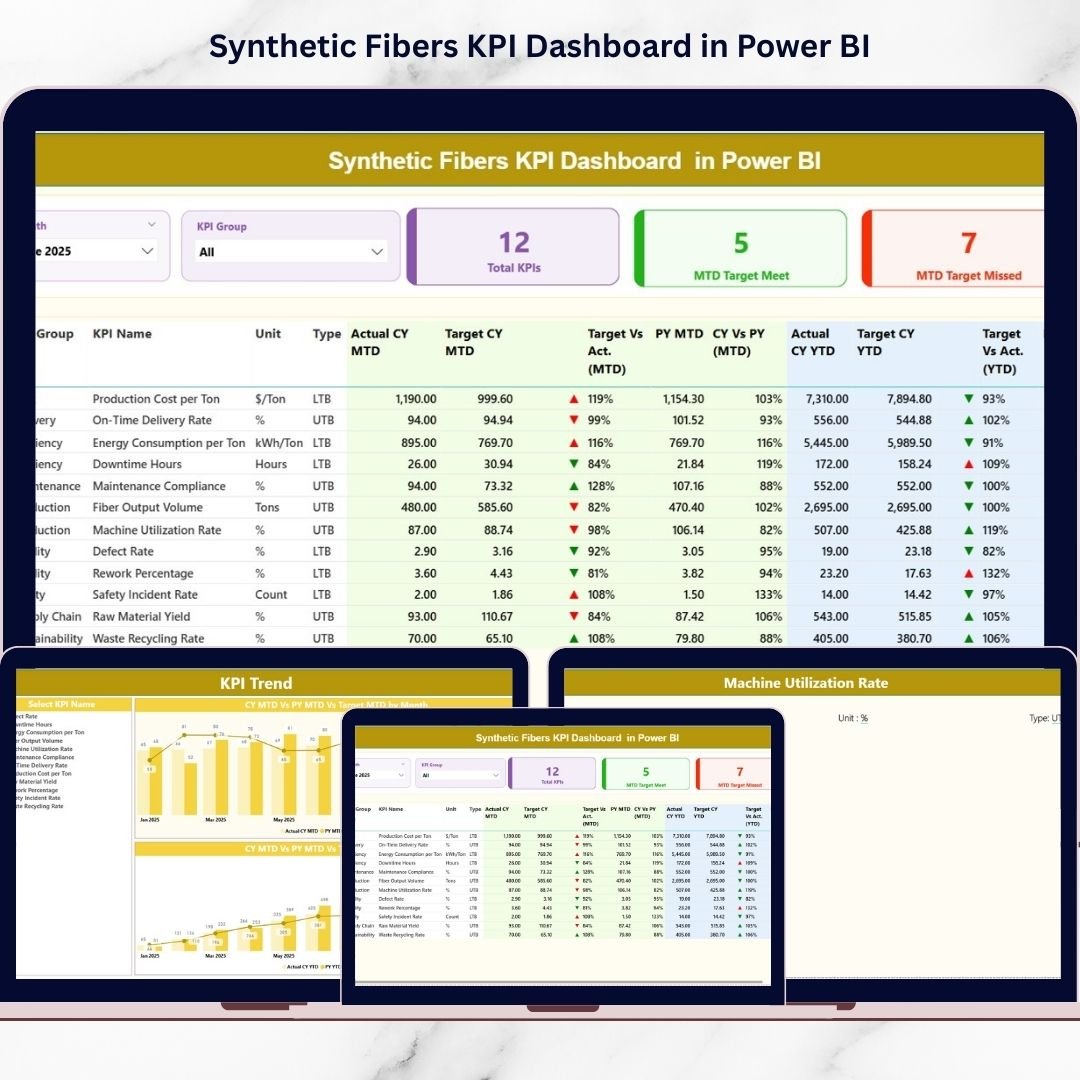
📊 Summary Page – Central performance overview displaying KPI cards, performance tables, and interactive slicers for instant insights.
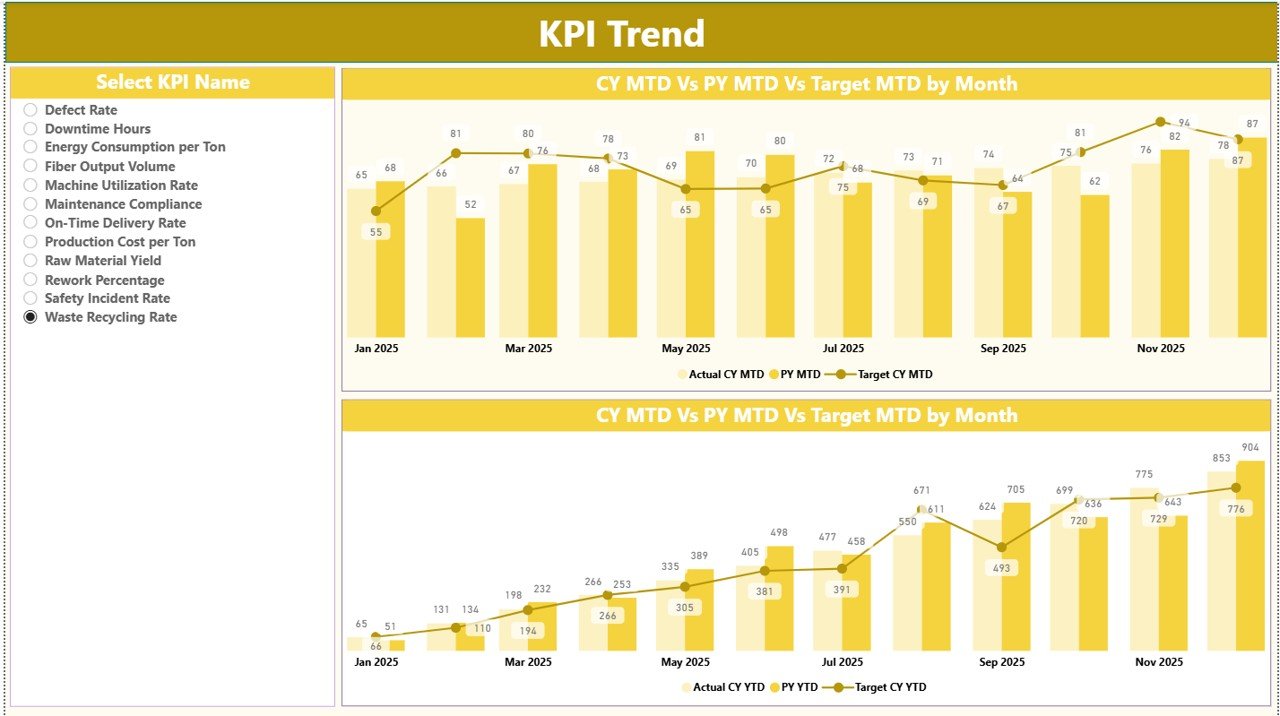
📈 KPI Trend Page – Advanced trend analysis showing MTD and YTD performance comparisons through dynamic combo charts.
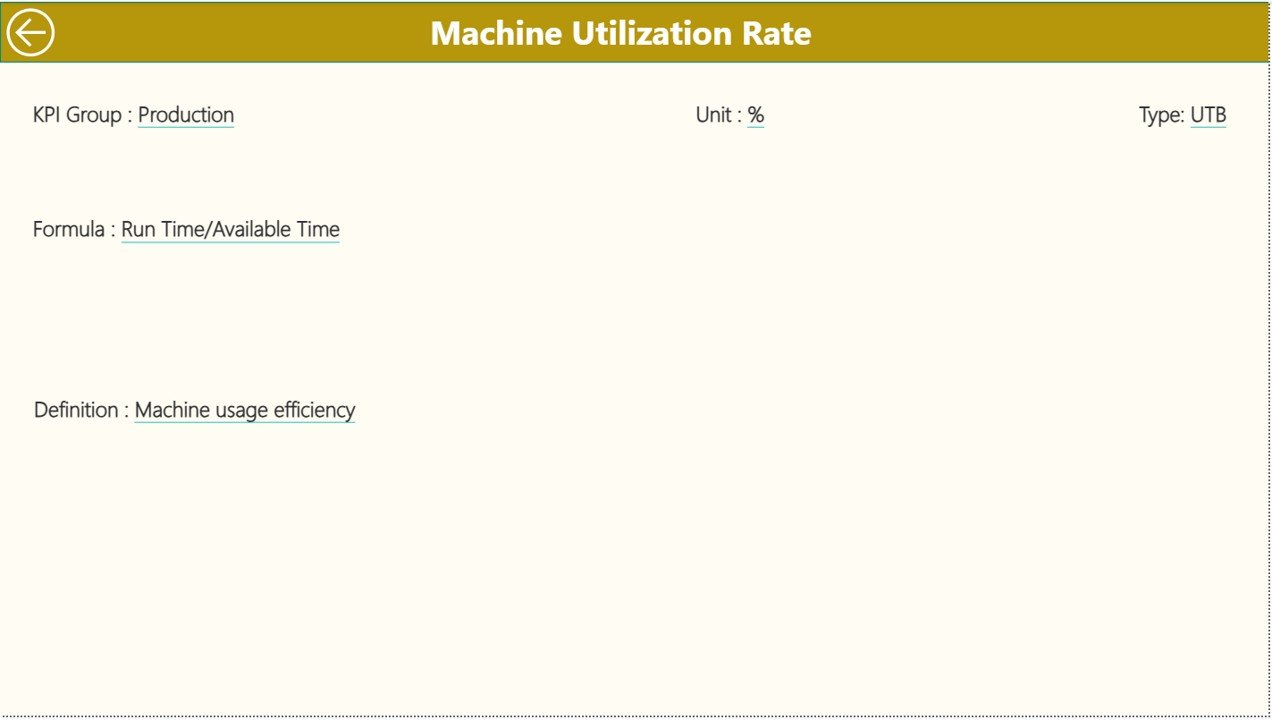
📘 KPI Definition Page – Drill-through page providing KPI formulas, definitions, and structural details for deeper understanding.
Additionally, the dashboard connects to an Excel data source containing:
📝 Input Actual Sheet – Enter actual KPI values
🎯 Input Target Sheet – Define performance targets
📚 KPI Definition Sheet – Maintain KPI structure and logic
Together, these components create a scalable and professional KPI monitoring system.
⚙️ How to Use the Synthetic Fibers KPI Dashboard in Power BI
Getting started is simple and requires minimal technical expertise:
1️⃣ Populate KPI definitions in the Excel data file.
2️⃣ Enter monthly target values.
3️⃣ Add actual KPI performance numbers.
4️⃣ Connect or refresh data in Power BI Desktop.
5️⃣ Use slicers to analyze KPIs dynamically.
6️⃣ Monitor trends and performance instantly.
Because calculations and visuals are automated, users focus on insights rather than report preparation.
👥 Who Can Benefit from This Synthetic Fibers KPI Dashboard
This dashboard is ideal for professionals across manufacturing organizations:
✅ Production Managers tracking efficiency
✅ Plant Heads monitoring operational health
✅ Quality Control Teams analyzing defects
✅ Operations Analysts reviewing trends
✅ Business Intelligence Professionals
✅ Manufacturing Consultants & Decision Makers
Every stakeholder gains actionable insights that improve planning and accountability.
By transforming operational data into interactive visual analytics, this dashboard helps organizations:
✔ Detect performance issues early
✔ Improve strategic planning
✔ Monitor KPI trends continuously
✔ Strengthen operational transparency
✔ Build a data-driven manufacturing culture
Unlike traditional reporting systems, Power BI provides advanced visualization while maintaining simplicity through Excel-based data management.
### Click hare to read the Detailed blog post
Explore the complete dashboard explanation, implementation guide, and KPI framework in our detailed article.
👉 YouTube Channel – @PKAnExcelExpert