
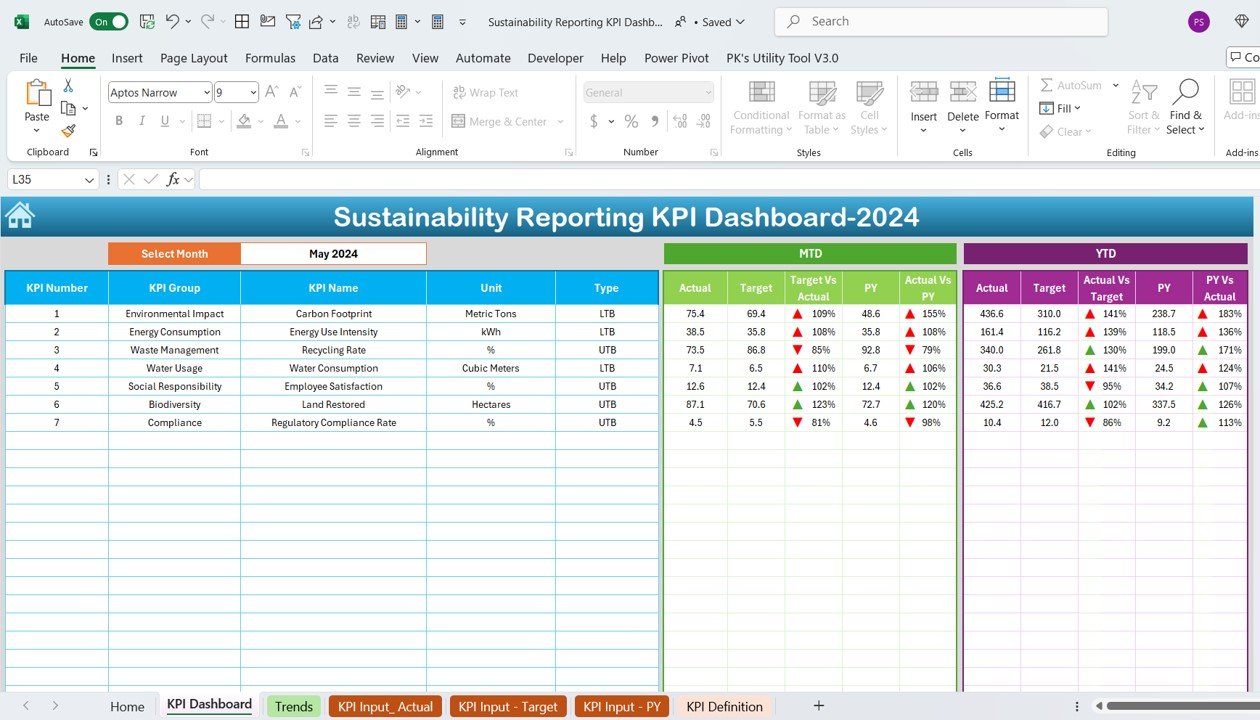
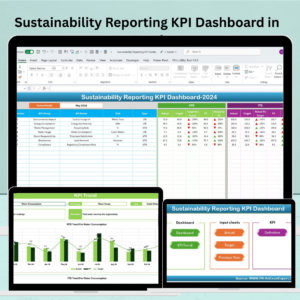
The Sustainability Reporting KPI Dashboard in Excel is a powerful tool designed to help organizations track and manage their sustainability initiatives and report on key environmental, social, and governance (ESG) metrics. This Excel-based dashboard simplifies the process of monitoring your company’s sustainability performance and provides real-time insights into critical sustainability KPIs, making it easier for teams to stay on top of their sustainability goals and initiatives.
Whether you’re working to reduce your carbon footprint, improve energy efficiency, or enhance social responsibility efforts, this dashboard will help you track your progress, make data-driven decisions, and generate insightful sustainability reports. Designed for organizations of all sizes, this tool empowers teams to measure sustainability performance and align with global sustainability standards.
Key Features of the Sustainability Reporting KPI Dashboard in Excel
📊 Comprehensive Sustainability KPI Tracking
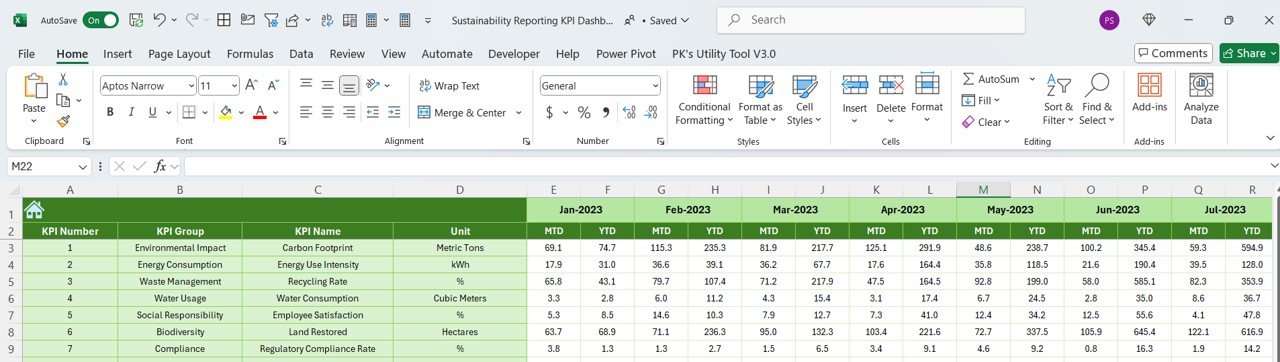
Track a wide range of sustainability KPIs including carbon emissions, energy usage, water consumption, waste reduction, and community engagement. Monitor performance in real time to ensure continuous improvement.
🌱 Environmental Impact Monitoring
Track the environmental impact of your operations, including CO2 emissions, energy consumption, and resource usage. This feature enables businesses to monitor their sustainability footprint and take steps to reduce environmental impact.
📈 Social Responsibility Metrics
Measure key social responsibility metrics such as employee engagement, diversity and inclusion efforts, community outreach, and labor rights compliance. Track your organization’s contributions to society and ensure that all initiatives are in line with company values.
📅 Time-Based Performance Monitoring
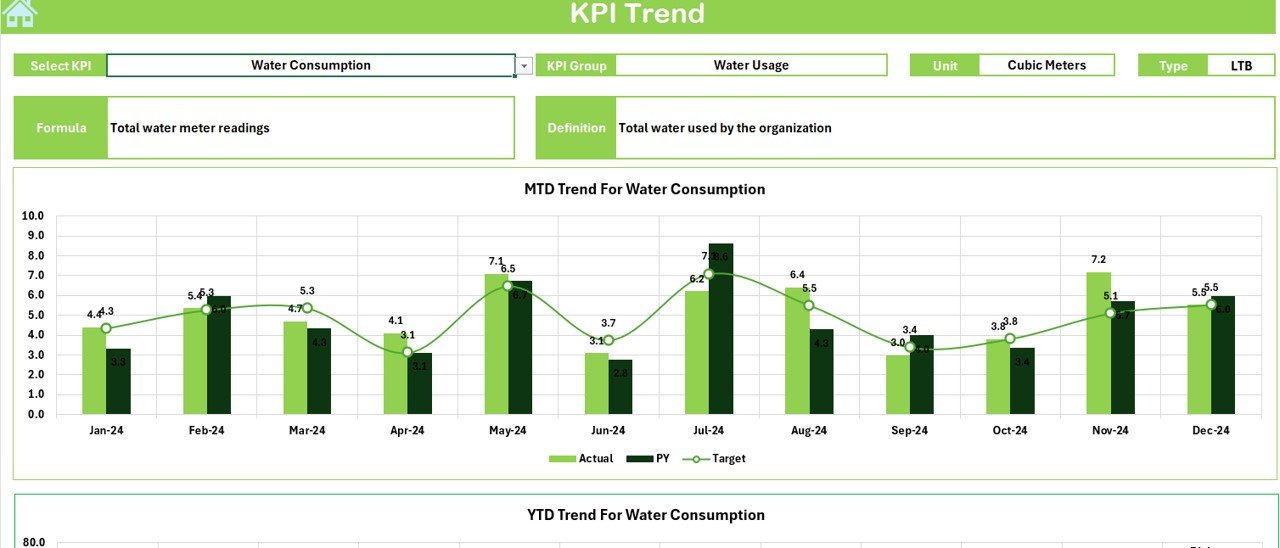
Monitor your sustainability KPIs over different time periods (monthly, quarterly, or annually). View progress toward long-term sustainability goals and identify areas for improvement.
🔑 Sustainability Reporting
Generate clear and comprehensive sustainability reports for stakeholders. Visualize sustainability performance with dynamic charts and graphs that provide actionable insights into your organization’s achievements and areas needing attention.
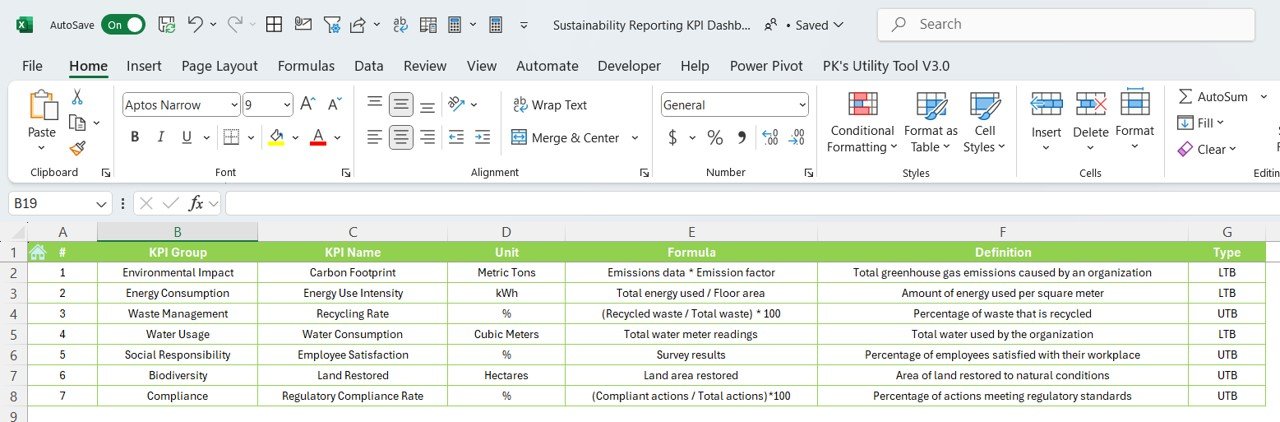
⚙️ Customizable Metrics & KPIs
Customize the dashboard to include additional metrics specific to your organization’s sustainability initiatives. Track any key performance indicators that align with your corporate sustainability strategy.
Why You’ll Love the Sustainability Reporting KPI Dashboard in Excel

✅ Track & Improve Sustainability Performance
Monitor key sustainability metrics and track your organization’s performance over time. Identify trends, uncover inefficiencies, and optimize your sustainability initiatives.
✅ Enhance Reporting & Transparency
Generate detailed sustainability reports that are easy to share with stakeholders. Improve transparency in your sustainability practices and show your commitment to corporate social responsibility.
✅ Align with Global Sustainability Standards
Ensure that your organization’s sustainability initiatives are in line with global ESG standards. Use the dashboard to track compliance with industry benchmarks and regulations.
✅ Data-Driven Decision Making
Make informed decisions based on real-time data. Analyze trends and patterns in your sustainability efforts to improve operational efficiency and contribute positively to the environment.
✅ Customizable & Scalable
Tailor the dashboard to your company’s unique sustainability goals. Whether you’re tracking energy consumption in a factory or monitoring social impact initiatives, this tool is customizable to suit your needs.
What’s Inside the Sustainability Reporting KPI Dashboard in Excel?
-
Environmental Impact Monitoring: Track CO2 emissions, energy use, and resource consumption.
-
Social Responsibility Metrics: Monitor employee engagement, community outreach, and labor rights compliance.
-
Time-Based Performance Analysis: Track progress over months, quarters, or years.
-
Sustainability Reporting: Generate detailed reports with visual charts and graphs.
-
Customizable Metrics: Tailor the dashboard to fit your specific sustainability goals.
-
Real-Time Data Tracking: Monitor sustainability KPIs as data is updated.
How to Use the Sustainability Reporting KPI Dashboard in Excel
1️⃣ Download the Template: Instantly access the Sustainability Reporting KPI Dashboard in Excel.
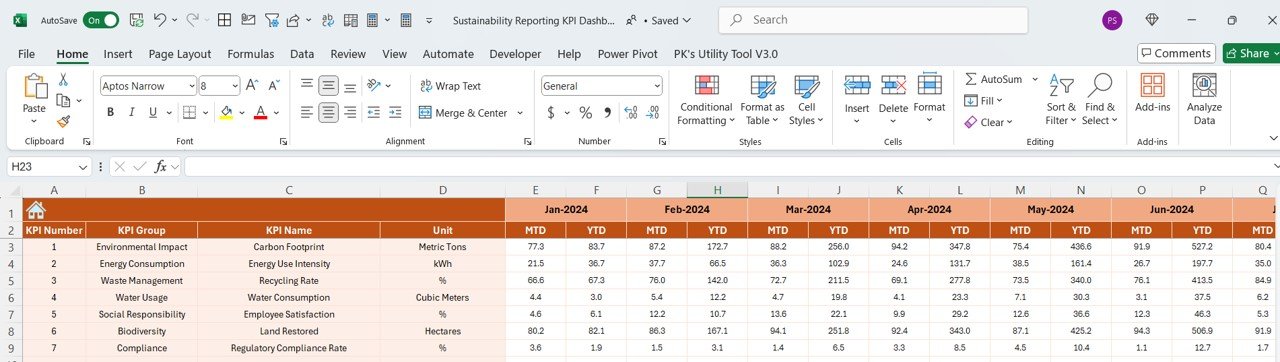
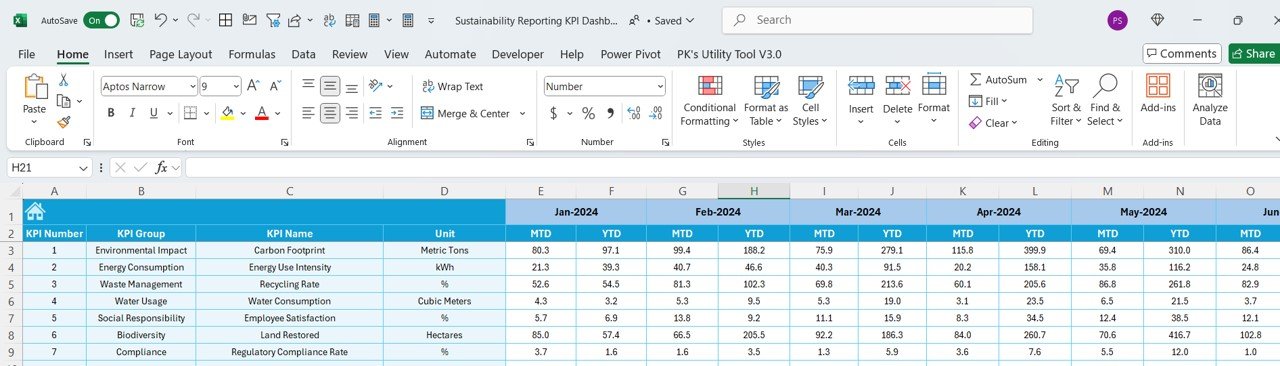
2️⃣ Input Sustainability Data: Enter data for key sustainability metrics such as energy consumption, water usage, and waste management.
3️⃣ Track & Monitor KPIs: Monitor progress toward your sustainability goals and track changes over time.
4️⃣ Generate Reports & Visualize Data: Use built-in charts and graphs to visualize your sustainability performance and generate reports.
5️⃣ Optimize Your Sustainability Strategy: Use insights from the dashboard to improve your organization’s sustainability practices and reduce environmental impact.
Who Can Benefit from the Sustainability Reporting KPI Dashboard in Excel?
🔹 Sustainability Managers & Coordinators
🔹 Corporate Social Responsibility (CSR) Teams
🔹 Environmental Analysts & Consultants
🔹 E-commerce Platforms & Large Enterprises
🔹 Small & Medium Enterprises (SMBs) with Sustainability Initiatives
🔹 Nonprofits & Environmental Organizations
🔹 Companies Seeking to Align with ESG Standards
Ensure that your sustainability practices are tracked, monitored, and optimized with the Sustainability Reporting KPI Dashboard in Excel. Track environmental and social impact, improve efficiency, and generate valuable insights to guide your sustainability efforts.
Click here to read the Detailed blog post
Visit our YouTube channel to learn step-by-step video tutorials
Youtube.com/@PKAnExcelExpert


Reviews
There are no reviews yet.