In a world where efficiency equals profitability, managing your supply chain effectively can make or break your business. Whether you’re sourcing raw materials, managing logistics, or tracking supplier performance—data visibility is the secret weapon for success.
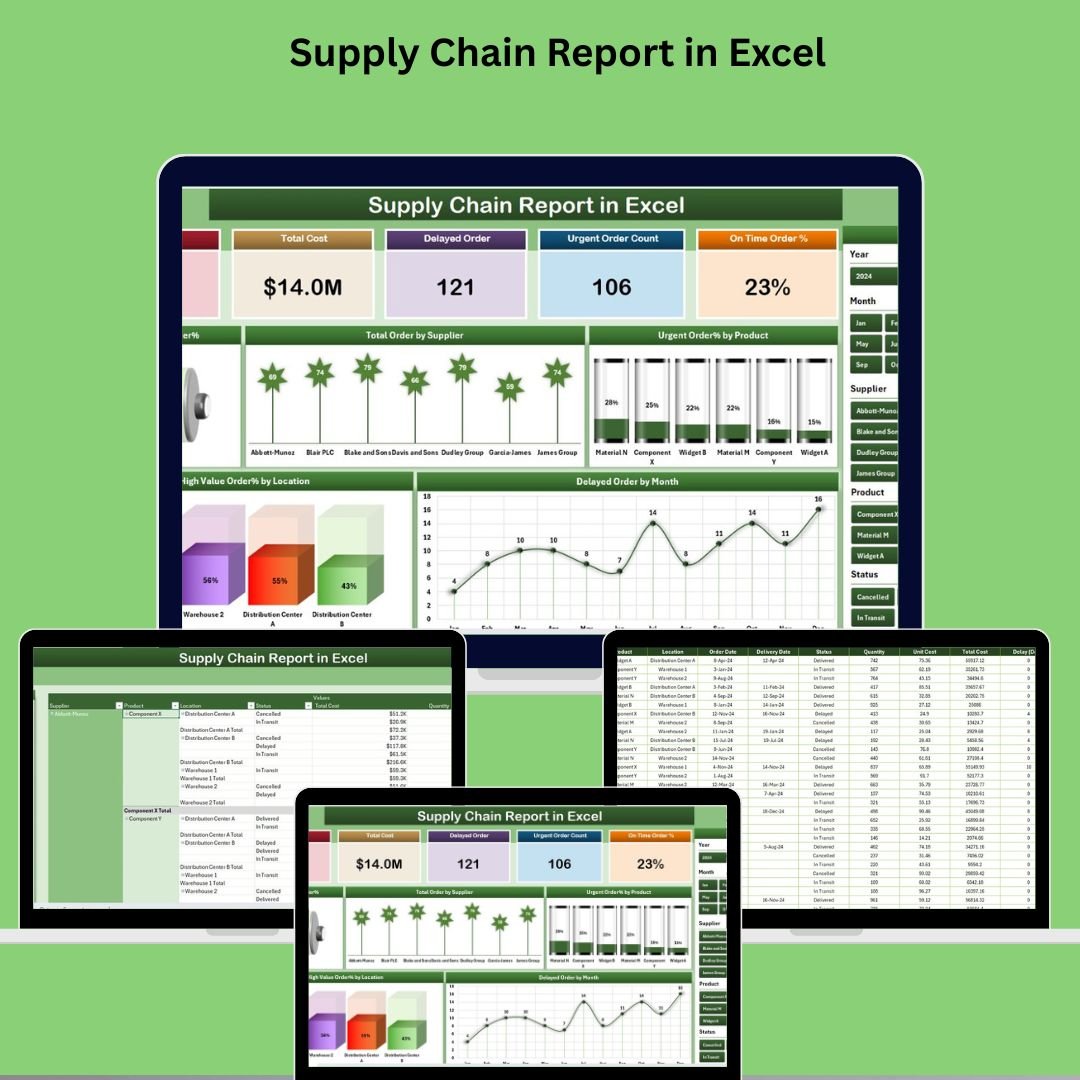
📊 Introducing the Supply Chain Report in Excel – a ready-to-use, fully customizable Excel-based reporting system that turns your raw supply data into actionable insights. Built for supply chain professionals, procurement teams, and business leaders, this tool gives you total control over operations—all without investing in expensive software.
✅ Key Features of Supply Chain Report in Excel
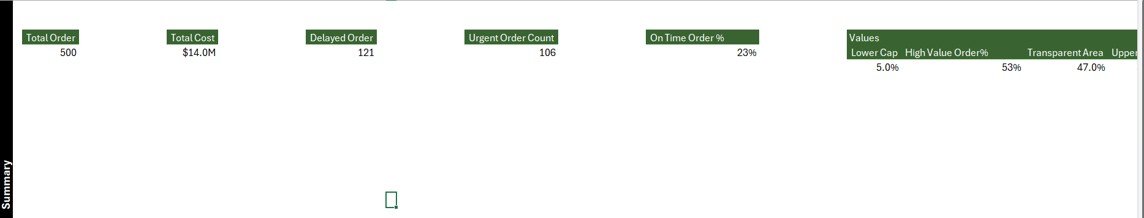
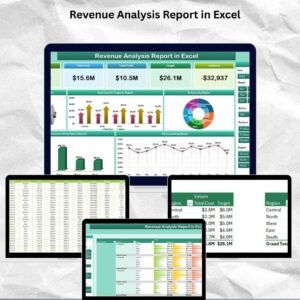
🧭 Summary Page – One-Click Visibility
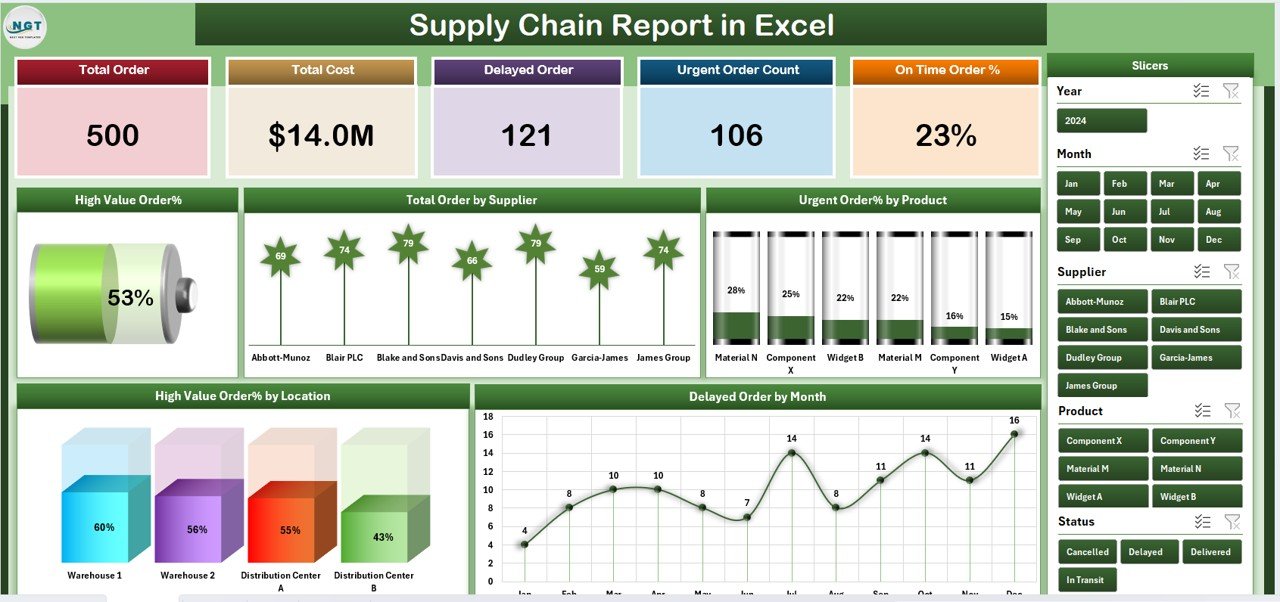
Get instant insights into your supply chain with:
-
📌 High Value Order %
-
📦 Total Orders by Supplier
-
🚨 Urgent Orders by Product
-
🌍 High Value Orders by Location
-
🕒 Delayed Orders by Month
Use the right-side slicers to filter by time, product, supplier, or location for deeper analysis.
📊 Interactive Charts (bar, pie, and line) help you visualize data fast and make informed decisions.
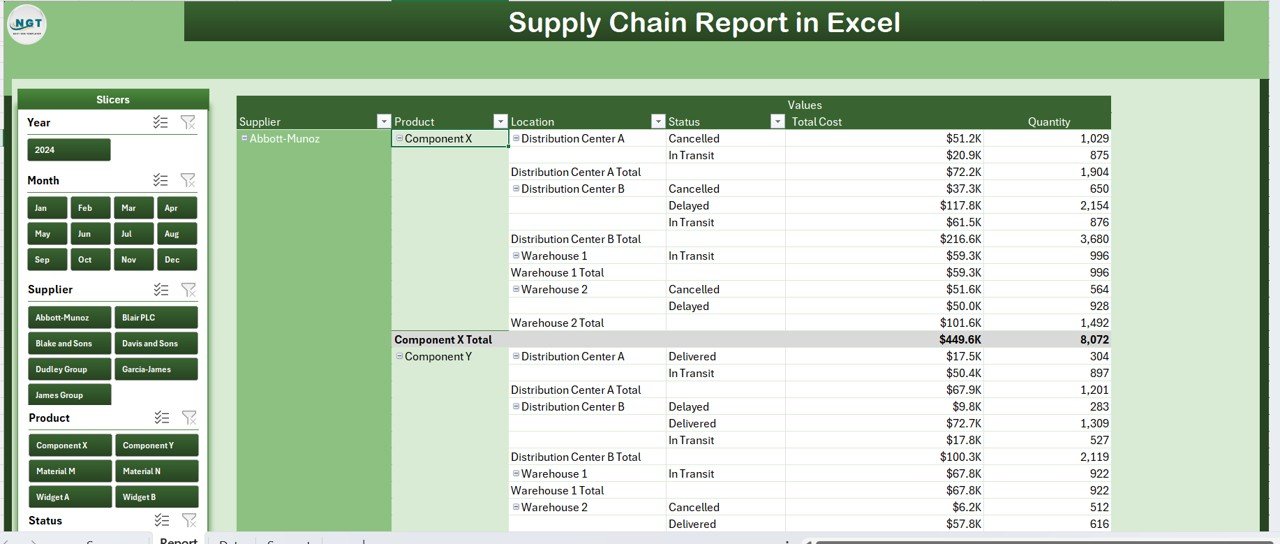
📑 Report Page – Detailed Data View
This section gives you a granular view of all transactions. Use left-side slicers to filter by any parameter.
Columns include:
-
🔢 Order ID
-
🏢 Supplier Name
-
🛒 Product Type
-
📅 Order Date
-
🚚 Delivery Status
-
💲 Order Value
-
⚠️ Priority Level
Perfect for tracking issues, comparing vendors, and managing performance.
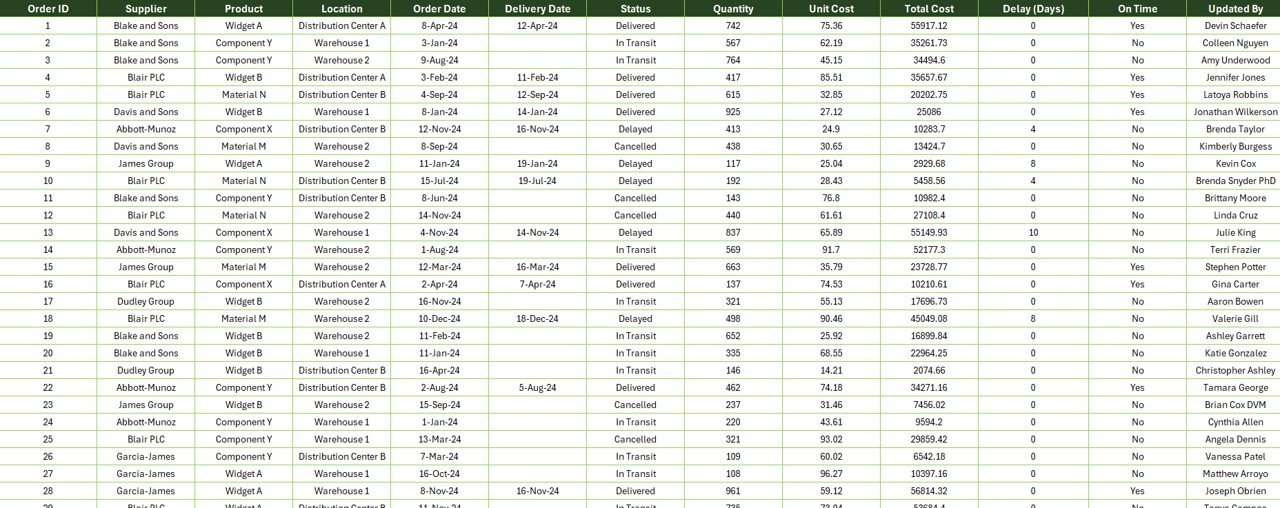
📂 Data Sheet – Your Data Engine
This is where you input or import your supply chain data. Paste, connect, or upload raw data to auto-populate the dashboard.
✔️ Compatible with external data sources
✔️ Power Query-ready for automation
🔧 Support Sheet – Keep It Consistent
Manage your dropdown lists and lookup values here. It keeps your slicers clean and your data entries error-free.
Includes:
-
Product Lists
-
Supplier Names
-
Locations
-
Priority Levels
-
Status Codes
📦 What’s Inside the Supply Chain Report Template?
✅ 4 Sheet Tabs:
-
Summary Dashboard
-
Report Page
-
Data Sheet
-
Support Sheet
🧠 Powered by Excel slicers, pivot charts, and formulas. No coding or macros needed. 100% editable and customizable.
🛠️ How to Use the Supply Chain Report in Excel
-
📥 Download & Open the Excel file
-
🗂️ Paste Your Data into the Data Sheet
-
🔄 Customize Dropdowns in the Support Sheet
-
📊 View Charts on the Summary Page
-
🔍 Filter Specifics on the Report Page
-
💾 Update Weekly/Monthly for real-time decision-making
No technical skills needed—just basic Excel knowledge.
👥 Who Can Benefit from This Dashboard?
-
🏭 Manufacturing Managers
-
🛒 Procurement Teams
-
🚛 Logistics Coordinators
-
🧮 Operations Analysts
-
🏪 Retail Managers
-
💼 Small & Medium Businesses
Whether you’re managing vendors, urgent orders, or supply delays—this tool helps you make decisions faster.
📚 Click here to read the Detailed blog post
📺 Visit our YouTube channel to learn step-by-step video tutorials


Reviews
There are no reviews yet.