
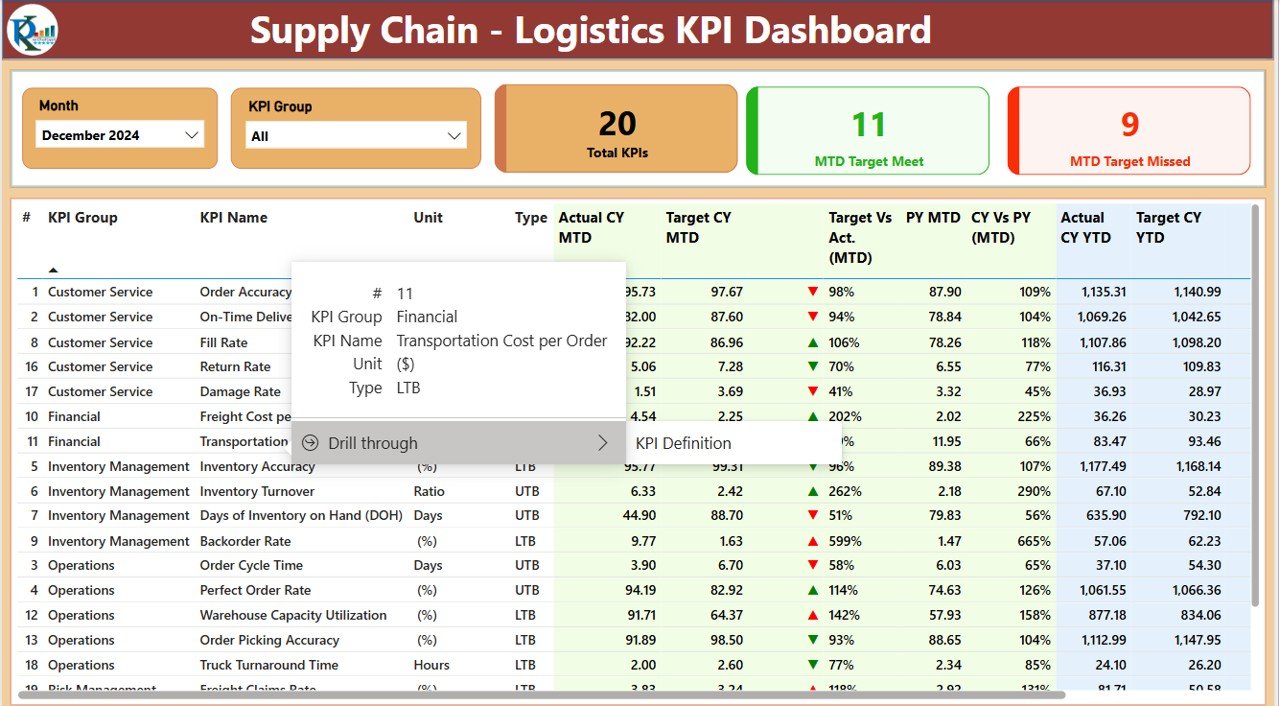
The Supply Chain – Logistics KPI Dashboard in Power BI is a powerful and interactive tool designed to help businesses and logistics managers track, monitor, and analyze key performance indicators (KPIs) related to their supply chain and logistics operations. With this dashboard, you can get a comprehensive overview of your entire supply chain, from inventory management and shipping performance to supplier efficiency and delivery times, enabling you to make data-driven decisions that optimize efficiency and reduce costs.
This Power BI template provides real-time data and visual insights into the performance of your logistics operations. Whether you’re overseeing a global supply chain, managing a network of suppliers, or optimizing transportation routes, this dashboard offers all the essential tools you need to streamline your supply chain logistics and improve operational performance.
Key Features of the Supply Chain Logistics KPI Dashboard in Power BI
🚚 Track Shipping & Delivery Performance
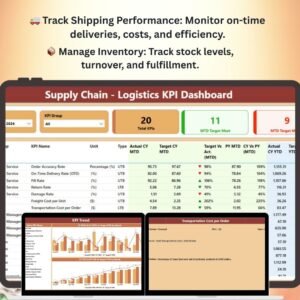
Monitor on-time deliveries, shipping costs, and transportation efficiency. The dashboard tracks delivery times, providing key insights into areas for improvement in your logistics processes.
📦 Inventory Management & Turnover
Track stock levels, product turnover, and order fulfillment rates. Ensure that your inventory is optimized to meet demand while minimizing excess stock or stockouts.
📊 Supplier Performance Monitoring
Monitor key metrics related to supplier performance, including delivery accuracy, order fulfillment rates, and lead times. Identify top-performing suppliers and areas for improvement.
💡 Order Fulfillment & Backlog Tracking
Analyze order fulfillment rates, backlogs, and delays to optimize your logistics operations. Track orders from placement to delivery to ensure timely fulfillment and reduce bottlenecks.
📈 Cost Analysis & Budget Tracking
Monitor logistics-related costs such as transportation, warehousing, and inventory management. Track these costs against your budget to ensure efficient resource allocation and cost savings.
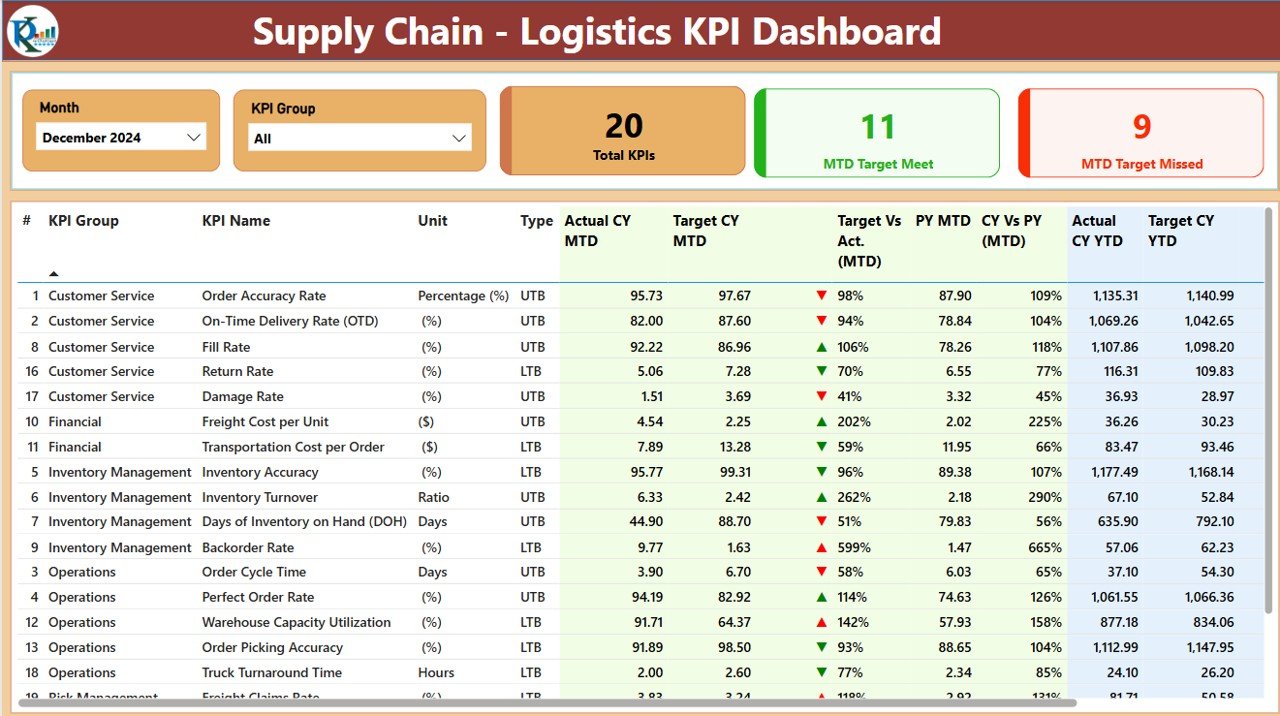
🖥️ Interactive & Customizable Dashboard
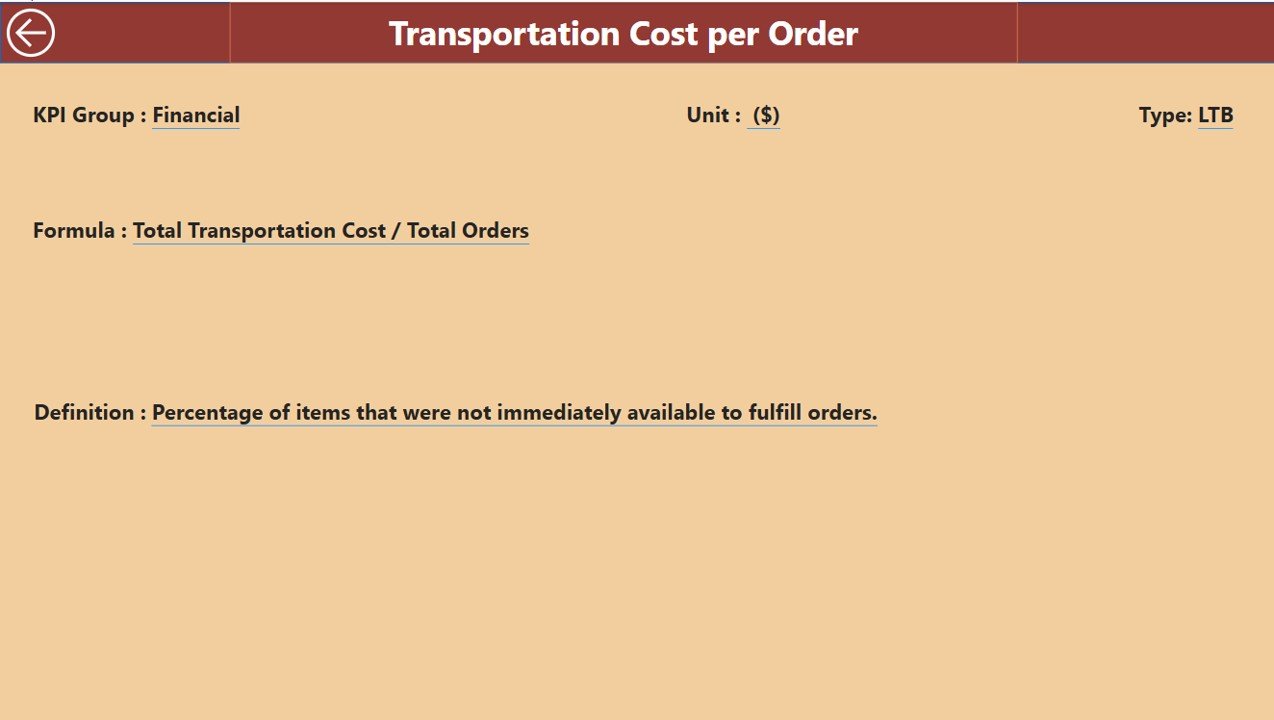
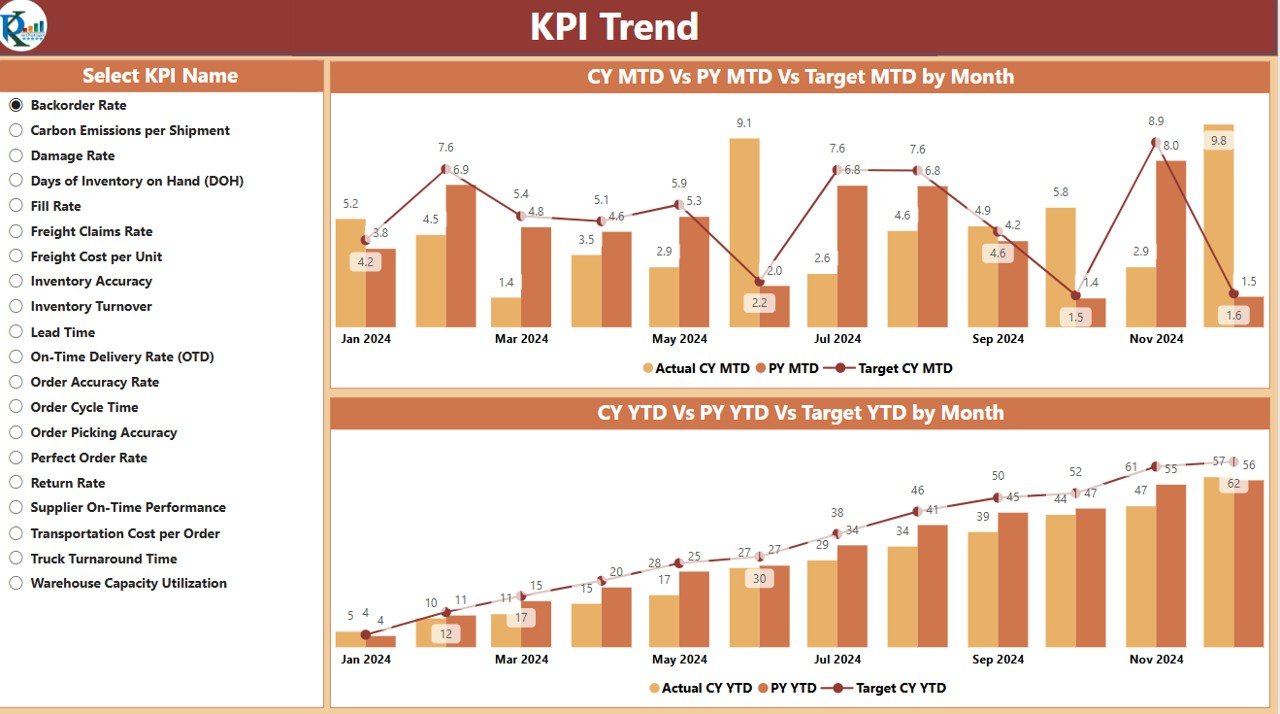
The Power BI dashboard is fully interactive, allowing you to filter, drill down, and visualize your logistics data based on specific regions, timeframes, or product categories. It’s also customizable to suit your specific business needs.
Why You’ll Love the Supply Chain Logistics KPI Dashboard in Power BI
✅ Monitor Critical Logistics Metrics
Track all your key logistics KPIs, from shipping and delivery performance to inventory turnover and supplier efficiency, all in one dashboard.
✅ Optimize Your Supply Chain
Gain real-time insights into bottlenecks, delays, and inefficiencies in your logistics operations. Use this data to optimize delivery routes, manage inventory more effectively, and streamline processes.
✅ Improve Supplier Relationships
Track and analyze supplier performance to identify areas for improvement and build stronger, more reliable supplier relationships.
✅ Ensure On-Time Deliveries
Track on-time deliveries and fulfillment rates to ensure your customers receive their orders on time, improving customer satisfaction and retention.
✅ Fully Customizable & Scalable
Adapt the dashboard to your unique logistics requirements. Whether you’re managing a single warehouse or a global supply chain, this template scales to meet your needs.
What’s Inside the Supply Chain Logistics KPI Dashboard in Power BI?
- Shipping & Delivery Performance: Track on-time deliveries, shipping costs, and delivery efficiency.
- Inventory Management: Monitor stock levels, turnover rates, and order fulfillment.
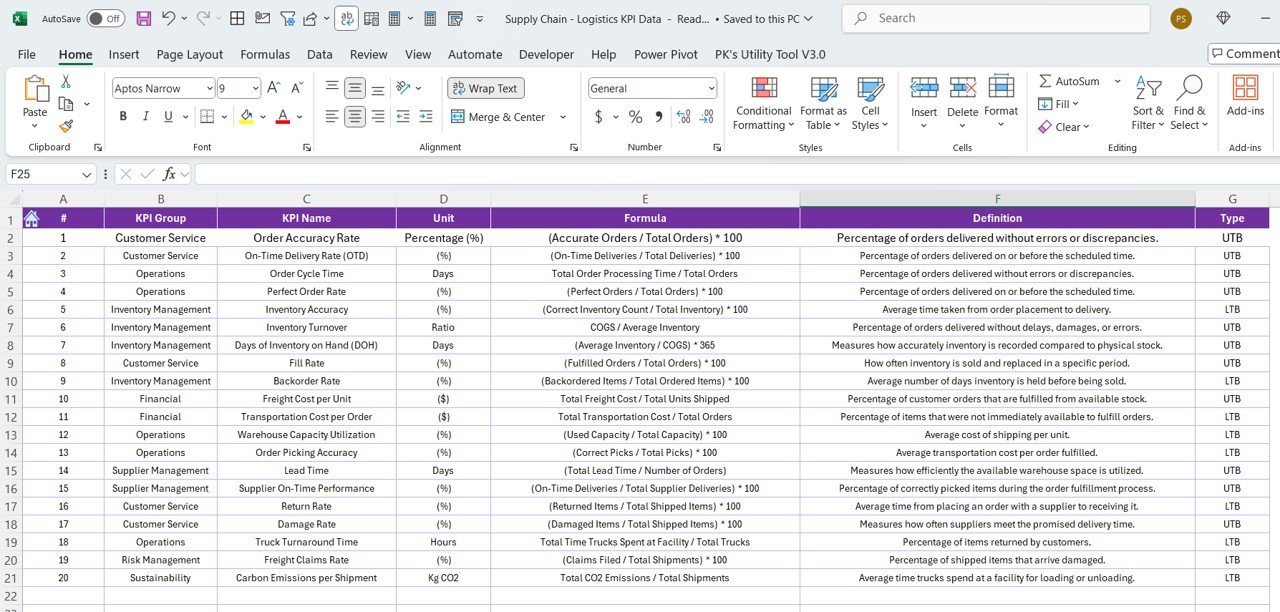
- Supplier Performance: Measure key metrics such as order accuracy and lead times.
- Order Fulfillment: Analyze fulfillment rates, backlogs, and delays.
- Cost & Budget Tracking: Monitor logistics-related costs and compare them to your budget.
- Interactive Visualizations: Drill down into data and analyze KPIs by region, product, or timeframe.
How to Use the Supply Chain Logistics KPI Dashboard in Power BI
1️⃣ Download the Template: Get immediate access to the Supply Chain Logistics KPI Dashboard in Power BI.
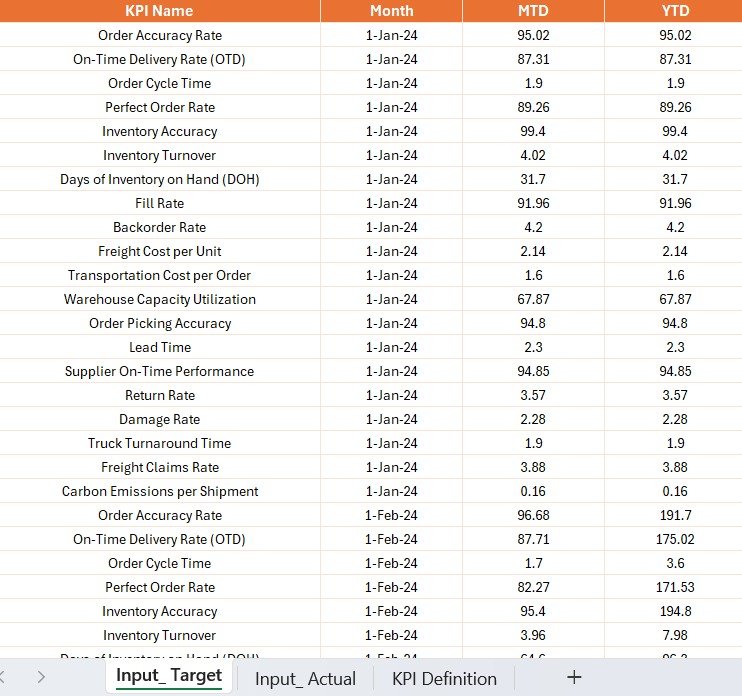
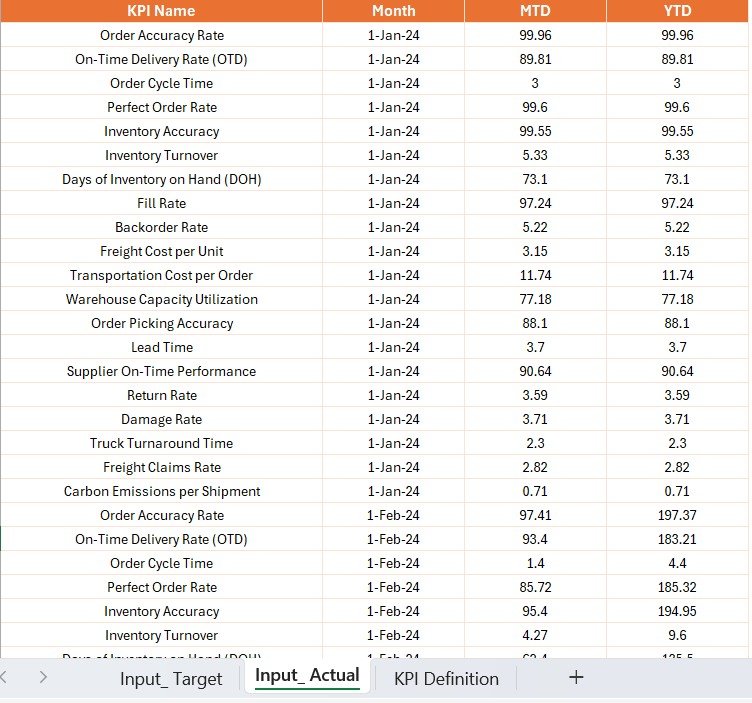
2️⃣ Input Your Data: Enter your logistics data, including shipping performance, inventory levels, supplier data, and costs.
3️⃣ Track & Monitor KPIs: Use the dashboard to track shipping performance, inventory turnover, supplier performance, and more.
4️⃣ Analyze & Optimize: Use real-time insights to identify areas for improvement in your supply chain and logistics operations.
5️⃣ Stay Informed: Continuously monitor key performance indicators to ensure your logistics operations are running efficiently and cost-effectively.
Who Can Benefit from the Supply Chain Logistics KPI Dashboard in Power BI?
🔹 Logistics & Supply Chain Managers
🔹 Inventory & Warehouse Managers
🔹 Transportation & Shipping Managers
🔹 Procurement & Supplier Relationship Managers
🔹 E-commerce & Retail Businesses
🔹 Manufacturing & Distribution Companies
Take control of your supply chain and logistics operations with the Supply Chain Logistics KPI Dashboard in Power BI. Monitor key metrics, track performance, and optimize your processes for better efficiency and reduced costs.
Click here to read the Detailed blog post
Visit our YouTube channel to learn step-by-step video tutorials
Youtube.com/@PKAnExcelExpert


Reviews
There are no reviews yet.