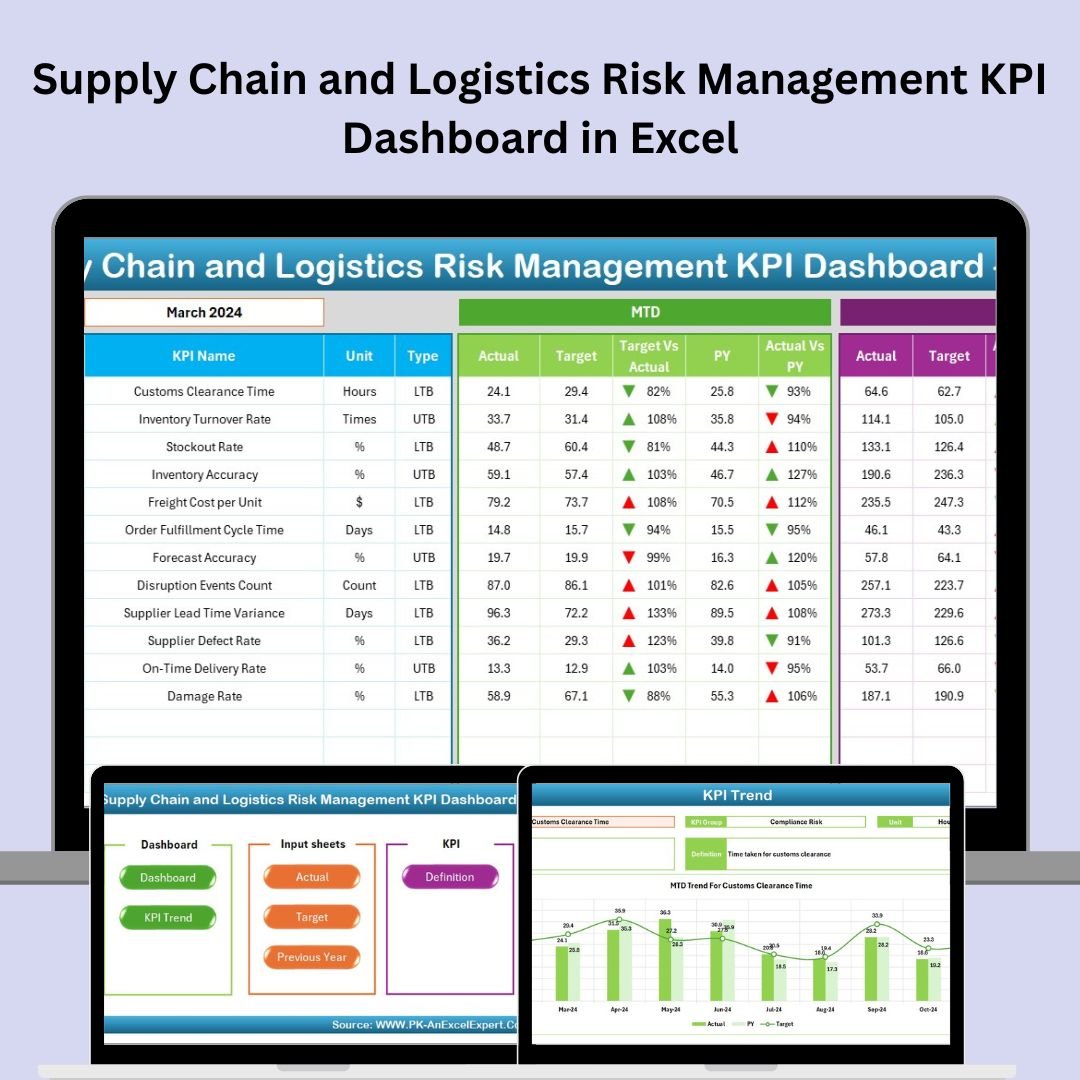
In today’s complex global supply chain landscape, risk management isn’t optional—it’s essential. Whether you’re a logistics manager, operations head, or Supply Chain and Logistics Risk Management KPI Dashboard, this Excel-based KPI Dashboard gives you instant insight into the risks that can derail performance and cost you money.
With powerful features like drop-down filters, trend charts, year-over-year comparisons, and automated dashboards, this tool helps you track what matters—without paying for expensive software.
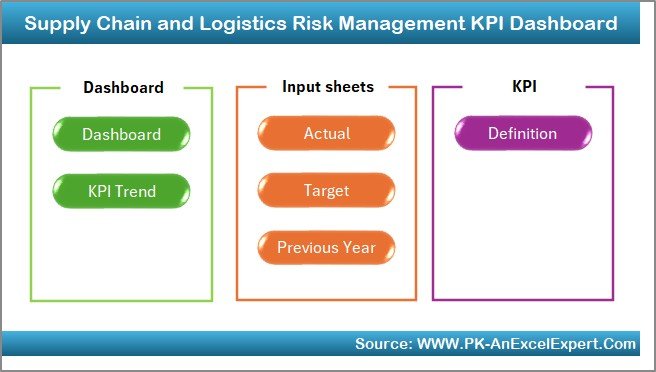
🧰 What’s Included in the Dashboard?
This professionally structured Excel tool comes with 7 powerful worksheet tabs, each with a specific role:
1️⃣ Home Sheet – Central Navigation Hub
🚀 Jump to any section with 6 one-click buttons
🎯 No scrolling or complex menus
2️⃣ Dashboard Sheet – Real-Time Risk Monitoring
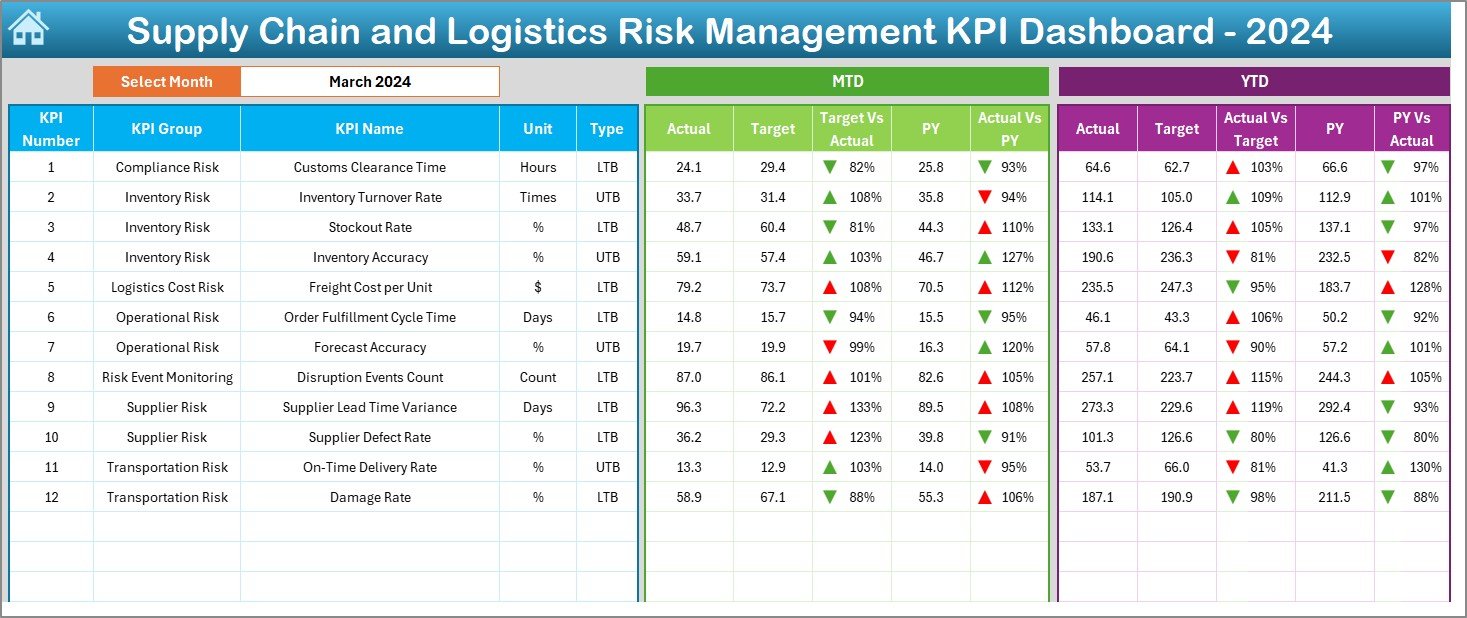
📅 Choose any month from a drop-down in cell D3
📊 View:
-
MTD Actual vs Target & Previous Year
-
YTD Actual vs Target & Previous Year
-
Color-coded Arrows for performance trend indicators
📌 Auto-updates when new data is entered
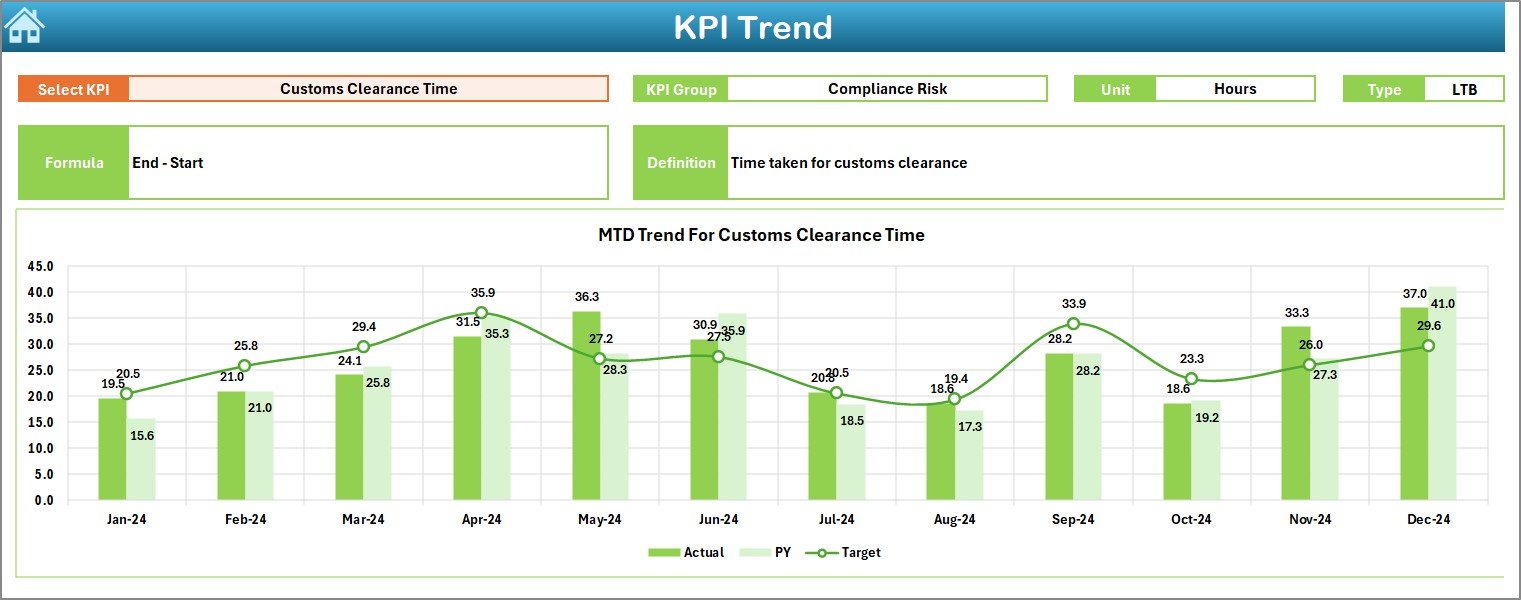
3️⃣ KPI Trend Sheet – Historical Pattern Detection
🎯 Select a KPI using a drop-down
📈 View line charts for:
-
MTD and YTD Actuals
-
Targets
-
Previous Year
📌 Includes KPI metadata: Unit, Formula, LTB/UTB, Definition
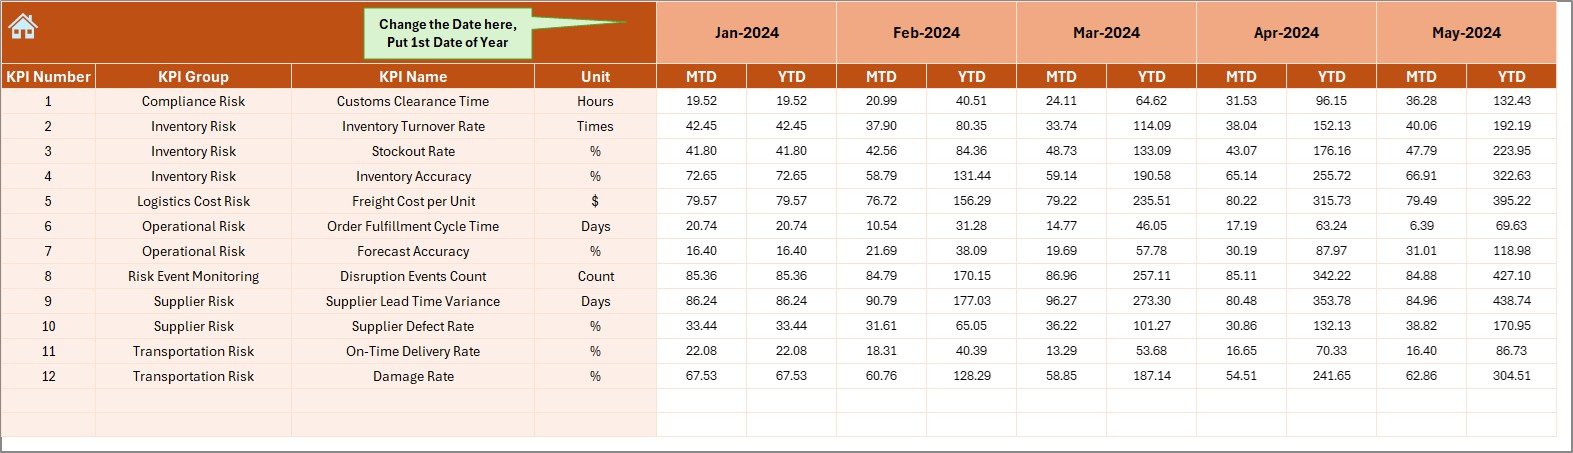
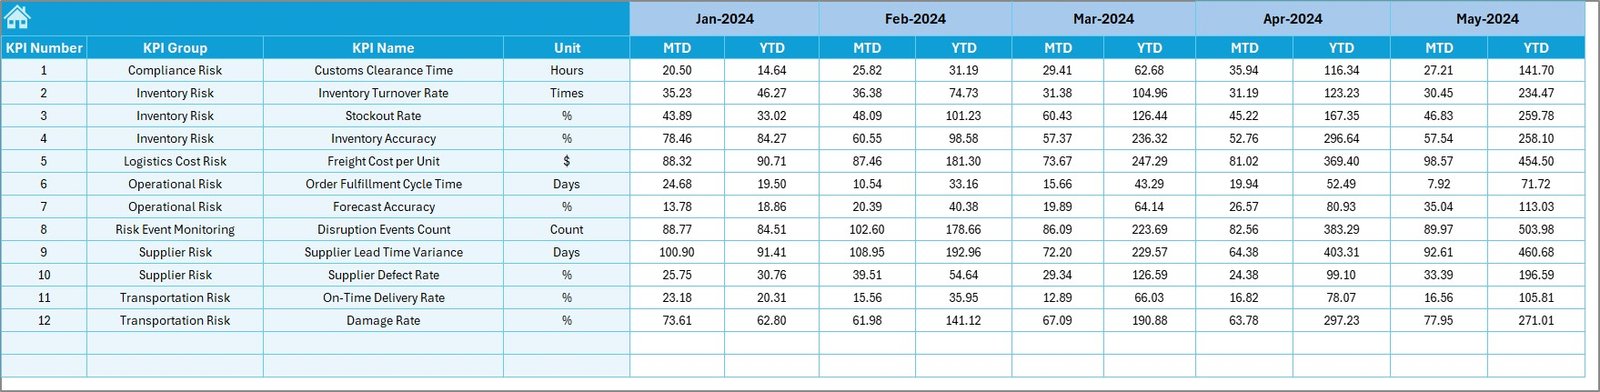
4️⃣ Actual Numbers Input Sheet – Track Real Progress
✍ Input MTD and YTD values per KPI per month
📆 Set your start month using cell E1
🔄 Data feeds directly into dashboards and trends
5️⃣ Target Sheet – Set KPI Benchmarks
🎯 Input monthly target numbers for every KPI
📌 Crucial for tracking performance gaps
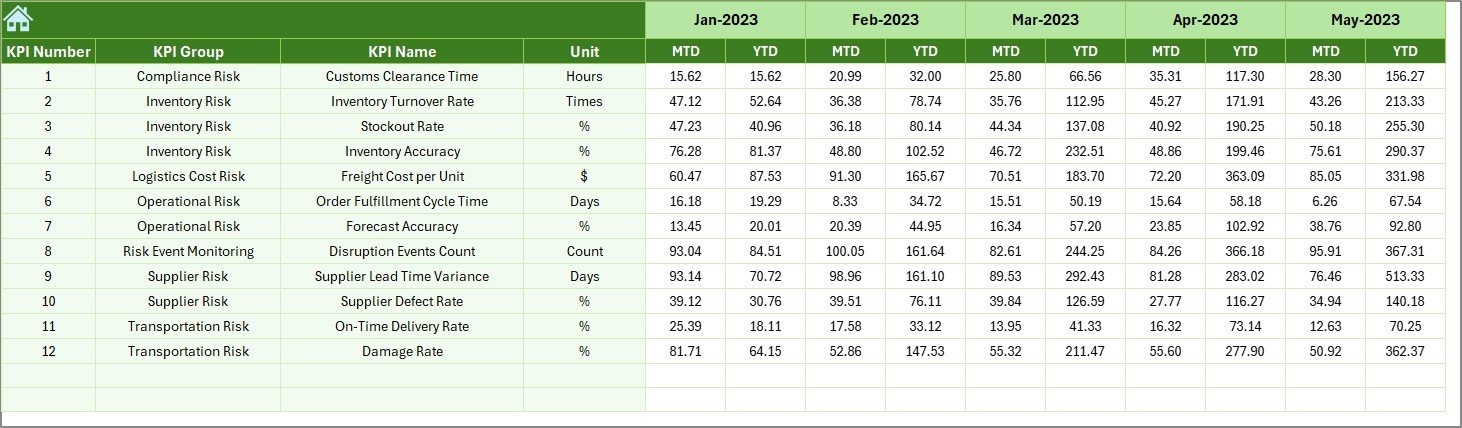
6️⃣ Previous Year Sheet – Year-over-Year Comparison
📅 Enter last year’s data for all KPIs
🔍 Enables visual benchmarking and trend spotting
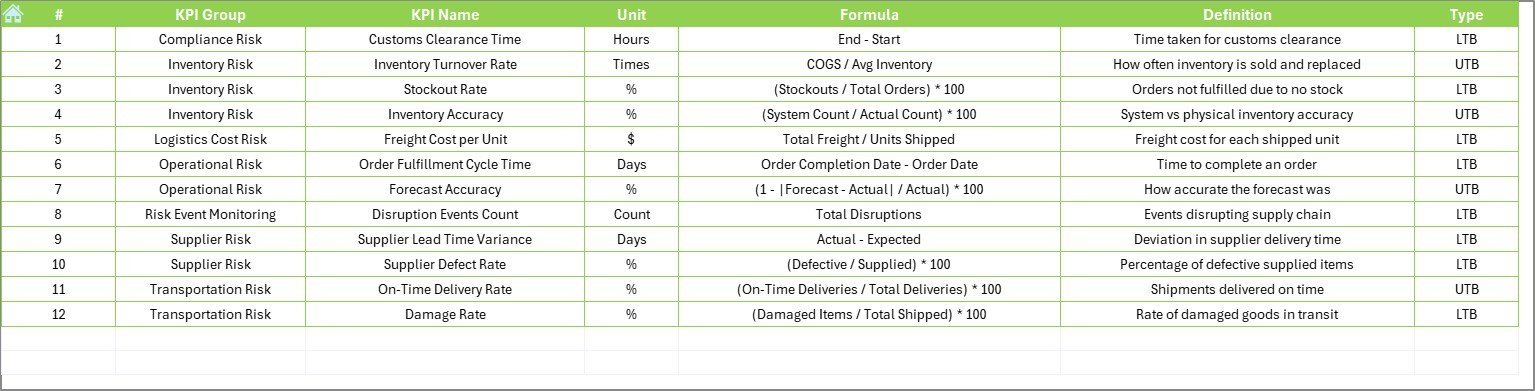
7️⃣ KPI Definition Sheet – Your KPI Dictionary
📚 Includes:
-
KPI Name
-
Group (Inventory Risk, Supplier Risk, etc.)
-
Unit
-
Formula
-
Type (Lower the Better / Upper the Better)
-
Short Definition
📌 Fully editable to match your business KPIs
💡 Why Use This Excel Dashboard?
✅ Real-Time Visibility – Monitor KPIs monthly and annually
✅ Data-Driven Decisions – Identify high-risk areas instantly
✅ Cost-Effective – No subscription or third-party tools
✅ Customizable – Tailor KPIs, charts, or definitions as needed
✅ No Learning Curve – If you know Excel, you can use this
📈 Example KPIs You Can Track:
📦 On-Time Delivery Risk (%)
📉 Inventory Stockout Rate (%)
🚛 Supplier Lead Time Variance
🔄 Logistics Disruption Count
💰 Procurement Cost Overrun Rate
📊 Freight Damage Rate
📆 Delayed Shipment %
🏆 Advantages of Using Excel for Risk Management
🔄 Real-Time Dashboard Refresh – Select a month, see the change instantly
🧠 Clarity at a Glance – Arrows, charts, and drop-down filters make reporting simple
🔧 Editable for Any Industry – Works in manufacturing, retail, healthcare, and more
📥 No Cloud Dependency – Works offline, on any Excel-enabled device
🔧 Best Practices for Supply Chain Risk Management with KPIs
🔹 Define KPIs Clearly – Use the KPI Definition Sheet to maintain clarity
🔹 Classify by Risk Type – Organize KPIs into Inventory, Supplier, Delivery, and Cost Risk
🔹 Update Monthly – Keep actuals and targets current
🔹 Use Conditional Formatting – Automatically highlight performance dips
🔹 Review Trends Quarterly – Plan strategically with YTD insights
📚 Frequently Asked Questions (FAQs)
Q1. Can I customize the KPIs in the dashboard?
Yes. You can fully edit or add KPIs in the KPI Definition Sheet.
Q2. Is this tool beginner-friendly?
Yes! With dropdowns, color-coded visuals, and simple formulas, it’s ideal for anyone with basic Excel knowledge.
Q3. Can I use this dashboard for industries outside of logistics?
Absolutely. The structure is flexible for any performance or risk monitoring system.
Q4. Is the dashboard mobile-friendly?
It opens in Excel Mobile, but full functionality works best on desktop.
Q5. How often should I update the data?
Monthly updates are ideal. YTD data ensures long-term visibility.
Visit our YouTube channel to learn step-by-step video tutorials
🔗 Click here to read the Detailed blog post
Watch the step-by-step video tutorial:


Reviews
There are no reviews yet.