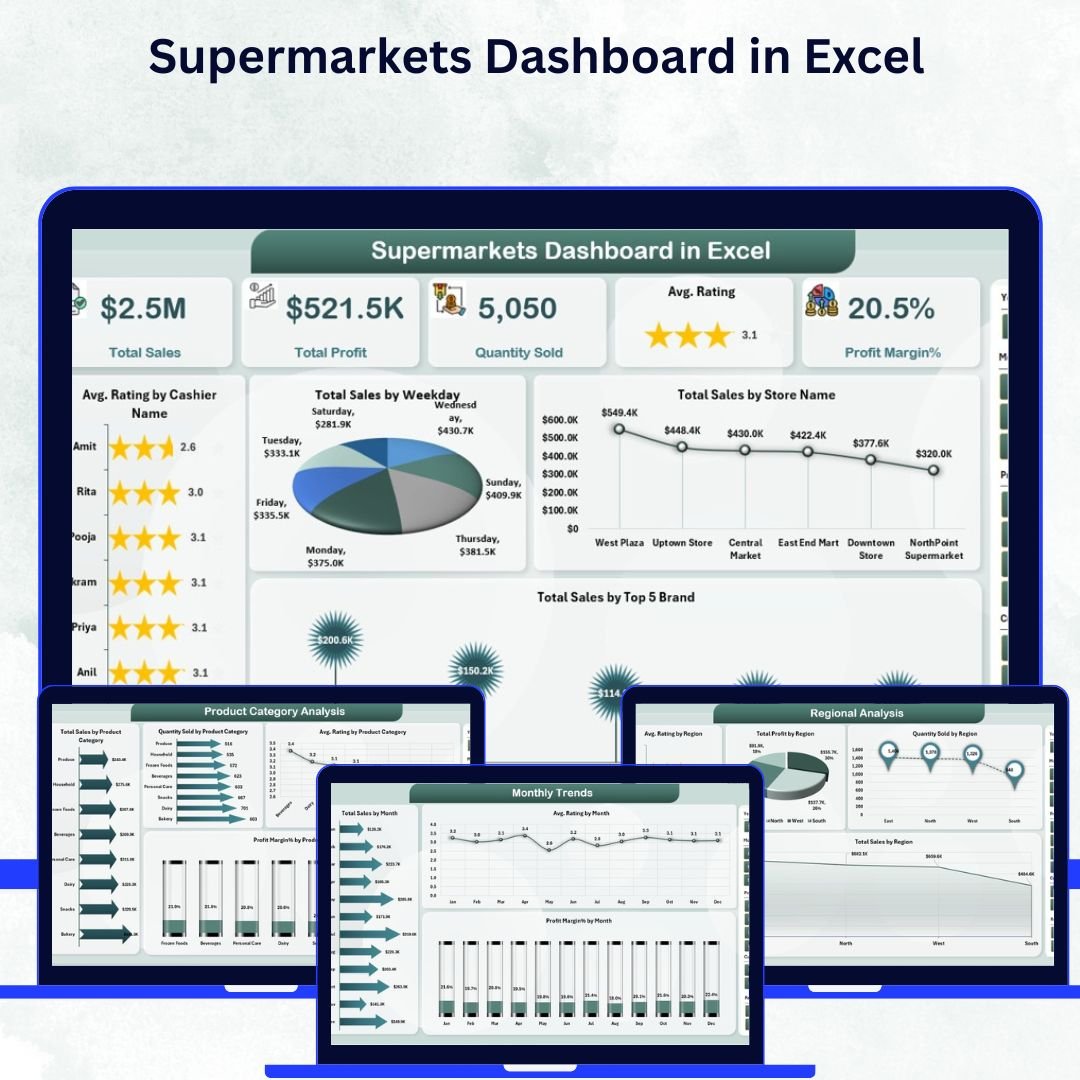
In the competitive retail industry, supermarkets handle enormous volumes of data — from daily transactions and inventory to customer satisfaction scores and regional sales. Managing this information effectively is crucial for profitability and growth. The Supermarkets Dashboard in Excel is a ready-to-use analytics tool designed to transform raw retail data into meaningful insights.
Built entirely in Microsoft Excel, this interactive dashboard helps supermarket owners, managers, and analysts track key performance indicators (KPIs) such as total sales, profit margins, product category performance, and customer feedback. It eliminates manual reporting and offers instant clarity through automated visuals and dynamic charts.
Whether you manage a single store or an entire retail chain, this dashboard delivers a 360° view of performance across stores, regions, and product categories — helping you make faster, data-driven decisions.
⚙️ Key Features of the Supermarkets Dashboard in Excel
📊 Five Analytical Pages:
Includes dedicated pages for Overview, Store Analysis, Regional Analysis, Product Category Analysis, and Monthly Trends — plus a Support Sheet for backend data.
📈 KPI Summary Cards:
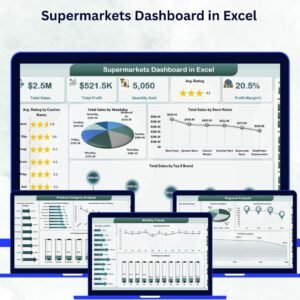
Monitor critical business metrics like total sales, profit margin, number of stores, top-performing brands, and average customer rating — all in one snapshot.
🏪 Store Performance Tracking:
Analyze total profit, quantity sold, and customer satisfaction across stores to identify high-performing outlets and areas needing improvement.
🌍 Regional Insights:
Compare sales, profit, and customer ratings by region to detect market trends and growth opportunities.
📦 Product Category Analysis:
Assess which product categories drive the most revenue and profit — helping you make informed inventory and marketing decisions.
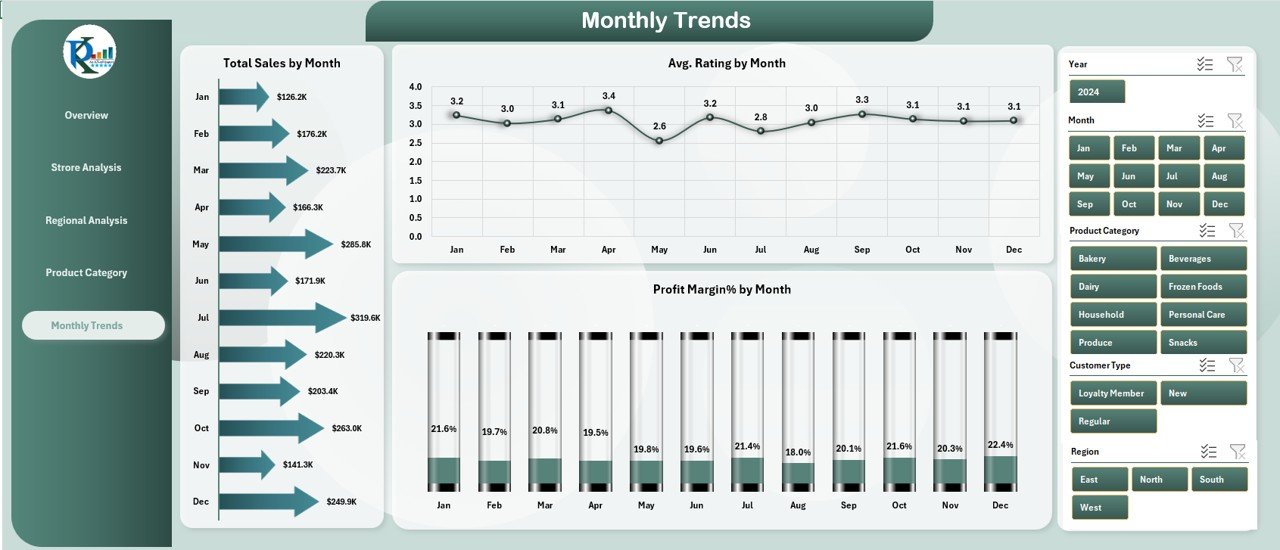
📅 Monthly Trend Visualization:
Track seasonal changes and performance fluctuations through clear trend charts for total sales, profit margin, and average rating.
🔄 Automated Data Refresh:
Simply update the Support Sheet with new data and refresh — the entire dashboard updates instantly without manual recalculations.
🎨 Interactive Visuals:
Engage with intuitive slicers, pivot charts, and clean layouts that make the data easy to explore for any skill level.
💰 Cost-Effective and Scalable:
No need for expensive BI software — Excel’s flexibility makes this dashboard affordable, powerful, and easy to maintain.
🗂️ Dashboard Structure
1️⃣ Overview Page:
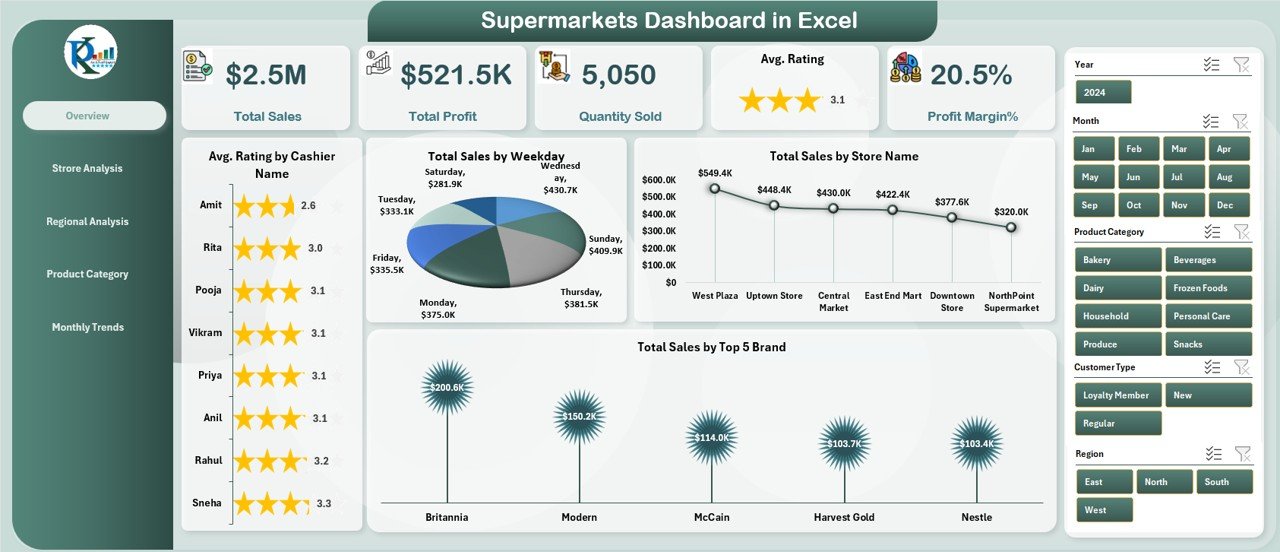
The central hub with KPI cards and four charts — Total Sales by Weekday, Store, and Brand, plus Average Rating by Cashier.
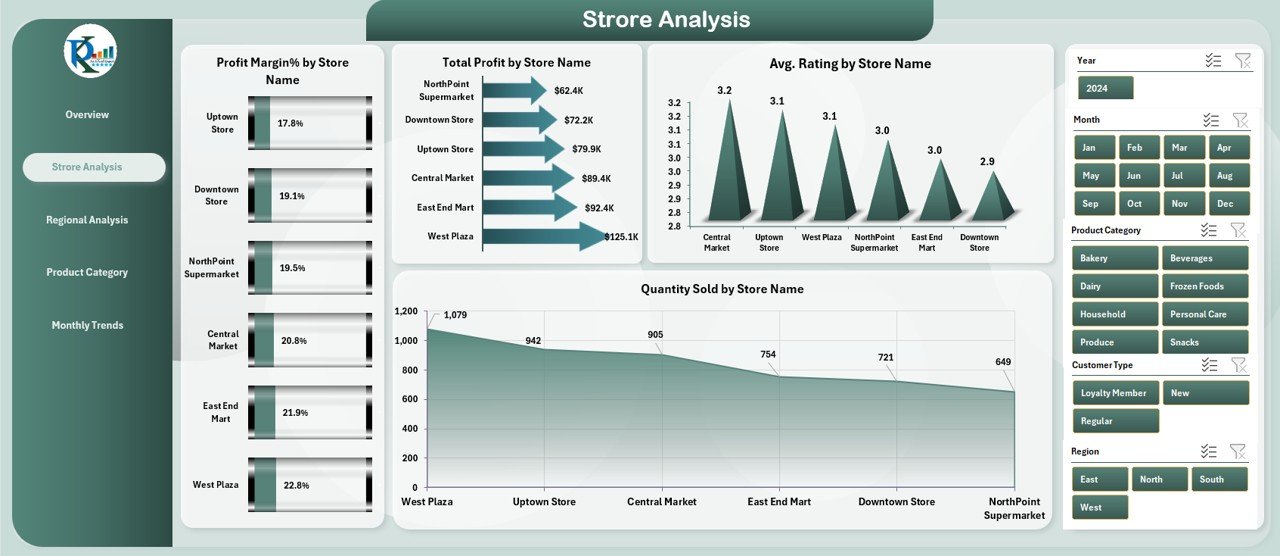
2️⃣ Store Analysis Page:
Drill down into store-level performance through visuals showing Profit Margin, Total Profit, Average Rating, and Quantity Sold.
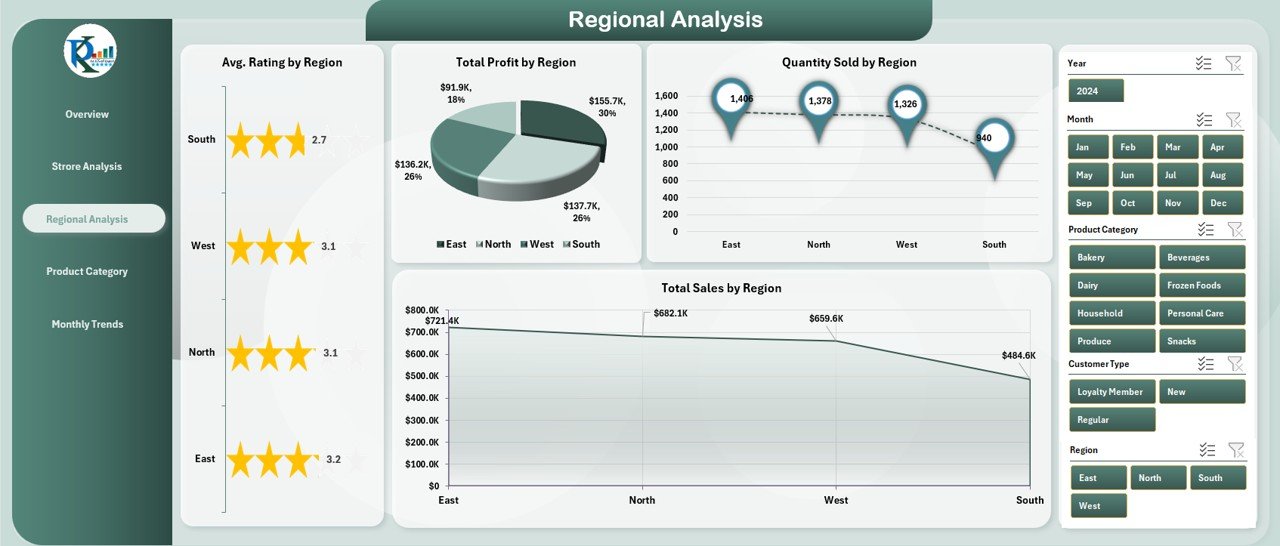
3️⃣ Regional Analysis Page:
Understand performance differences across regions with charts for Sales, Profit, Quantity Sold, and Ratings.
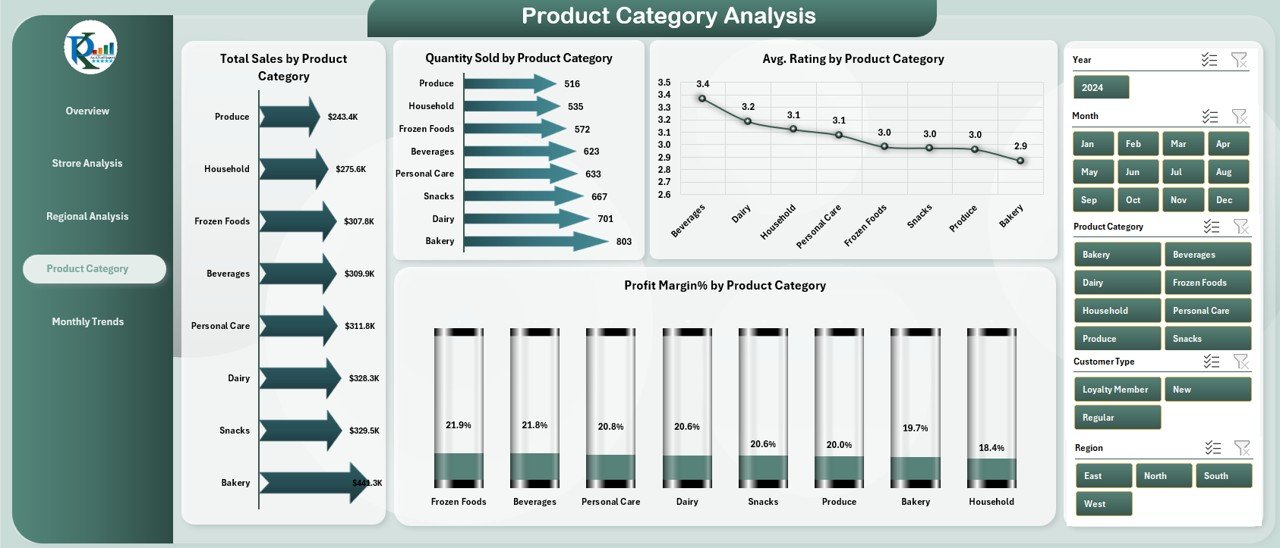
4️⃣ Product Category Analysis Page:
Explore how each product group contributes to total sales and profitability using four performance visuals.
5️⃣ Monthly Trends Page:
Identify long-term sales and profit patterns and make strategic adjustments for peak and off-peak seasons.
6️⃣ Support Sheet:
Holds all the master data — including stores, regions, products, brands, and ratings — which automatically feeds the dashboard visuals.
🧭 How to Use the Supermarkets Dashboard in Excel
✅ Step 1: Enter your store, product, and sales data into the Support Sheet.
✅ Step 2: Click “Refresh All” in Excel to update pivot tables and visuals.
✅ Step 3: Use the page navigator to switch between Overview, Store, Region, and Category pages.
✅ Step 4: Apply slicers to focus on specific time frames, stores, or product categories.
✅ Step 5: Review KPI cards and charts regularly to make informed business decisions.
With this simple workflow, you can manage your supermarket performance in minutes — not hours.
👥 Who Can Benefit from This Dashboard
🧾 Supermarket Owners: Gain instant insights into profits, sales, and customer feedback.
📊 Regional Managers: Compare store performance across multiple cities or regions.
📦 Inventory & Operations Teams: Optimize stock levels and manage supply chain efficiency.
💰 Finance Controllers: Track profit margins and identify cost-saving opportunities.
📈 Marketing Teams: Measure the success of promotions and campaigns in real time.
🌍 Why Choose This Excel Dashboard
✅ No Coding Required: 100% formula-driven and easy to use.
✅ Real-Time Updates: Refresh data instantly for the latest insights.
✅ Customizable Design: Add your store logo or modify color themes.
✅ Scalable Structure: Works for single stores or nationwide supermarket chains.
✅ Professional Layout: Built for clarity, speed, and executive-level reporting.
🔗 Click here to read the Detailed blog post
🎥 Visit our YouTube channel for step-by-step tutorials
🔗 YouTube.com/@PKAnExcelExpert


Reviews
There are no reviews yet.