Subscription-based retail businesses grow quickly because they offer predictable revenue, long-term customer value, and continuous engagement. But when retail teams depend on scattered spreadsheets, raw data tables, and manual reports, they lose visibility into what truly drives performance. Decision-making becomes slow, churn increases unnoticed, and customer insights remain hidden.
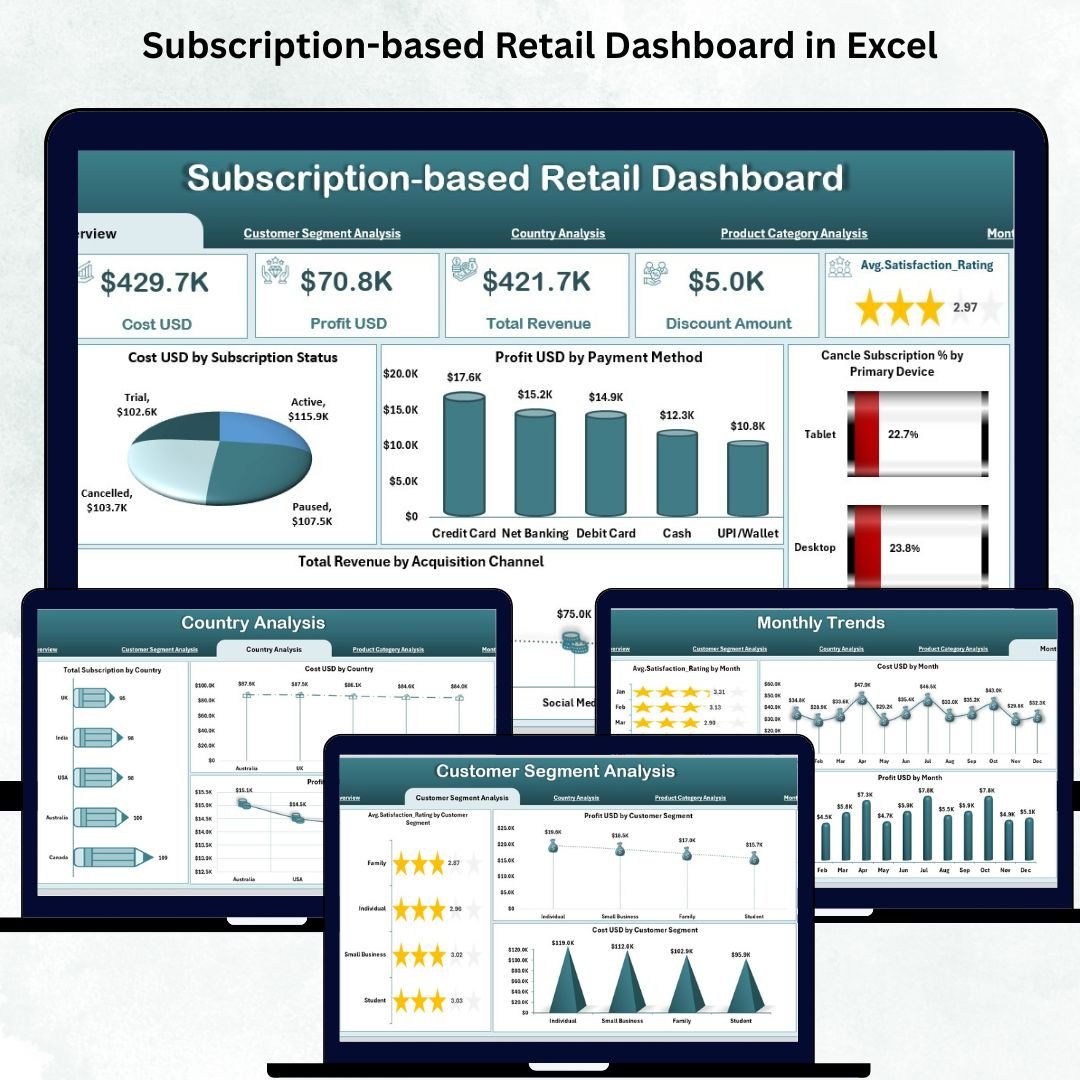
The Subscription-based Retail Dashboard in Excel solves all these challenges instantly. It converts structured subscription data into clear visuals and interactive analytics. With dashboards for customer segments, countries, product categories, and monthly trends, retail teams understand performance in just a few clicks—without technical knowledge.
Whether you manage SaaS subscriptions, e-commerce memberships, digital product plans, or physical subscription boxes, this dashboard gives you complete clarity on revenue trends, customer behavior, profit margins, satisfaction ratings, and churn patterns.
✨ Key Features of the Subscription-based Retail Dashboard in Excel
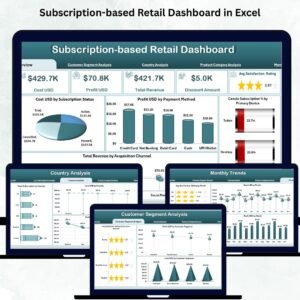
📊 1. Overview Page – Full Business Snapshot
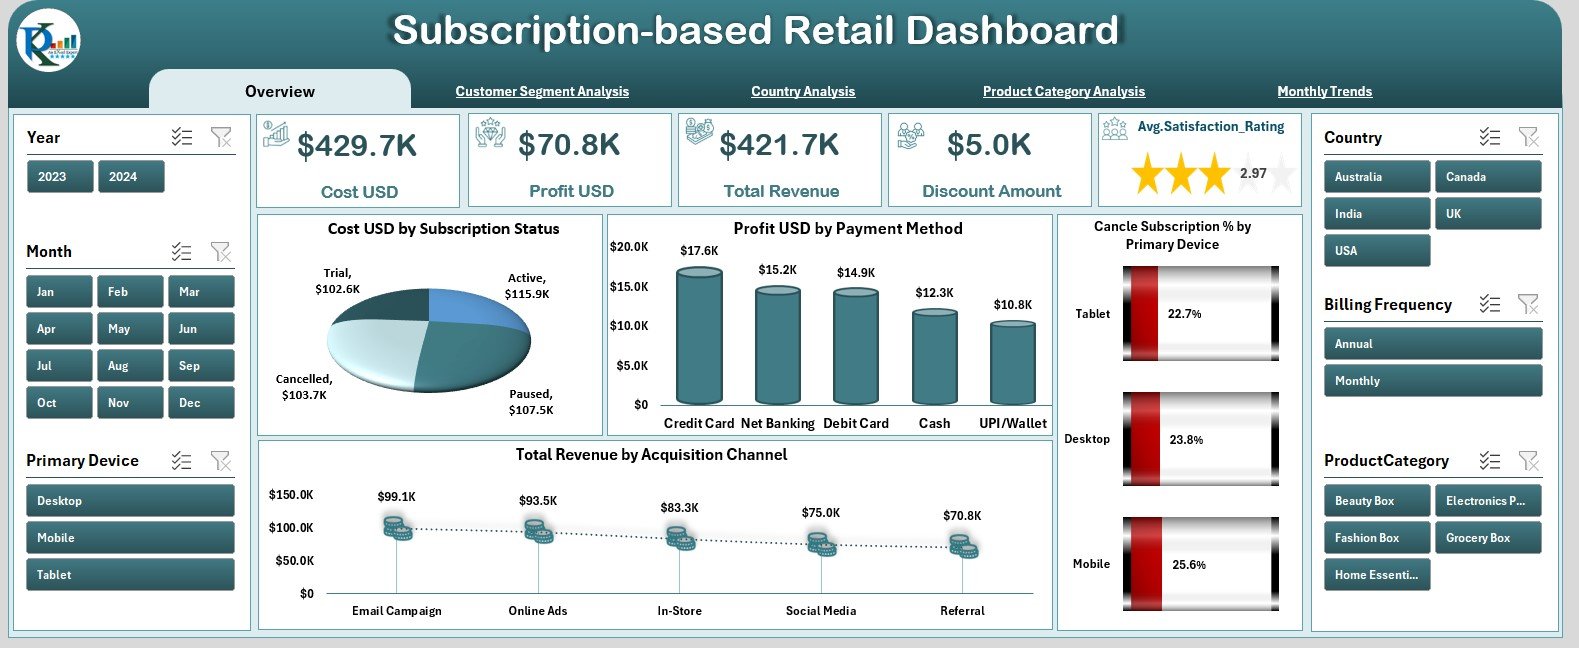
This is the main page where you view the entire subscription business at a glance.
It includes slicers on the side for quick filtering and five powerful KPI cards showing:
✔ Total Subscriptions
✔ Total Revenue
✔ Total Cost
✔ Monthly Profit
✔ Cancellation Rate
Below the summary KPIs, you get four essential charts:
📌 Cost (USD) by Subscription Status – Compare cost patterns across active, canceled, paused, or new plans.
📌 Profit (USD) by Payment Method – Evaluate which payment options drive the highest profit.
📌 Cancel Subscription % by Primary Device – Identify whether churn is higher on mobile, tablet, desktop, or app.
📌 Total Revenue by Acquisition Channel – Discover your most profitable marketing channels such as email, social media, affiliates, or paid ads.
This page gives leaders a complete performance picture in seconds.
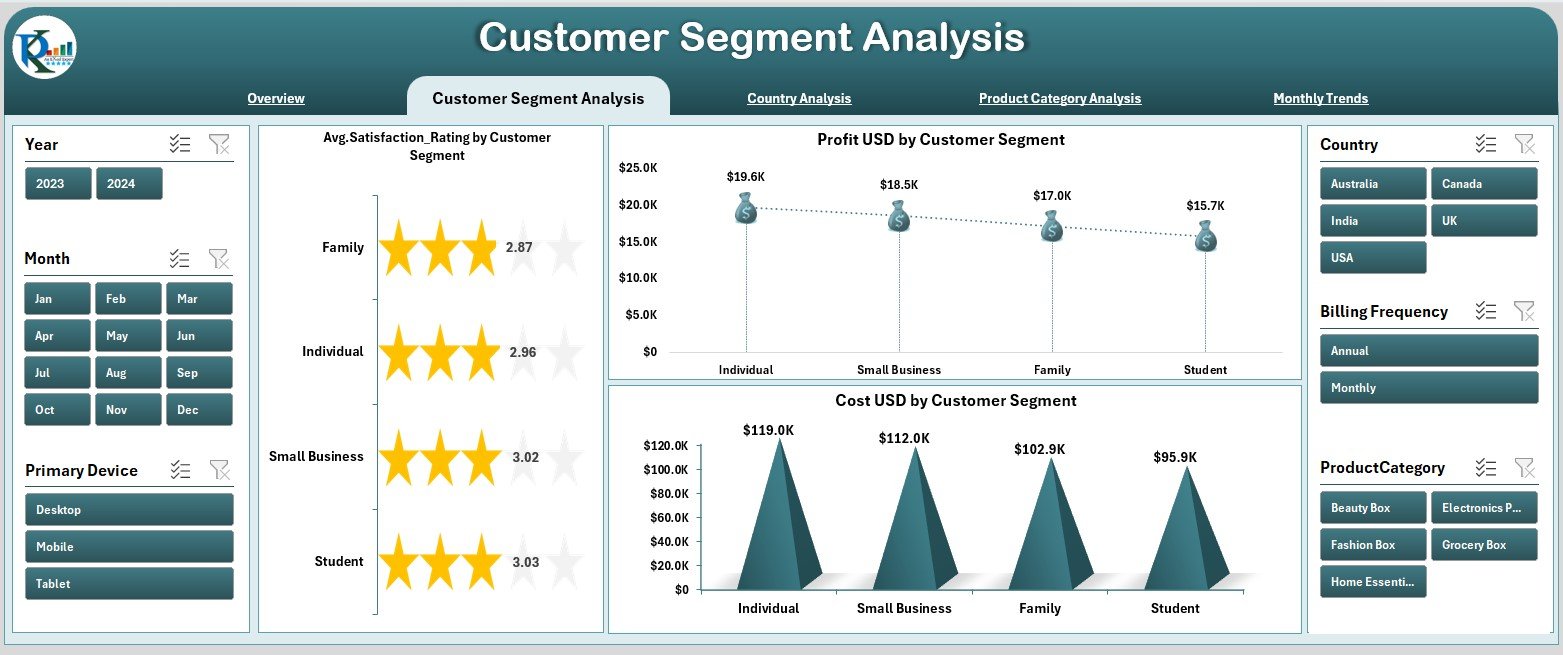
🧑🤝🧑 2. Customer Segment Analysis – Understand User Behavior
Different customer groups behave differently—and this page reveals it clearly.
You get three powerful charts:
✨ Average Satisfaction Rating by Customer Segment
✨ Profit (USD) by Customer Segment
✨ Cost (USD) by Customer Segment
Segments may include:
-
Students
-
Professionals
-
Enterprises
-
Seniors
-
Families
-
Free-to-paid converters
This page helps refine pricing strategies, loyalty programs, and retention campaigns.
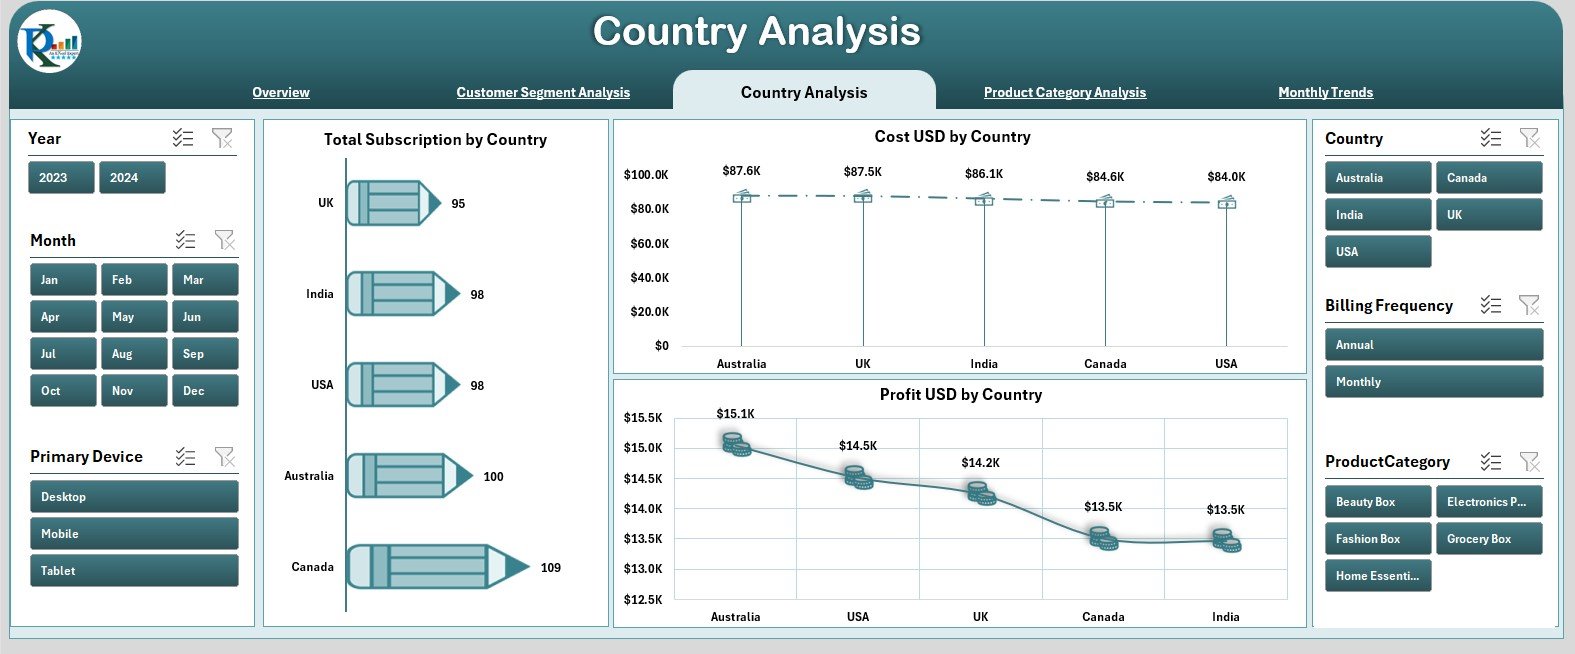
🌍 3. Country Analysis – Evaluate Regional Performance
Subscription retailers that operate globally need clarity across markets.
You get three essential charts:
📌 Total Subscriptions by Country
📌 Cost (USD) by Country
📌 Profit (USD) by Country
This helps teams identify where the customer base is growing fastest, where operational costs are rising, and which countries are most profitable—critical insights for expansion planning.
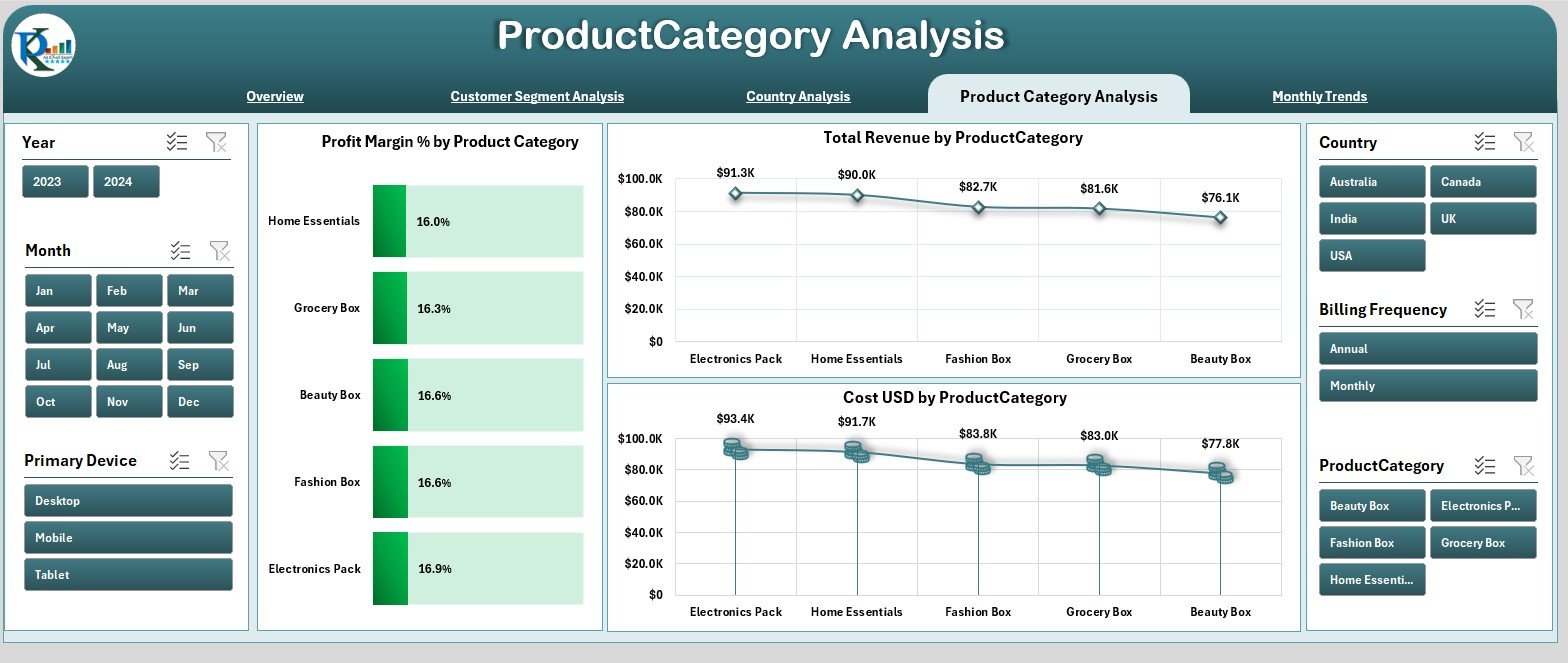
📦 4. Product Category Analysis – Identify Winning Products
Subscription retailers often offer multiple products or subscription types.
This page breaks down performance by product category with these charts:
✔ Profit Margin % by Product Category
✔ Total Revenue by Product Category
✔ Cost (USD) by Product Category
Categories may include:
-
Software subscriptions
-
Courses and training
-
Streaming content
-
Membership programs
-
Digital files
-
Subscription boxes
This helps refine product strategies, remove low-performing items, and increase category-level profitability.
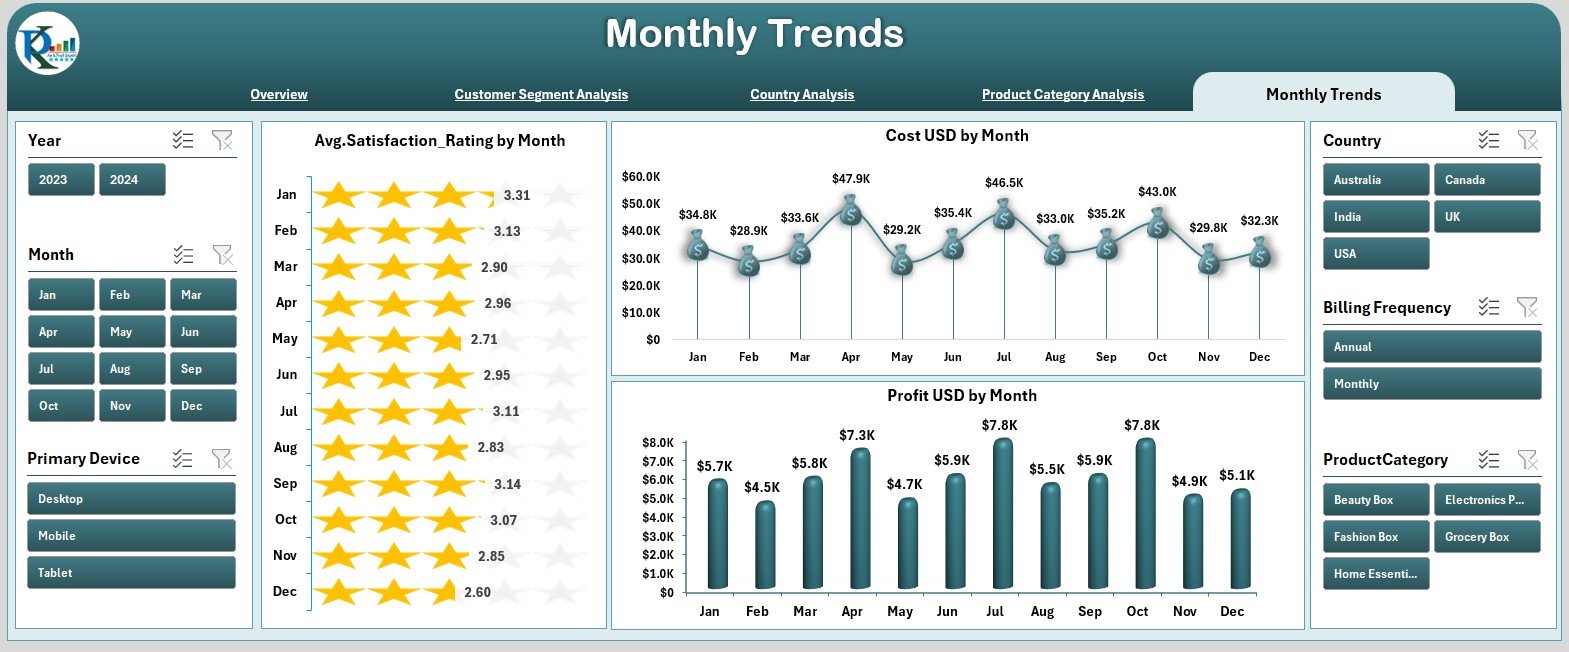
📅 5. Monthly Trends – Track Trends Over Time
Monthly patterns reveal a lot about customer sentiment, marketing performance, and subscription behavior.
You get three monthly trend visuals:
📌 Average Satisfaction Rating by Month
📌 Cost (USD) by Month
📌 Profit (USD) by Month
This page helps identify peak months, churn spikes, seasonal subscription patterns, and months where marketing costs increase.
📦 What’s Inside the Subscription-based Retail Dashboard
When you download this Excel dashboard, you receive:
⭐ Fully designed, ready-to-use Excel dashboard
⭐ Overview Page
⭐ Customer Segment Analysis Page
⭐ Country Analysis Page
⭐ Product Category Analysis Page
⭐ Monthly Trends Page
⭐ Support Sheet & Data Sheet
⭐ Slicers for quick filtering
⭐ KPI cards, charts, and dynamic visuals
⭐ Clean, structured dataset mapping
Just update the data sheets and all visuals refresh automatically.
🛠️ How to Use the Subscription-based Retail Dashboard
1️⃣ Update subscription, customer, and revenue data in the support sheets
2️⃣ Refresh the dashboard to update all visuals instantly
3️⃣ Use slicers to filter data by country, segment, category, and month
4️⃣ Analyze KPIs for quick performance understanding
5️⃣ Compare customer groups, countries, and product categories
6️⃣ Track cancellation behavior and monthly fluctuations
7️⃣ Make informed decisions based on real-time insights
Anyone with basic Excel skills can use this dashboard—no technical training required.
👥 Who Can Benefit from This Subscription Dashboard?
This dashboard is perfect for:
🛒 Subscription-based retailers
💻 SaaS businesses
📚 Course creators
📦 Subscription box companies
🎮 Digital product sellers
📱 App-based subscription platforms
🛍️ E-commerce membership brands
If your business collects recurring revenue, this dashboard becomes your main performance engine.


Reviews
There are no reviews yet.