


In today’s competitive and fast-changing business environment, organizations must plan strategically to thrive. The Strategic Planning Report in Excel is a ready-to-use, data-driven tool that helps transform goals into measurable insights and actionable strategies.
Designed for executives, department heads, and business analysts, this interactive Excel report consolidates performance, budget utilization, and completion metrics — enabling leaders to track strategic execution efficiently. Instead of relying on static slides or manual updates, you get a live dashboard that updates instantly when new data is entered.
⚙️ Key Features of the Strategic Planning Report in Excel
📊 Three Analytical Pages + Support Sheet:
Includes a Summary Page, Report Page, Data Sheet, and a Support Sheet for reference lists and automation — offering both a macro and micro perspective on strategic progress.
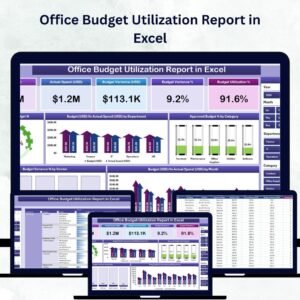
🎯 Summary Page – The Executive Dashboard:

A high-level visual summary with:
-
5 KPI Cards: Total Goals, Completed %, Budget Utilized, High Ratings %, Ongoing Projects
-
Slicer Panel: Filter data by Department, Goal Category, or Timeline
-
5 Charts:
-
Completed % by Goal Category
-
Budget (USD) vs. Spend (USD) by Department
-
High Rating % by Owner
-
Budget (USD) vs. Spend (USD) by Month
-
Overall Completion Trend
-
This page provides management with instant clarity on organizational performance.
📈 Report Page – In-Depth Analysis:
Dive deeper into project or departmental performance using interactive slicers. The detailed table includes:
-
Goal Name
-
Department
-
Owner
-
Status
-
Completion %
-
Rating
-
Budget
-
Spend
Conditional formatting highlights key variances — making it easier to identify underperforming areas or overspending departments.
📂 Data Sheet – The Engine Room:
Stores all essential data — goals, budgets, completion %, and ratings — in a structured, pivot-ready format. Any new data you add here automatically updates all charts and KPI cards.
🧩 Support Sheet – Automation and Consistency:
Contains lookup lists (Departments, Owners, Goal Categories), KPI thresholds, and color codes for consistent visuals and dropdown selections.
📊 What’s Inside the Strategic Planning Report in Excel
1️⃣ Summary Page: High-level dashboard for management overviews.
2️⃣ Report Page: Detailed goal and department-level performance view.
3️⃣ Data Sheet: The primary dataset powering all visuals.
4️⃣ Support Sheet: Reference values and calculation support.
This clear, modular structure ensures easy maintenance and scalability — perfect for both small teams and enterprise-level reporting.
🧭 How to Use the Strategic Planning Report in Excel
✅ Step 1: Enter all strategic goals, budgets, and performance data in the Data Sheet.
✅ Step 2: Review automatic calculations for Budget Utilization, Completion %, and Ratings.
✅ Step 3: Use slicers on the Summary Page to filter by Department or Goal Category.
✅ Step 4: Analyze budget vs. spend charts and performance ratings.
✅ Step 5: Visit the Report Page to explore detailed goal progress.
✅ Step 6: Export visuals to PowerPoint or PDF for management presentations.
Within minutes, your Excel workbook becomes a comprehensive strategic monitoring tool ready for review meetings and performance discussions.
👥 Who Can Benefit from This Dashboard
🏢 Corporate Strategy Teams: Align strategic goals with measurable outcomes.
💼 Finance Teams: Monitor department budgets vs. actual spending.
🧍♂️ Department Heads: Track progress and accountability in real time.
📈 Project Management Offices: Evaluate completion trends and efficiency.
🎯 Operations & HR Leaders: Measure employee goals and performance scores.
📊 Business Analysts: Generate insights to improve strategic alignment.
🌟 Advantages of the Strategic Planning Report in Excel
✅ Real-Time Insights: Instantly view completion rates, budgets, and ratings.
✅ Centralized Data Source: Consolidate all performance metrics in one file.
✅ Better Decision-Making: Identify issues and act on data-backed insights.
✅ Improved Accountability: Assign ownership to departments or individuals.
✅ Customizable Design: Modify slicers, KPIs, and visuals as per your needs.
✅ Collaboration-Ready: Ideal for teams using OneDrive or SharePoint.
✅ Professional Reporting: Export ready-made visuals for board presentations.
✅ Cost-Effective: No need for additional BI software — Excel does it all.
🔗 Click here to read the Detailed Blog Post
🎥 Visit our YouTube channel for step-by-step tutorials
🔗 YouTube.com/@PKAnExcelExpert


Reviews
There are no reviews yet.