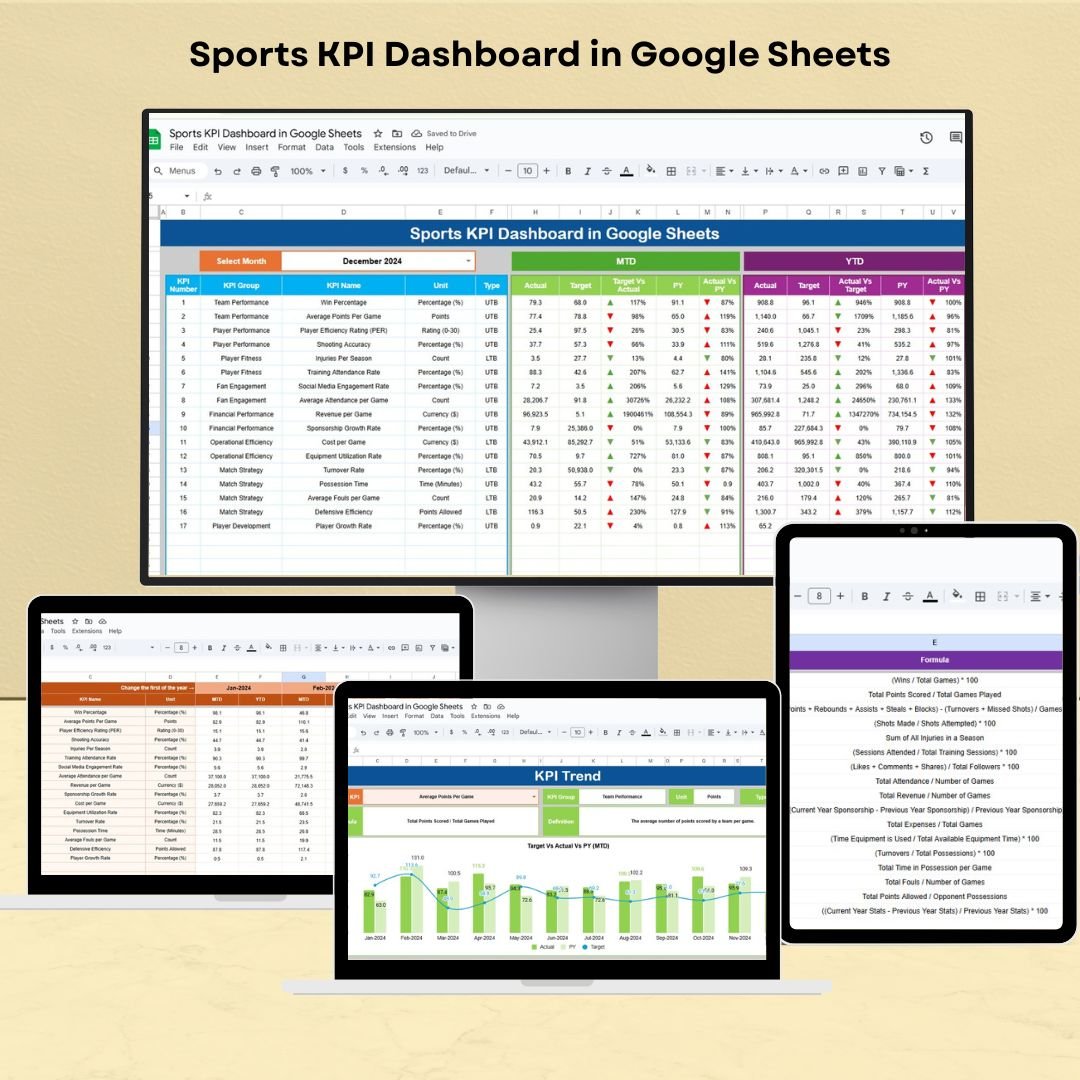
The Sports KPI Dashboard in Google Sheets is a powerful tool designed to help sports teams, coaches, and analysts track, analyze, and optimize key performance indicators (KPIs). This dashboard brings together essential metrics into a single, user-friendly interface, enabling teams to monitor performance, identify trends, and make data-driven decisions that enhance athletic performance.
By using this Google Sheets-based dashboard, sports organizations can streamline their data tracking and gain insights that help improve team performance and strategic decisions.

Key Features of the Sports KPI Dashboard in Google Sheets
📊 Comprehensive KPI Tracking
-
Monitor Key Metrics: Track essential sports KPIs such as player performance, team statistics, game results, training efficiency, and more.
-
Real-Time Updates: Ensure that the dashboard reflects the most current data with live updates as performance metrics change.
📈 Customizable Metrics
-
Tailored to Your Needs: Easily adjust the dashboard to track specific KPIs that align with your team’s objectives.
-
Flexibility: Add or remove metrics depending on the type of sport and the specific areas you want to measure.
🔧 User-Friendly Interface
-
Easy Setup: The dashboard is designed to be intuitive, making it accessible for all users, including those with little to no experience with Google Sheets.
-
Visual Data: Use charts, graphs, and color-coded indicators to quickly visualize performance trends and areas for improvement.
📅 Performance Monitoring & Reporting
-
Track MTD & YTD: Monitor Month-to-Date (MTD) and Year-to-Date (YTD) performance to evaluate team progress and improvements over time.
-
Target vs. Actual Comparison: Set performance targets and compare them against actual outcomes to measure success and identify gaps.
Benefits of Using the Sports KPI Dashboard in Google Sheets
✅ Informed Decision-Making
Access real-time data that enables coaches and managers to make quick, informed decisions about player performance and team strategy.
✅ Enhanced Team Efficiency
By identifying areas where performance can be improved, teams can work smarter and enhance overall efficiency both in training and during matches.
✅ Accountability Across the Team
The transparent tracking of KPIs promotes accountability among players and coaching staff, ensuring everyone is aligned with team goals.
✅ Streamlined Reporting
Simplify reporting and share insights with stakeholders, making it easier to evaluate the success of games, training sessions, or overall team performance.
Getting Started with Your Sports KPI Dashboard in Google Sheets
-
Download the Template: Get started by downloading the Sports KPI Dashboard template to customize it for your sports team’s needs.
-
Set Up Your KPIs: Define the most relevant KPIs for your team, such as player statistics, game results, and training progress.
-
Input Data: Regularly input performance data to keep the dashboard updated with the latest statistics.
-
Monitor & Analyze: Use the dashboard to track performance trends and make data-driven adjustments to your strategies.
-
Share Insights: Share the dashboard with your team and other stakeholders to keep everyone on the same page regarding performance metrics.
By using the Sports KPI Dashboard in Google Sheets, teams can optimize their performance, improve strategy, and ensure they are on the right track toward achieving their goals.
Click here to read the Detailed blog post
Sports KPI Dashboard in Google Sheets
Visit our YouTube channel to learn step-by-step video tutorials
YouTube.com/@NeotechNavigators
















Reviews
There are no reviews yet.