


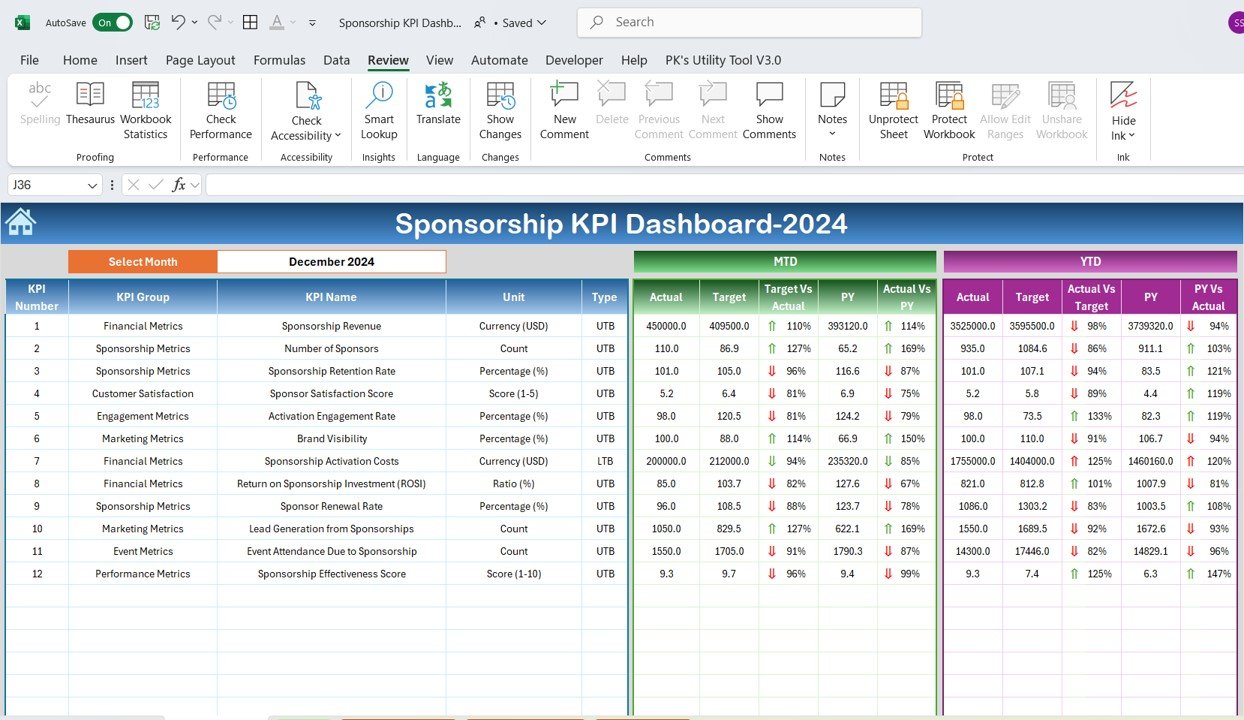
The Sponsorship KPI Dashboard in Excel is a comprehensive tool designed for businesses, event organizers, and marketers to track, analyze, and optimize the performance of their sponsorship deals. Whether you’re managing a single sponsorship campaign or overseeing multiple partnerships, this Excel dashboard allows you to monitor key performance indicators (KPIs) such as sponsorship revenue, audience reach, brand visibility, and return on investment (ROI), all in one place.
With real-time data updates, customizable reporting, and interactive visual analytics, this tool provides valuable insights into how well your sponsorship campaigns are performing. By tracking these essential metrics, you can make data-driven decisions, enhance your sponsorship strategies, and maximize the benefits of your partnerships.
Key Features of the Sponsorship KPI Dashboard in Excel:
💰 Sponsorship Revenue Tracking
Track the revenue generated from each sponsorship deal and assess how each sponsorship contributes to your overall financial goals.
📊 Brand Visibility and Exposure Metrics
Measure brand visibility by tracking audience reach, impressions, and media coverage to gauge the impact of your sponsorship on brand recognition.
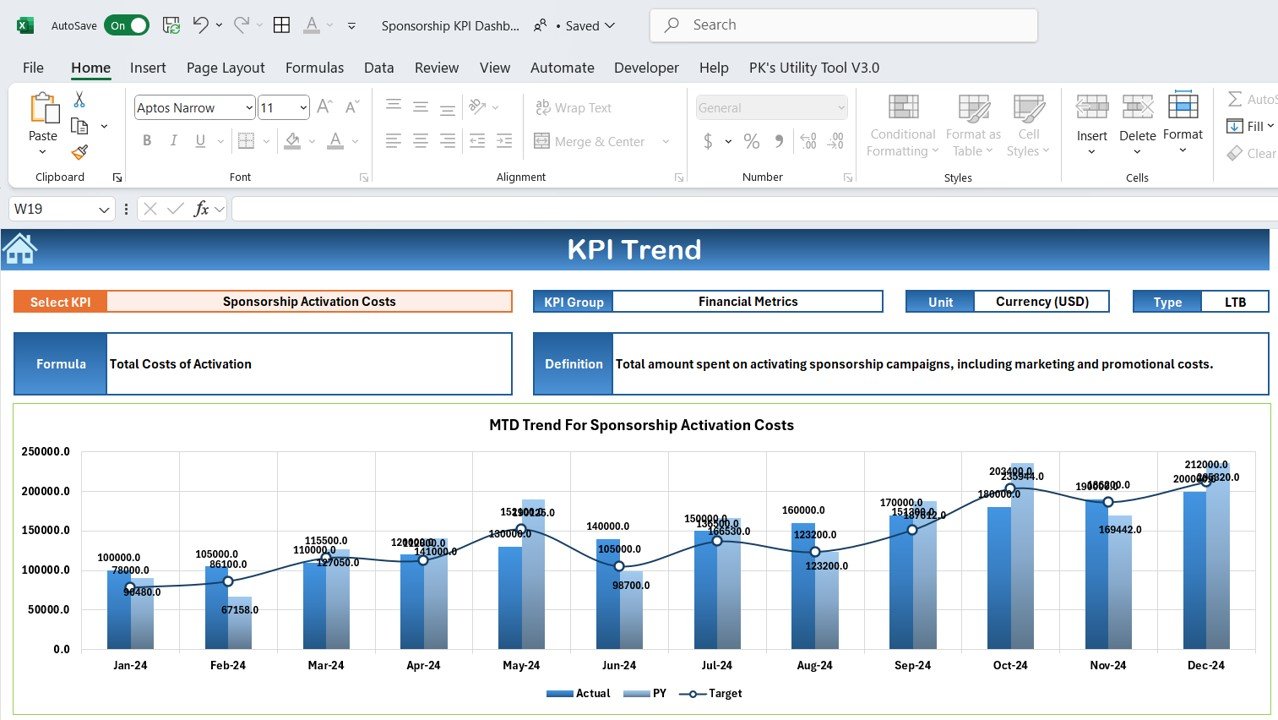
🎯 ROI and Performance Analysis
Evaluate the effectiveness of each sponsorship campaign by calculating ROI, comparing the financial investment to the returns generated.
📅 Sponsorship Deliverables and Activation Tracking
Monitor sponsorship deliverables, such as logo placements, media coverage, event participation, and other agreed-upon activities to ensure that all terms of the agreement are met.
📈 Customizable and Interactive Reporting
Generate customized reports with visual charts, graphs, and tables that present sponsorship performance data, ideal for internal teams, sponsors, and stakeholders.
🚀 Why You’ll Love the Sponsorship KPI Dashboard in Excel:
✅ Track Sponsorship Performance – Monitor key KPIs such as revenue, brand exposure, and ROI to ensure your sponsorships are delivering value.
✅ Maximize ROI – Analyze the return on investment for each sponsorship deal and make informed decisions on future partnerships.
✅ Enhance Brand Exposure – Evaluate how well your sponsorship campaigns are increasing brand visibility across various channels.
✅ Ensure Contract Compliance – Track sponsorship deliverables to ensure all agreed-upon terms are fulfilled and measure the effectiveness of the partnership.
✅ Simplify Reporting – Generate easy-to-read, professional reports that provide stakeholders with actionable insights into your sponsorship campaigns.
✅ Customizable for Your Needs – Tailor the dashboard to suit your specific sponsorship agreements, whether you’re managing event sponsorships, sports sponsorships, or media partnerships.
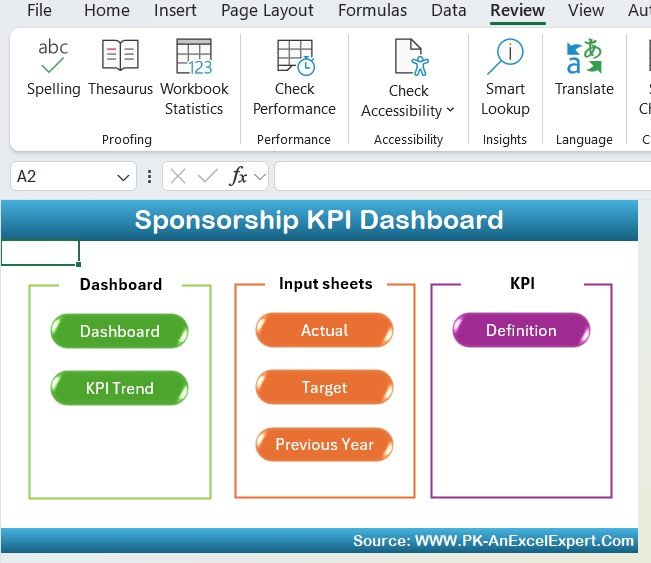
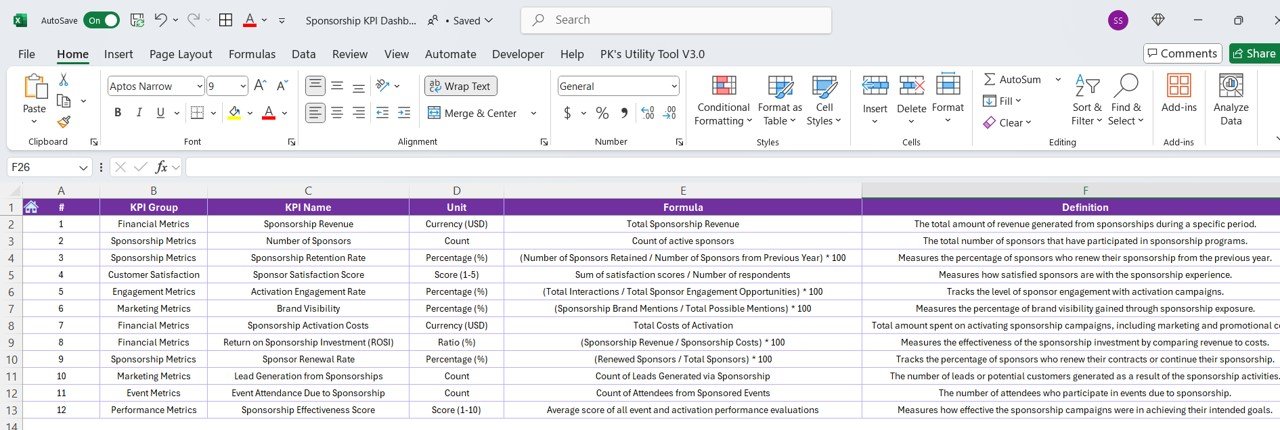
What’s Inside the Sponsorship KPI Dashboard in Excel:
- Revenue Tracker: Track the income generated from each sponsorship deal and measure financial success.
- Brand Exposure Metrics: Measure key exposure metrics such as audience reach, impressions, and media coverage.
- ROI Analysis: Evaluate the ROI of each sponsorship and analyze how well the sponsorship investment aligns with the returns.
- Sponsorship Deliverables Tracker: Track the fulfillment of all sponsorship deliverables to ensure that every aspect of the agreement is completed.
- Interactive Reports and Charts: Visualize your sponsorship performance with charts and graphs, making it easier to understand and present data.
- Customizable Data Fields: Modify the dashboard to suit your specific needs and track the KPIs that matter most for your sponsorship campaigns.
How to Use the Sponsorship KPI Dashboard in Excel:
1️⃣ Download the Template – Instantly access your Excel file upon purchase.
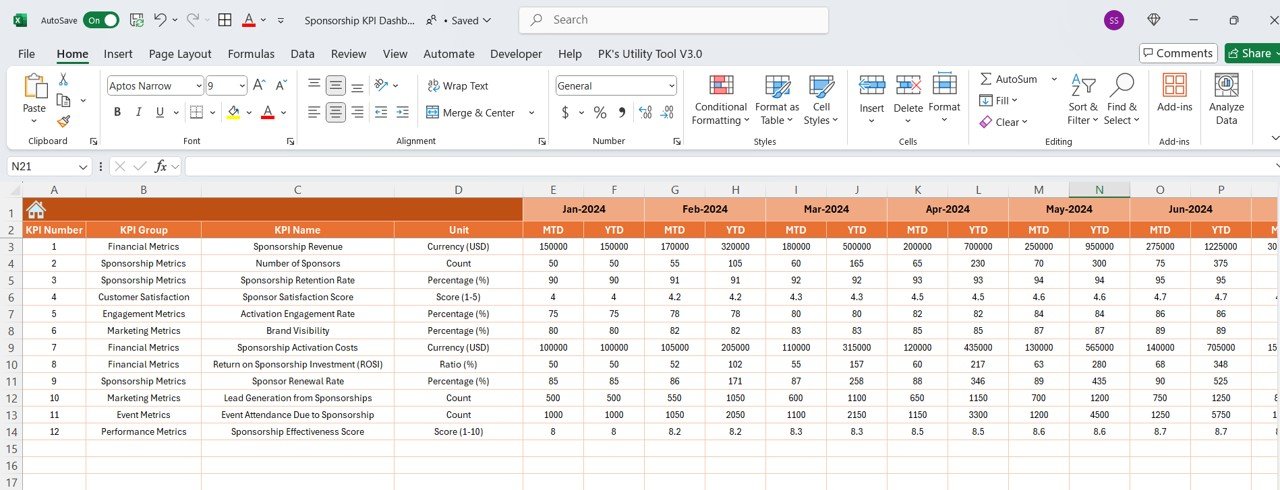
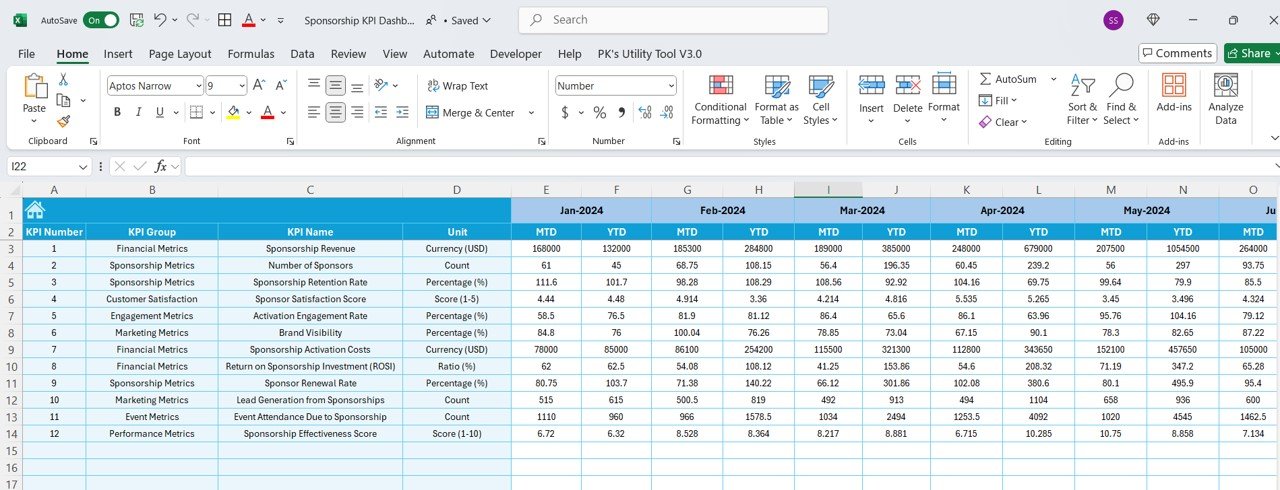
2️⃣ Input Sponsorship Data – Enter revenue, audience reach, sponsorship deliverables, and other key performance data into the dashboard.
3️⃣ Track Performance – Use the dashboard to monitor sponsorship revenue, brand exposure, and ROI in real time.
4️⃣ Analyze Insights – Use the interactive visual analytics to evaluate trends, performance, and areas for optimization in your sponsorship campaigns.
5️⃣ Generate Reports – Create customized reports to showcase sponsorship performance to stakeholders and partners.
Who Can Benefit from the Sponsorship KPI Dashboard in Excel:
- Event Planners
- Sponsorship Managers
- Marketing Teams
- Brand Managers
- Sports and Entertainment Organizers
- Corporate Sponsorship Teams
- PR and Media Professionals
- E-commerce Businesses with Sponsorship Deals
The Sponsorship KPI Dashboard in Excel is a must-have tool for anyone managing sponsorships or partnerships. It simplifies the tracking of sponsorship performance, ensures that all deliverables are met, and helps optimize sponsorship strategies to maximize ROI.
Click here to read the Detailed blog post
https://www.pk-anexcelexpert.com/sponsorship-kpi-dashboard-in-excel/
Visit our YouTube channel to learn step-by-step video tutorials
Youtube.com/@PKAnExcelExpert


Reviews
There are no reviews yet.