Managing Special Education Dashboard programs is never simple. Schools, education departments, NGOs, and policymakers must continuously track therapy sessions, student progress, assessment results, attendance, improvement percentages, and program effectiveness. When this data remains scattered across spreadsheets and manual reports, insights are delayed—and delays directly impact student outcomes.
That is exactly why the Special Education Dashboard in Power BI is a game-changing analytics solution 🚀.
This ready-to-use Power BI dashboard transforms raw special education data into clear, interactive, and decision-ready insights. Instead of spending hours creating reports, you gain instant visibility into how students, schools, disability types, and support programs perform—across months, locations, and initiatives.
Designed for real-world education environments, this dashboard empowers educators to move from reactive reporting to proactive intervention—with confidence, clarity, and control.
🔑 Key Features of Special Education Dashboard in Power BI
📊 Centralized special education performance analytics
🎛️ Interactive slicers for fast filtering
🏫 School-wise and city-wise comparison
♿ Disability type–based progress analysis
🧩 Support program effectiveness tracking
📅 Month-wise trend and seasonality insights
💡 Clear visuals for faster decisions
🔐 Secure and scalable Power BI architecture
📂 What’s Inside the Special Education Dashboard in Power BI
This dashboard is built with five powerful analytical pages, each answering a critical question about special education performance.
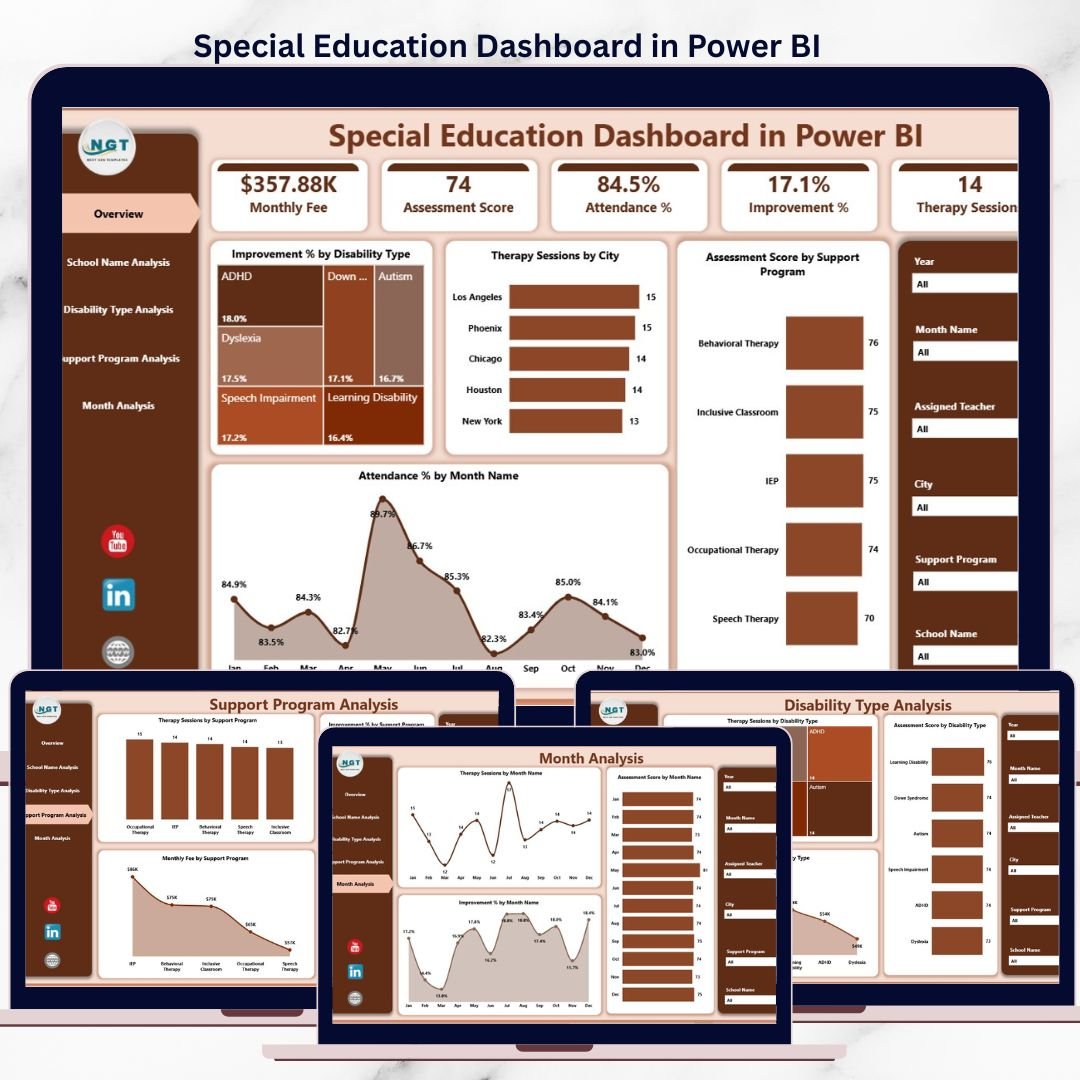
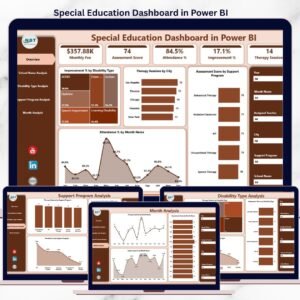
📌 Overview Page – Overall Special Education Performance
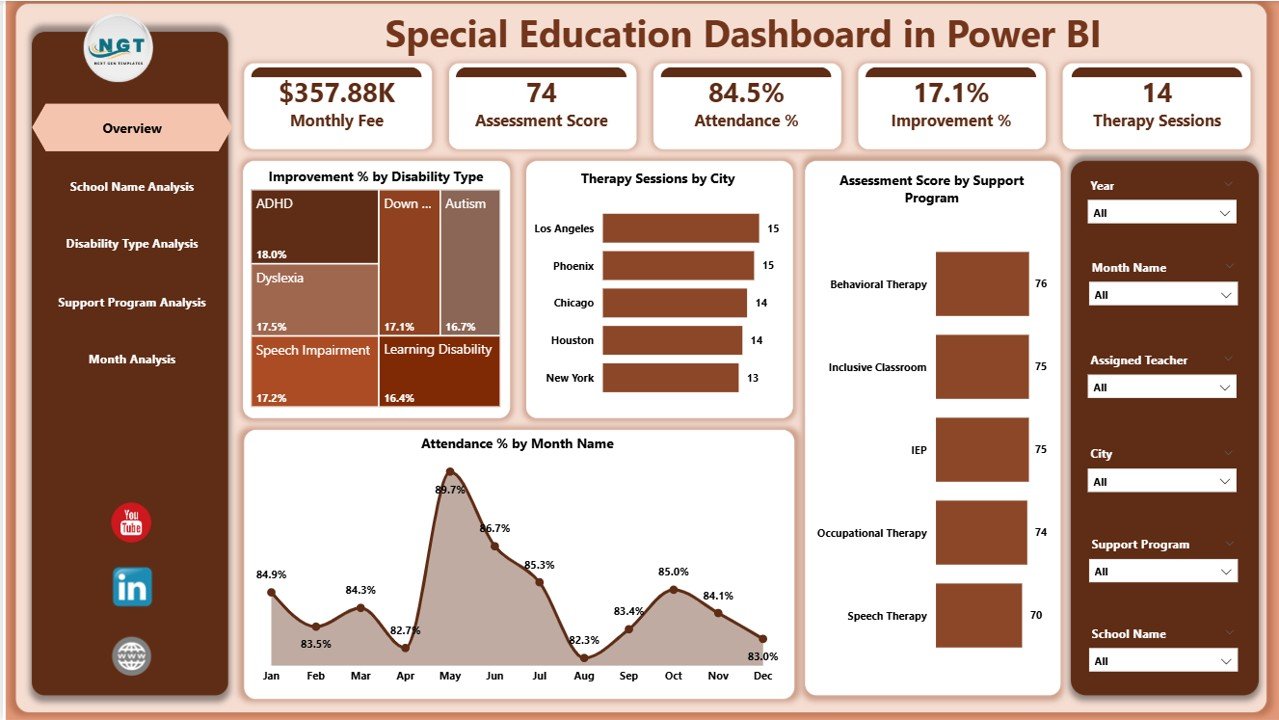
Special Education Dashboard
The Overview Page acts as the command center of the dashboard.
Key insights displayed:
-
♿ Improvement % by Disability Type – identifies progress levels across categories
-
🏙️ Therapy Sessions by City – shows workload distribution
-
🧩 Assessment Score by Support Program – evaluates program effectiveness
-
📅 Attendance % by Month – tracks student engagement trends
This page helps leadership understand the full picture instantly.
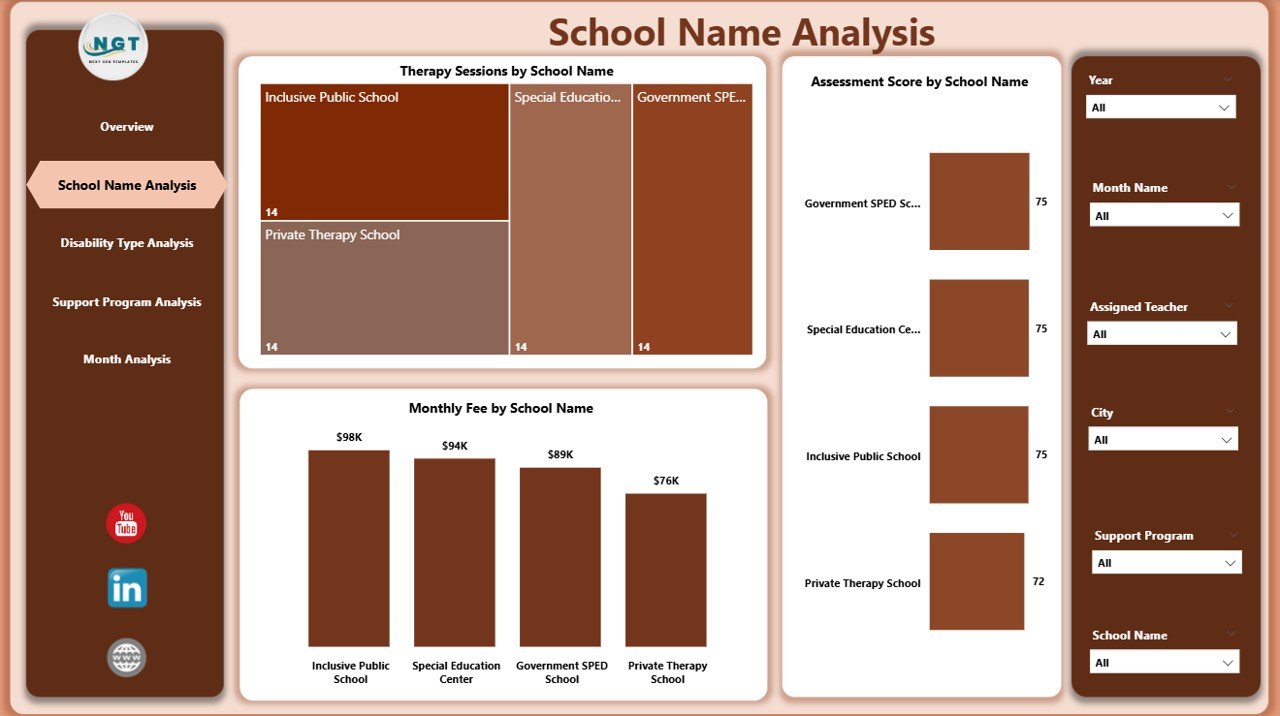
🏫 School Name Analysis – Compare School-Wise Performance
This page focuses on school-level comparison to identify strengths and gaps.
Key visuals include:
-
🩺 Therapy Sessions by School Name
-
🎯 Assessment Score by School Name
-
💰 Monthly Fee by School Name
With this analysis, administrators can support underperforming schools and replicate best practices from high performers.
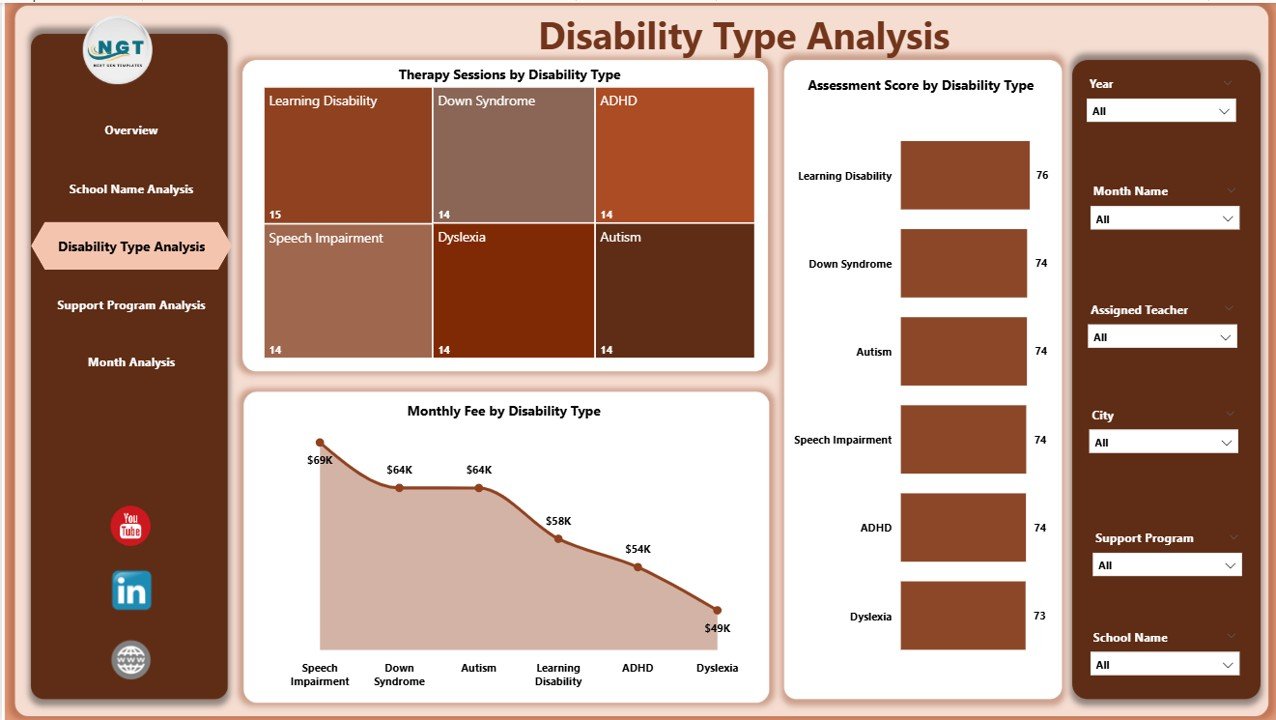
♿ Disability Type Analysis – Inclusive Progress Tracking
Special education requires disability-specific insights. This page provides exactly that.
What you can analyze:
-
🩺 Therapy Sessions by Disability Type
-
🎯 Assessment Score by Disability Type
-
💰 Monthly Fee by Disability Type
This ensures fair resource allocation and targeted intervention planning.
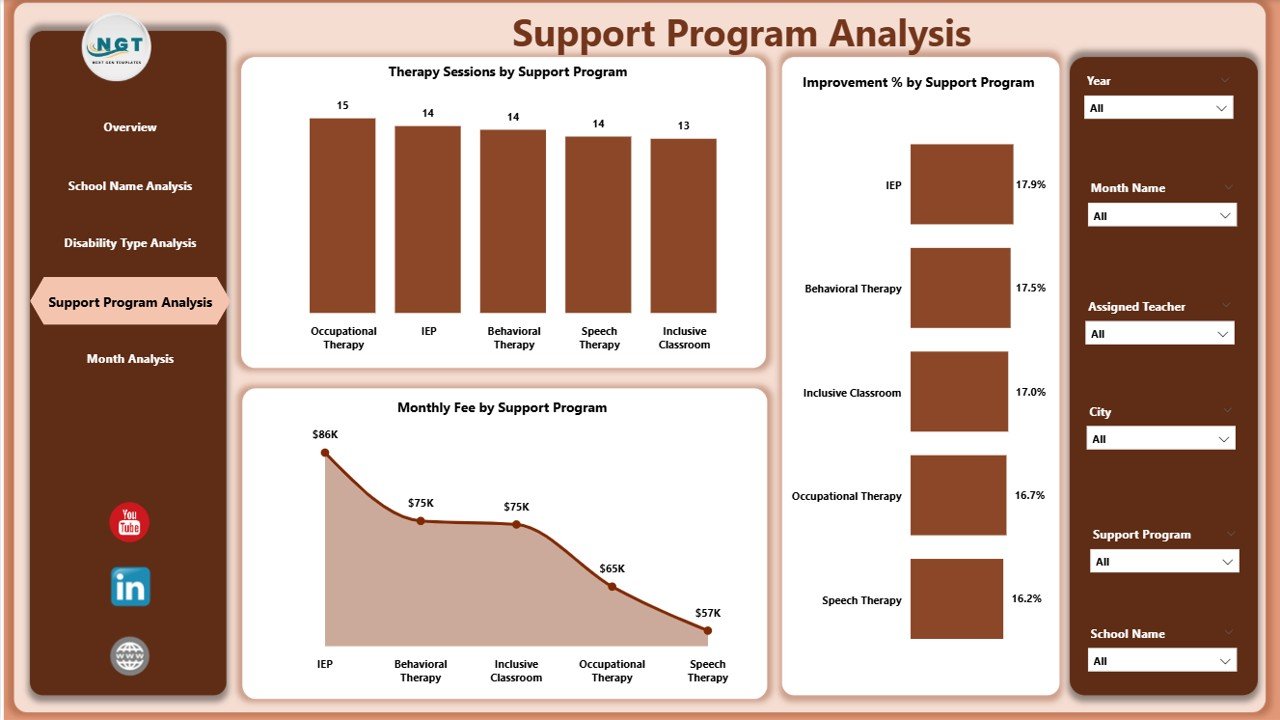
🧩 Support Program Analysis – Measure Program Effectiveness
Not all support programs deliver equal impact. This page reveals the truth.
Key insights:
-
📈 Improvement % by Support Program
-
🩺 Therapy Sessions by Program
-
🎯 Assessment Score by Program
-
💰 Monthly Fee by Program
Decision-makers can invest confidently in high-impact programs.
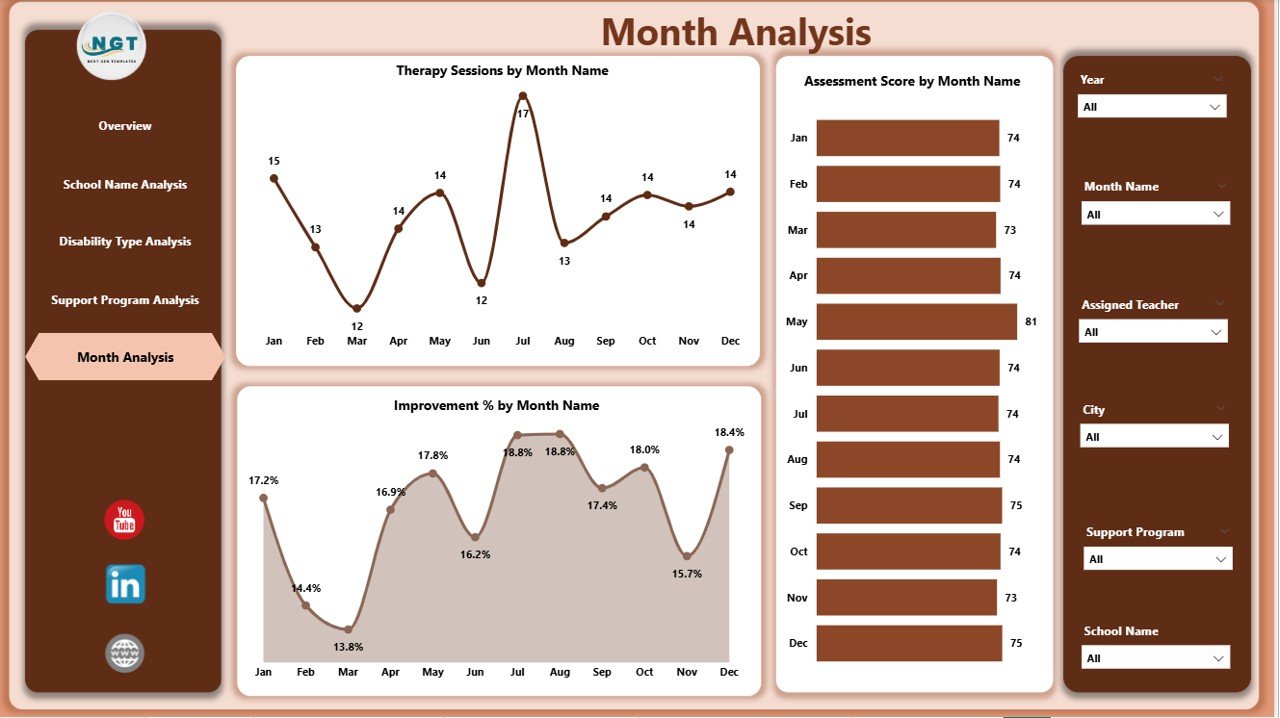
📅 Month Analysis – Track Progress Over Time
Performance trends matter more than single data points.
This page highlights:
-
📈 Improvement % by Month
-
🩺 Therapy Sessions by Month
-
🎯 Assessment Score by Month
-
💰 Monthly Fee by Month
With this view, teams can spot seasonal patterns and plan interventions early.
👥 Who Can Benefit from This Dashboard?
🏫 Schools & special education institutions
🧠 Special education coordinators
👩🏫 Therapists and educators
🏛️ Government & NGO education programs
📊 Education consultants and policymakers
📖 Click here to read the Detailed blog post
▶️ Visit our YouTube channel to learn step-by-step video tutorials
https://youtube.com/@PKAnExcelExpert


Reviews
There are no reviews yet.