Space missions demand precision. Satellite launches, deep-space exploration, R&D breakthroughs, and billion-dollar programs leave no room for reporting delays. Space Research Agencies KPI Dashboard in Power BI Yet many agencies still rely on static spreadsheets and manual consolidation.
Hours lost compiling reports.
Delayed decision-making.
Limited real-time visibility.
What if your agency could monitor mission KPIs, financial efficiency, operational reliability, and year-over-year progress — all inside one powerful, interactive dashboard?
Space Research Agencies KPI Dashboard in Power BI That’s exactly what the Space Research Agencies KPI Dashboard in Power BI delivers. 🌌
This ready-to-use Power BI solution transforms structured Excel data into dynamic visuals, interactive slicers, performance indicators, and trend analytics. Instead of building reports manually, you gain instant mission intelligence.
Professional. Interactive. Data-driven.
🚀 Key Feature of Space Research Agencies KPI Dashboard in Power BI
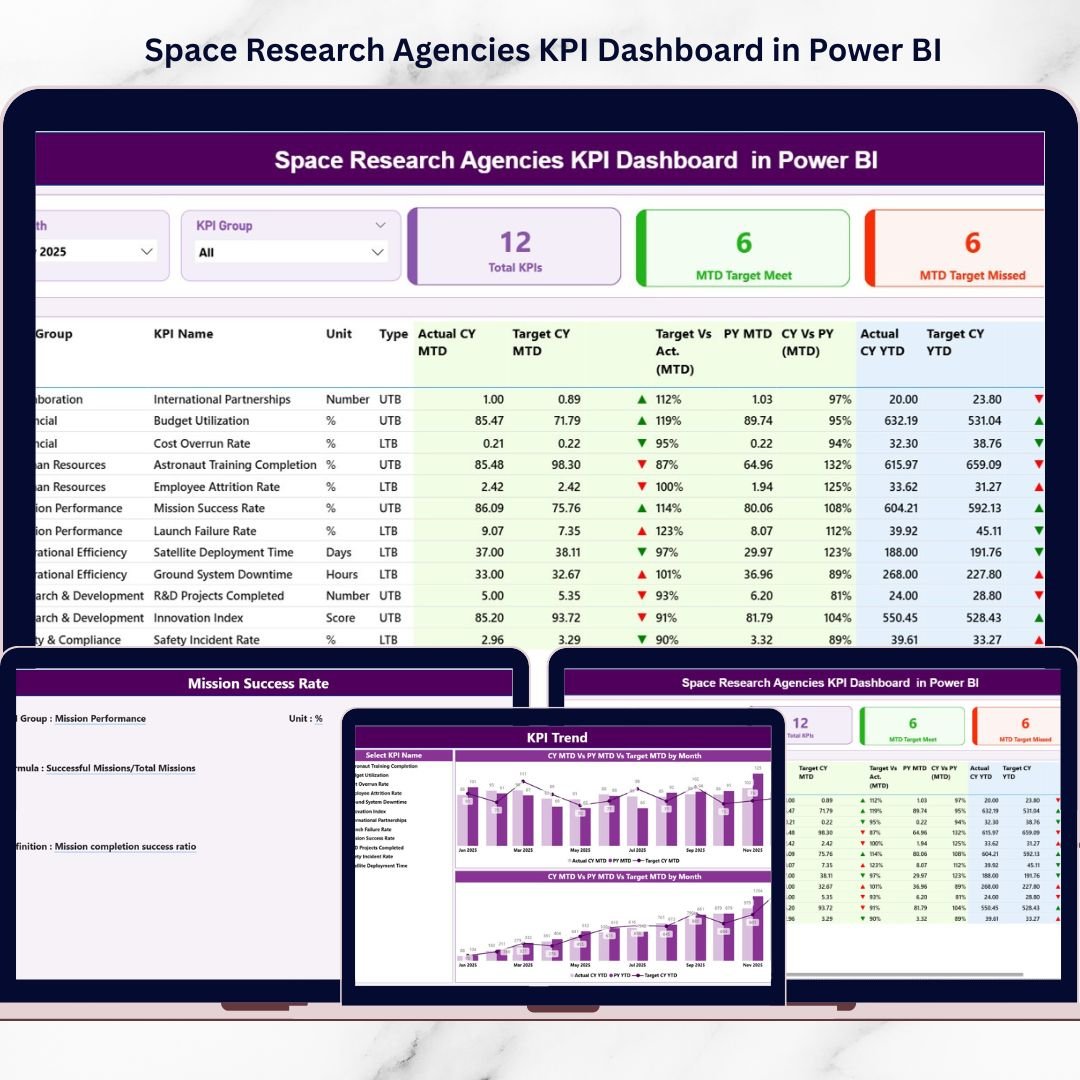
This dashboard includes 3 fully interactive pages designed for mission-level performance monitoring.
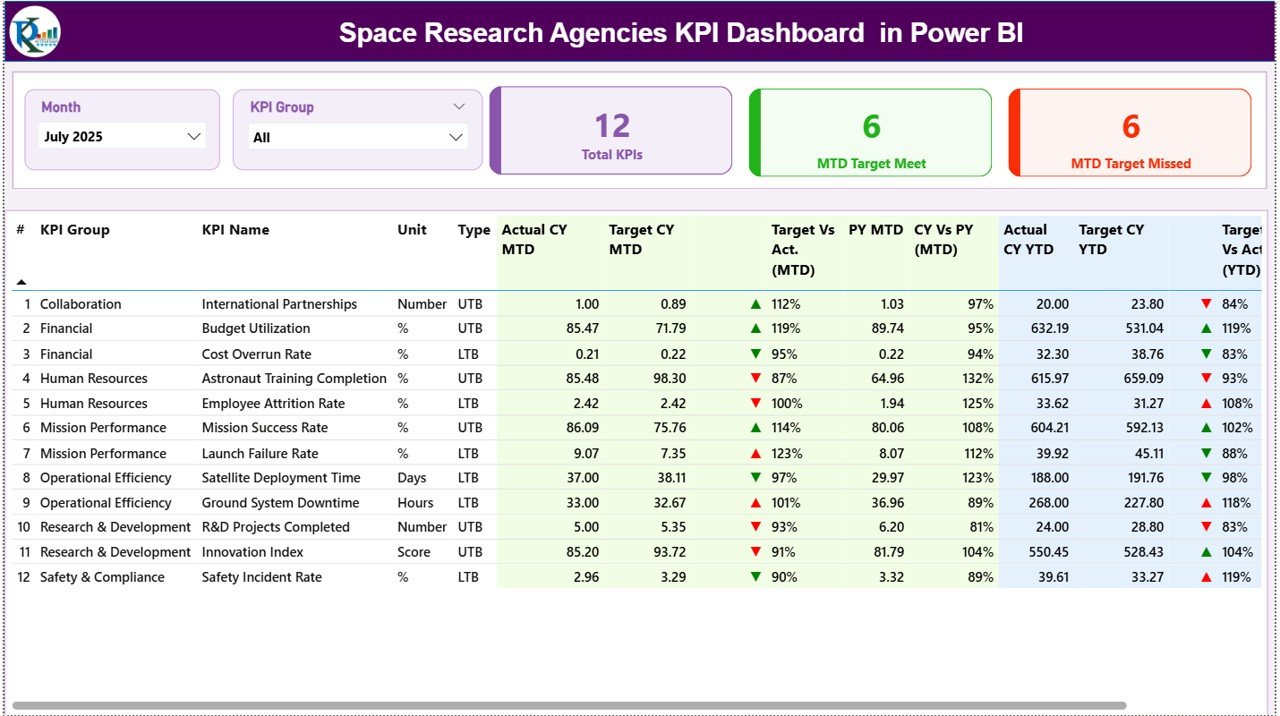
📊 1️⃣ Summary Page – Mission Control Center
At the top of the page:
✔ Month Slicer
✔ KPI Group Slicer
Three KPI Cards instantly display:
✔ Total KPI Count
✔ MTD Target Meet Count
✔ MTD Target Missed Count
Below that, a detailed KPI performance table includes:
• KPI Number & Name
• KPI Group & Unit
• KPI Type (LTB / UTB)
• Actual CY MTD & Target CY MTD
• ▲ / ▼ Performance Icons
• Target vs Actual %
• Previous Year MTD
• CY vs PY %
• Actual CY YTD & Target CY YTD
• YTD Variance %
• PY YTD & CY vs PY %
🟢 ▲ Green Arrow = KPI Achieved
🔴 ▼ Red Arrow = KPI Underperforming
You instantly identify mission risks and success areas.
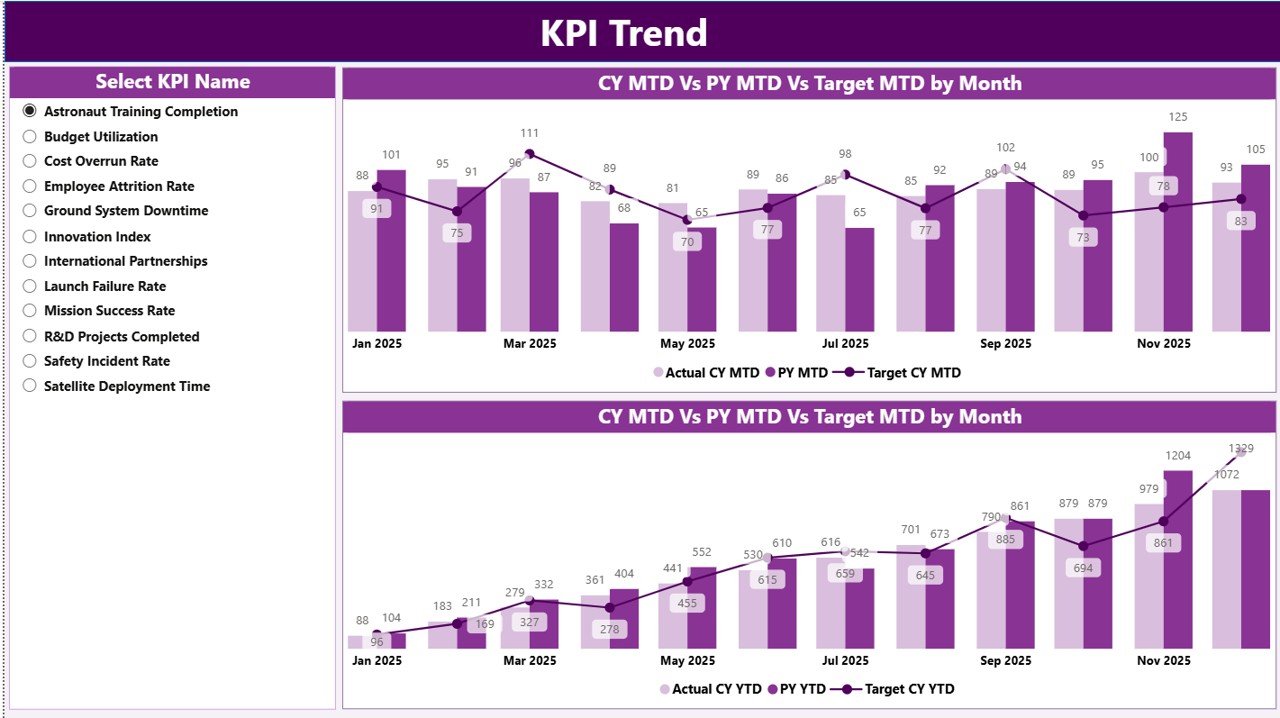
📈 2️⃣ KPI Trend Page – Performance Over Time
Select a KPI using the slicer and analyze:
✔ MTD Combo Chart (Actual vs Target vs PY)
✔ YTD Combo Chart (Actual vs Target vs PY)
These visuals help you:
• Detect seasonal mission trends
• Analyze R&D milestone progress
• Monitor cost variance patterns
• Compare performance vs last year
Instant slicer refresh ensures real-time insight.
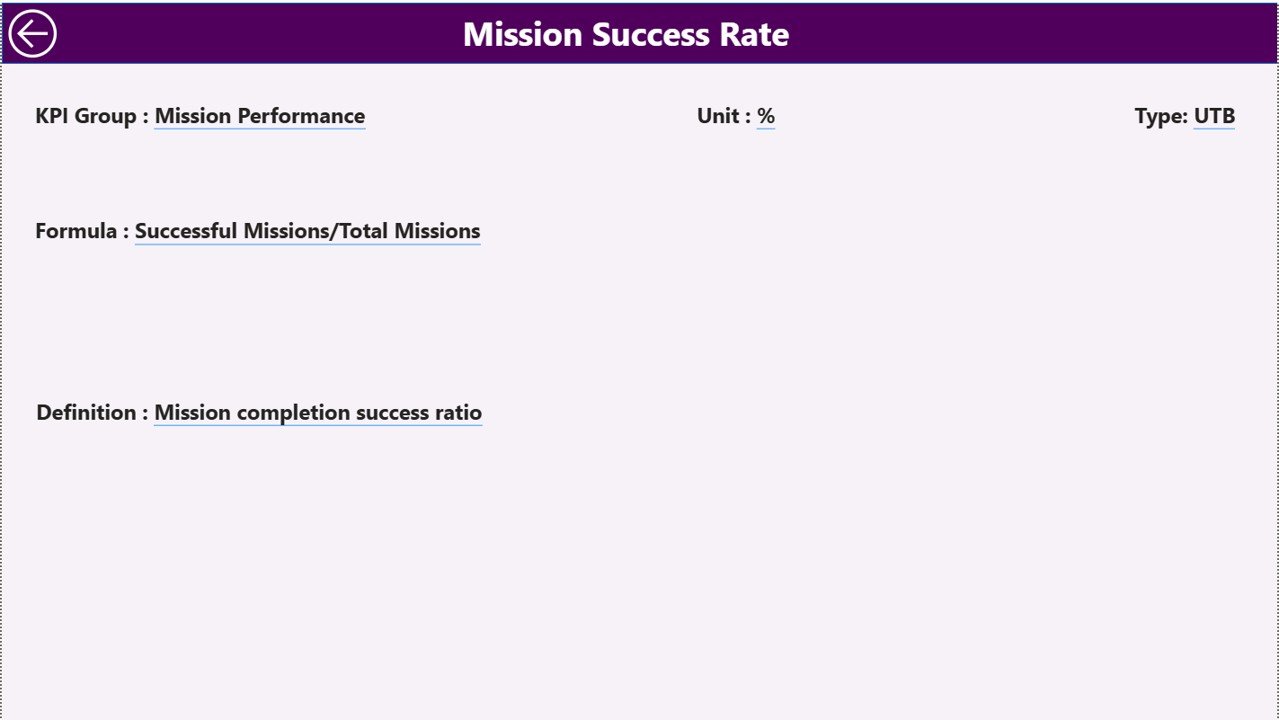
📘 3️⃣ KPI Definition Page – Drill-Through Transparency
Drill through any KPI to view:
✔ KPI Formula
✔ KPI Definition
✔ KPI Group
✔ Measurement Unit
✔ KPI Type (LTB or UTB)
This ensures complete clarity during executive reviews and stakeholder presentations.
📦 What’s Inside the Space Research Agencies KPI Dashboard in Power BI
When you purchase this dashboard, you receive:
✔ 3 Interactive Power BI pages
✔ Dynamic Month & KPI Group slicers
✔ MTD & YTD performance tracking
✔ Target vs Actual variance calculations
✔ Previous Year benchmarking
✔ Conditional performance icons
✔ Drill-through KPI documentation
✔ Excel-integrated data structure
This is not just a report — it’s a structured mission performance management system.
🛠 How to Use the Space Research Agencies KPI Dashboard in Power BI
Using this dashboard is simple:
1️⃣ Enter data in Excel (Input Actual, Input Target, KPI Definition sheets).
2️⃣ Open Power BI Desktop.
3️⃣ Click Refresh.
The dashboard updates automatically.
To analyze:
✔ Select Month
✔ Filter KPI Group
✔ Review MTD & YTD performance
✔ Drill into KPI definitions
No advanced Power BI skills required.
🌌 Who Can Benefit from This Space Research Agencies KPI Dashboard in Power BI
This dashboard is ideal for:
🚀 National Space Agencies
🛰 Satellite Programs
🔬 R&D Departments
💼 Aerospace Finance Teams
📊 Executive Leadership
🏢 Private Space Technology Companies
Whether managing interplanetary missions or satellite programs, this dashboard provides mission clarity.
The Space Research Agencies KPI Dashboard in Power BI helps you:
✔ Improve mission visibility
✔ Detect risks early
✔ Strengthen financial control
✔ Enhance executive reporting
✔ Align departments strategically
✔ Support data-driven mission planning
Instead of reacting to performance gaps, you manage proactively.
If your agency wants precision, transparency, and interactive mission analytics, this Power BI dashboard becomes your essential control center.
Click here to read the Detailed blog post
Visit our YouTube channel to learn step-by-step video tutorials:
👉 https://youtube.com/@PKAnExcelExpert