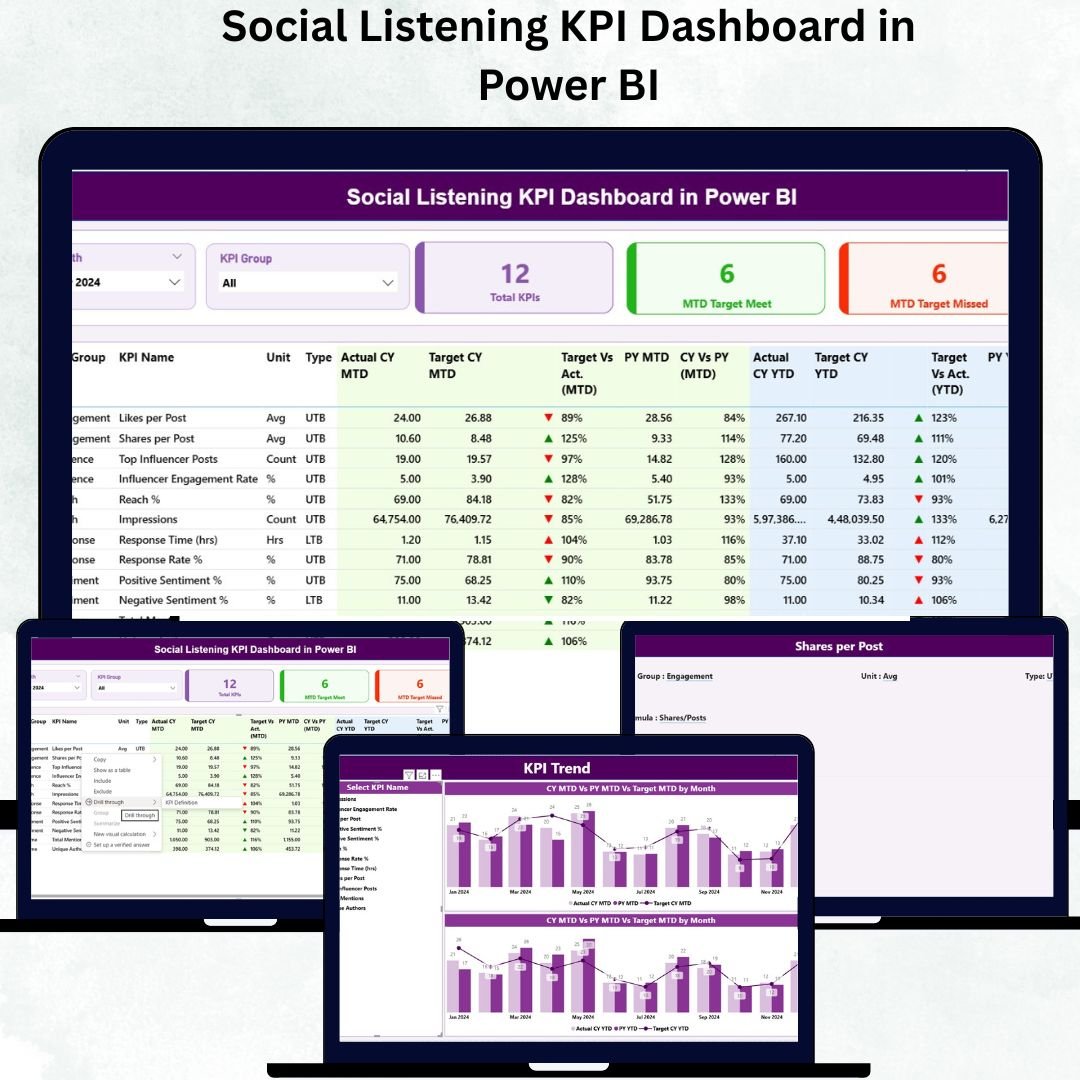
In the fast-paced digital world, understanding what people say about your brand online is no longer optional — it’s essential. The Social Listening Social Listening KPI Dashboard in Power BI is a powerful, ready-to-use tool that helps marketing and PR teams track brand mentions, audience sentiment, engagement, and campaign performance — all in one interactive Excel file. 📊
Instead of using multiple tools or manual reports, this dashboard gives you a complete picture of online brand perception, allowing you to make smarter, data-driven decisions that strengthen your marketing strategy and online presence.Social Listening KPI Dashboard in Power BI
✨ Key Features of Social Listening KPI Dashboard in Power BI?
✅ Real-Time KPI Tracking – Monitor social media performance across multiple channels with MTD (Month-to-Date) and YTD (Year-to-Date) metrics.
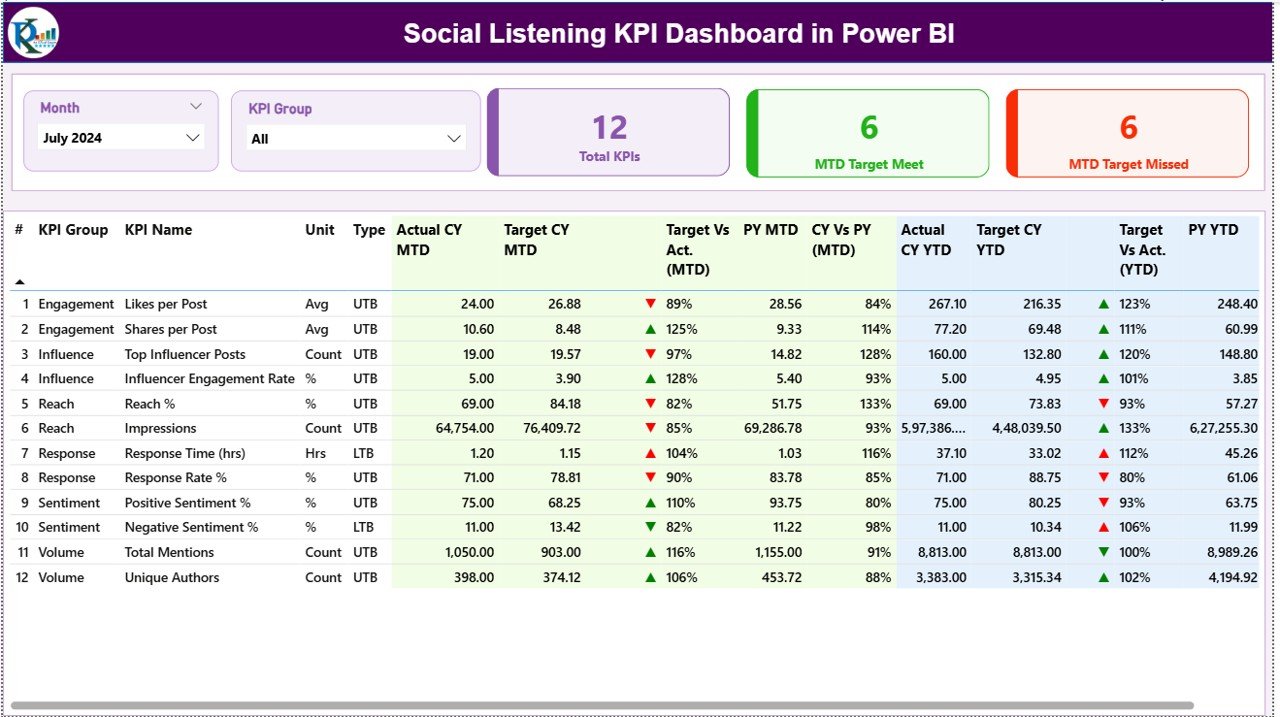
📈 Dynamic Performance Cards – Instantly see total KPIs, targets met, and missed goals with color-coded indicators (green ▲ for success, red ▼ for improvement).
🔍 Interactive Filters & Slicers – Easily switch between months, KPI groups, or campaign types to get the exact insights you need.
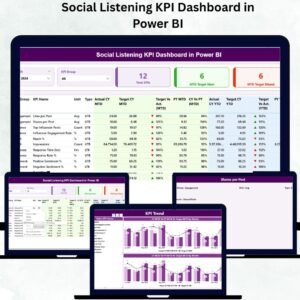
📊 Comprehensive Analysis Pages – Three well-structured sheets (Summary, KPI Trend, and KPI Definition) make analysis simple and fast.
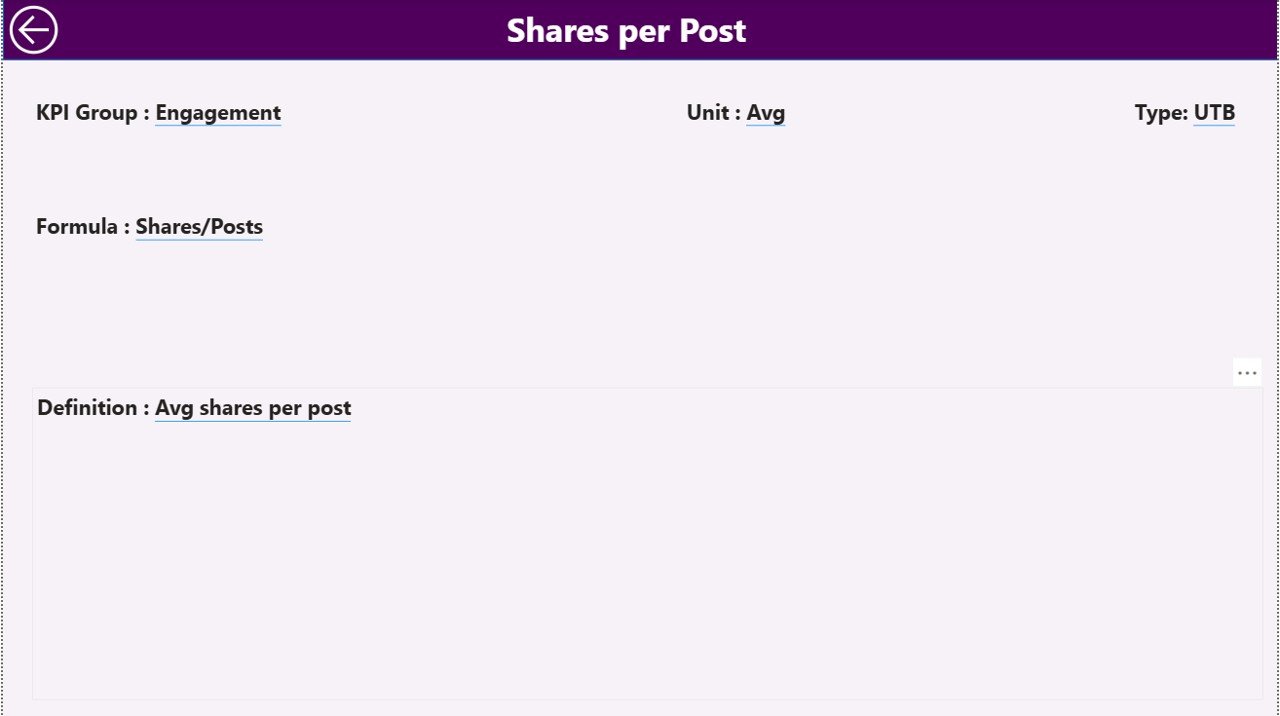
📖 Transparency & Clarity – Every KPI includes its formula, definition, and type (UTB/LTB), ensuring complete understanding across teams.
💡 Easy to Update & Customize – Replace sample data with your own metrics, and the dashboard automatically updates charts and indicators.
📦 What’s Inside the Social Listening KPI Dashboard in Power BI?
This Excel file is designed for efficiency and clarity, featuring the following components:
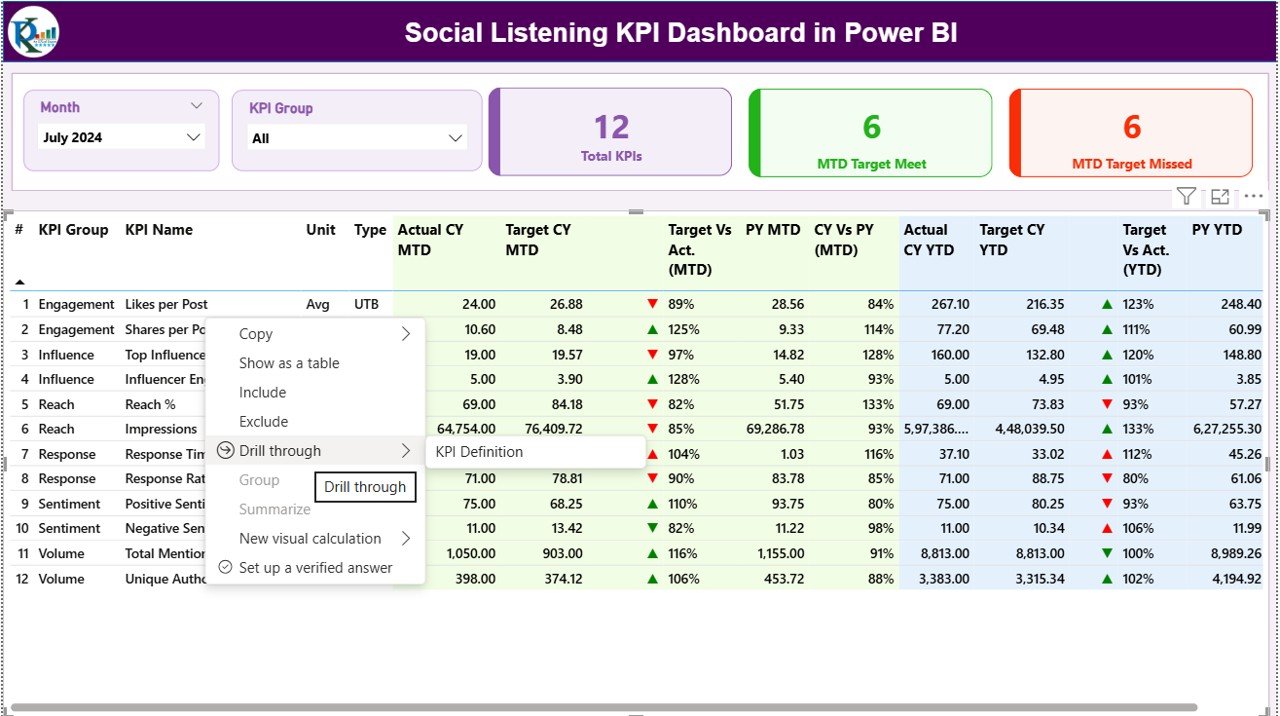
📋 Summary Page – A one-stop control center showing MTD and YTD Actual vs. Target values, along with comparisons to the previous year.Social Listening KPI Dashboard in Power BI
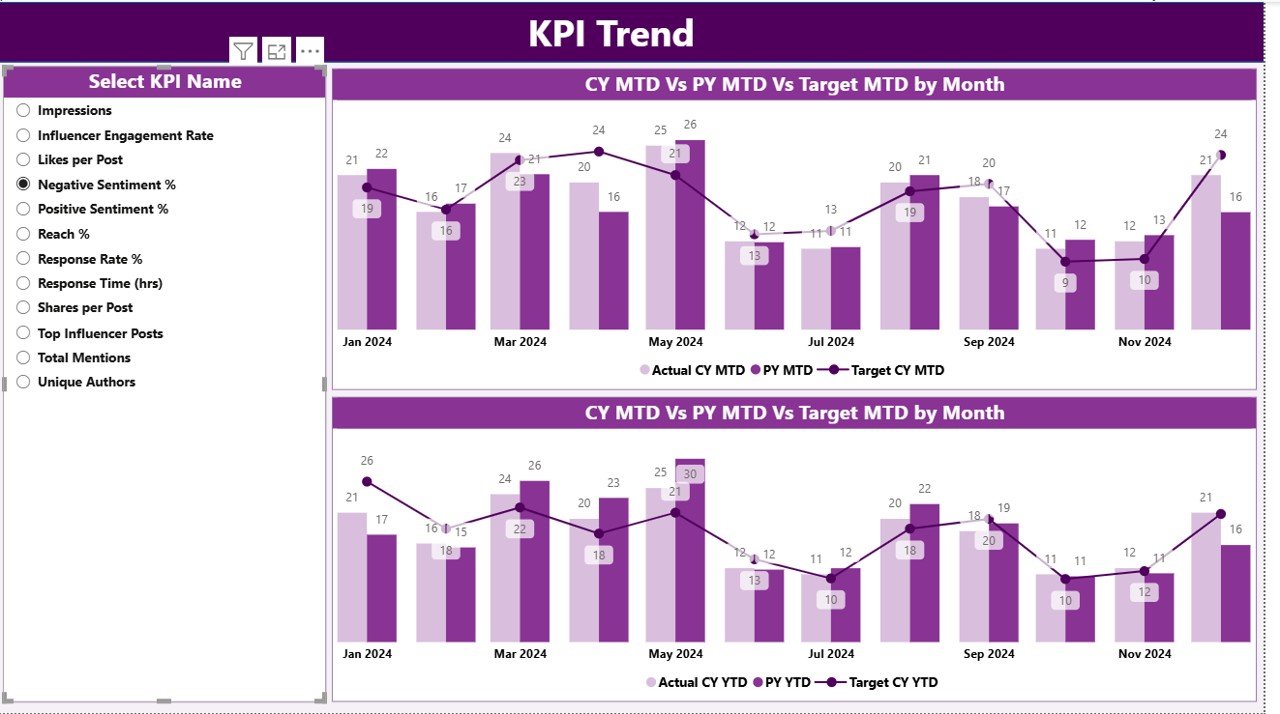
📈 KPI Trend Page – Combo charts visualize progress and trends for each KPI over time, helping you identify performance peaks and dips.
🧾 KPI Definition Page – A reference sheet listing KPI formulas, units, and descriptions — perfect for clarity and collaboration.
📊 Input Sheets (Actual, Target, Definition) – Organized data entry sheets that feed directly into the dashboard visuals, ensuring accuracy and easy refresh.Social Listening KPI Dashboard in Power BI
⚙️ How to Use the Social Listening KPI Dashboard in Power BI?
1️⃣ Input Your Data – Update the Actual and Target sheets with your monthly performance numbers.
2️⃣ Select Your Month – Use the slicer on the dashboard to view data for any period.
3️⃣ Analyze Performance – Instantly see which KPIs are performing above or below target.
4️⃣ Drill Down for Insights – Click on a KPI to view its detailed definition, formula, and trend.
5️⃣ Customize & Automate – Optionally, link the file with APIs or Power Query for automated social data imports.
💡 Pro Tip: You can connect this Excel dashboard to Power BI for advanced visualization and cross-platform analytics.
👥 Who Can Benefit from This Social Listening KPI Dashboard in Power BI?
🎯 Marketing Teams – Track the impact of social campaigns and audience reactions in real time.
📢 Public Relations Professionals – Monitor sentiment shifts and respond quickly to reputation risks.
📈 Data Analysts – Visualize performance trends, sentiment changes, and engagement statistics efficiently.
💬 Customer Experience Managers – Identify recurring feedback themes and improve brand responsiveness.
🏢 Executives & Decision-Makers – Access consolidated insights for better strategic decisions.
🌍 Agencies & Freelancers – Offer professional analytics reports to clients using a beautifully formatted Excel dashboard.


Reviews
There are no reviews yet.