
In the rapidly evolving smartphone industry, data-driven performance tracking is key to staying ahead of competitors. The Smartphone KPI Dashboard in Google Sheets empowers manufacturers, retailers, and distributors to monitor production, sales, and service performance seamlessly — all in one automated, cloud-based solution.
This ready-to-use dashboard consolidates every critical business metric into a visual and interactive interface. With real-time updates, MTD/YTD comparisons, and trend insights, it helps you make faster and smarter business decisions — without any complex software or coding required.
🔑 Key Features of the Smartphone KPI Dashboard in Google Sheets
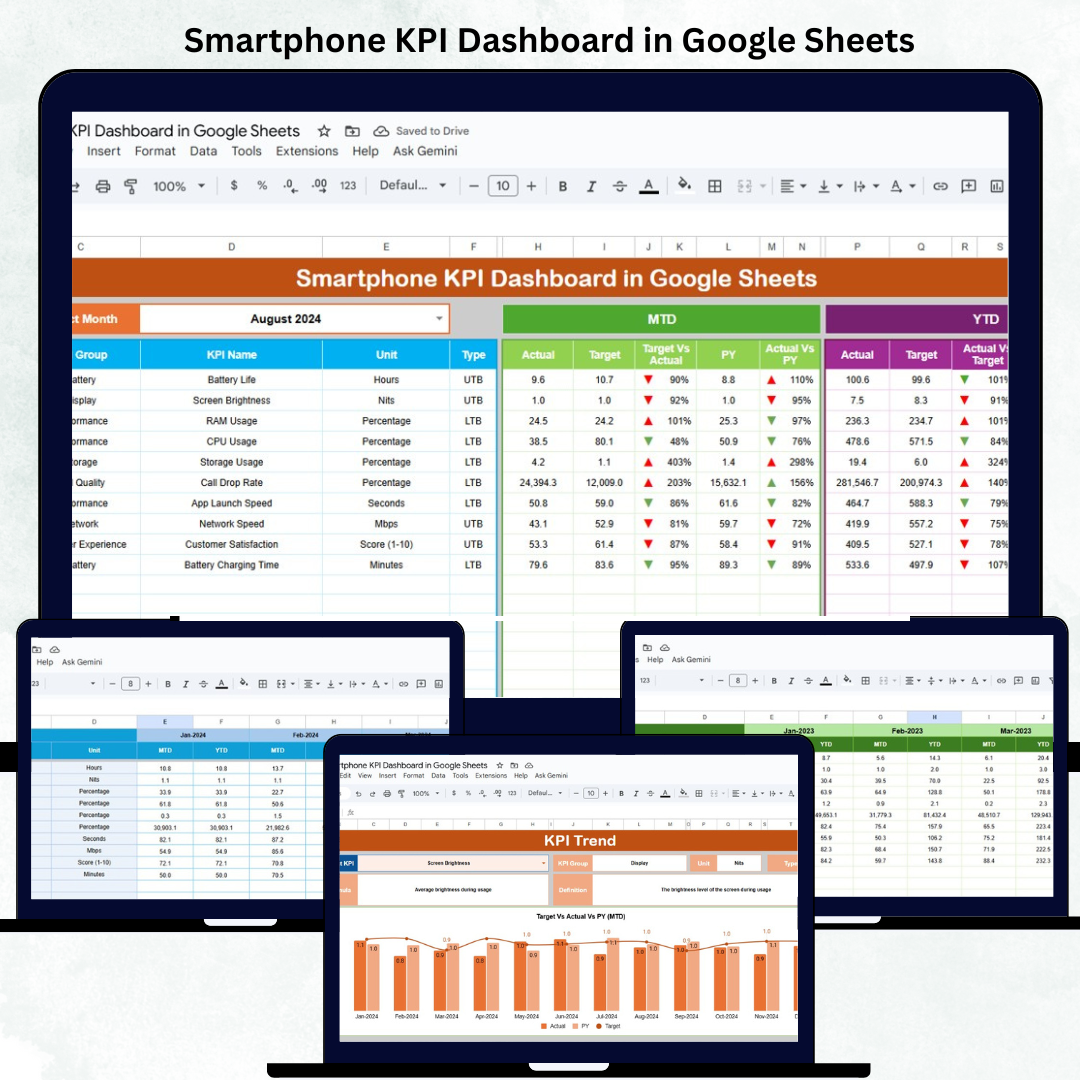
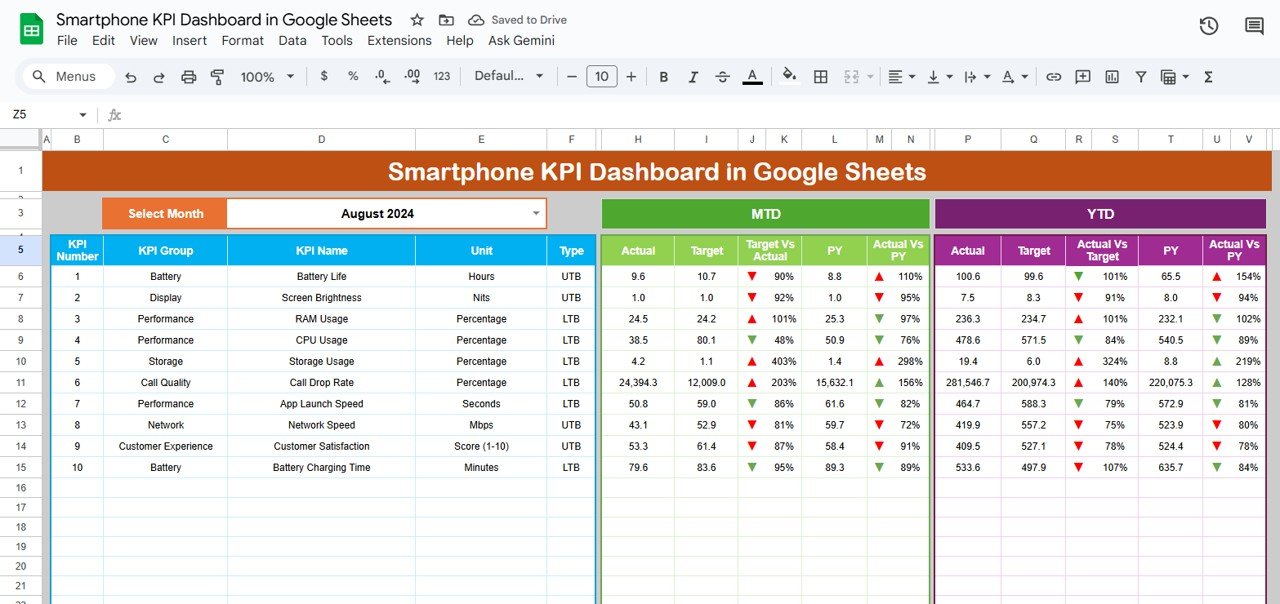
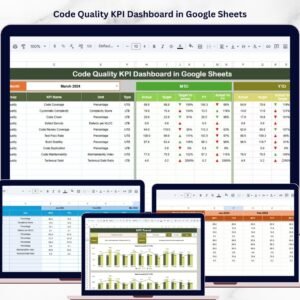
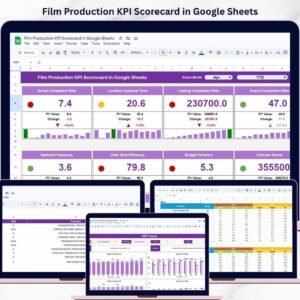
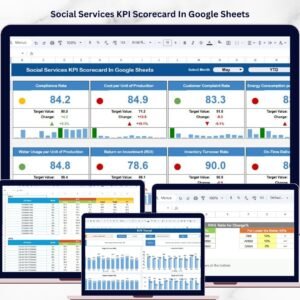
📊 Dashboard Sheet Tab (Main Dashboard)
The main analytics hub that displays all smartphone performance metrics using cards, charts, and visual indicators.
Features Include:
-
📅 Month Selector (Cell D3): Choose any month to automatically refresh the data view.
-
📈 MTD & YTD Insights: Track actual, target, and previous year performance instantly.
-
🟢 Conditional Formatting: View performance improvement or decline with colored arrows.
-
🧩 Dynamic Data Sync: Metrics adjust automatically when input data is updated.
Key KPIs Covered:
-
Sales Volume & Revenue
-
Production Efficiency
-
Defect Rate (%)
-
Warranty Claims
-
Customer Satisfaction Score
-
Product Return Rate
-
Average Selling Price
This tab provides an instant snapshot of your organization’s smartphone performance — ideal for executive summaries or weekly management reviews.
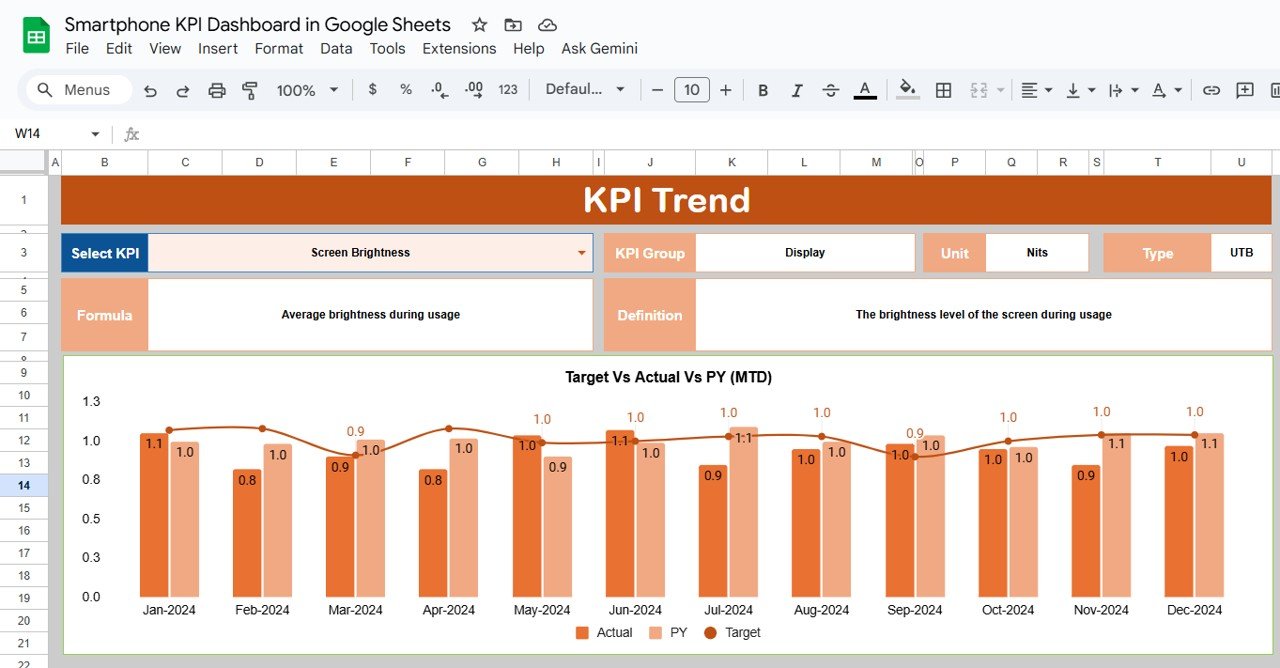
📉 KPI Trend Sheet Tab
Dive deeper into any KPI to view its performance trends over time.
Highlights:
-
Dropdown selector in Range C3 to choose KPI for analysis.
-
Displays KPI Group, Unit, Type (UTB/LTB), Formula, and Definition.
-
Interactive trend charts for MTD and YTD comparisons.
Use this view to spot seasonal trends, identify performance anomalies, and evaluate progress against long-term goals.
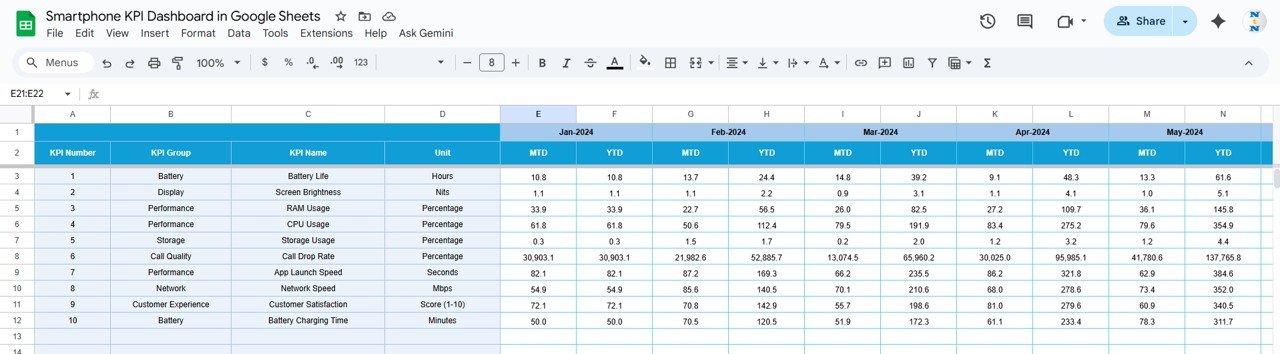
🧾 Actual Number Sheet Tab
Store and manage your performance data here.
Key Inputs:
-
Month
-
KPI Name
-
MTD Actual
-
YTD Actual
The sheet auto-updates based on the month set in Range E1, ensuring all visualizations reflect the correct reporting period.
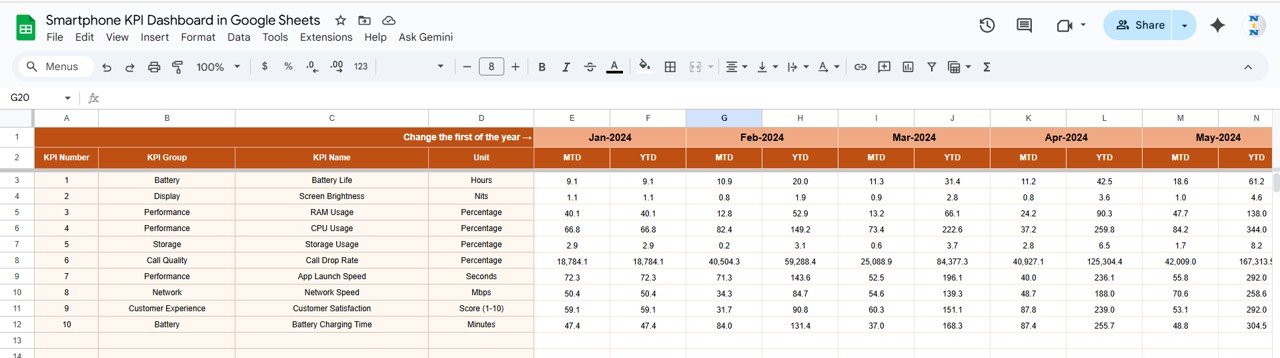
🎯 Target Sheet Tab
Input MTD and YTD target data for each KPI. The dashboard calculates performance vs. target percentages and applies automatic color coding to indicate results.
Example:
-
Green ↑ — Exceeding Target
-
Red ↓ — Below Target
This helps quickly identify underperforming metrics.
📆 Previous Year Number Sheet Tab
Enter last year’s performance data for comparative benchmarking. This enables YoY trend charts and progress tracking over time.
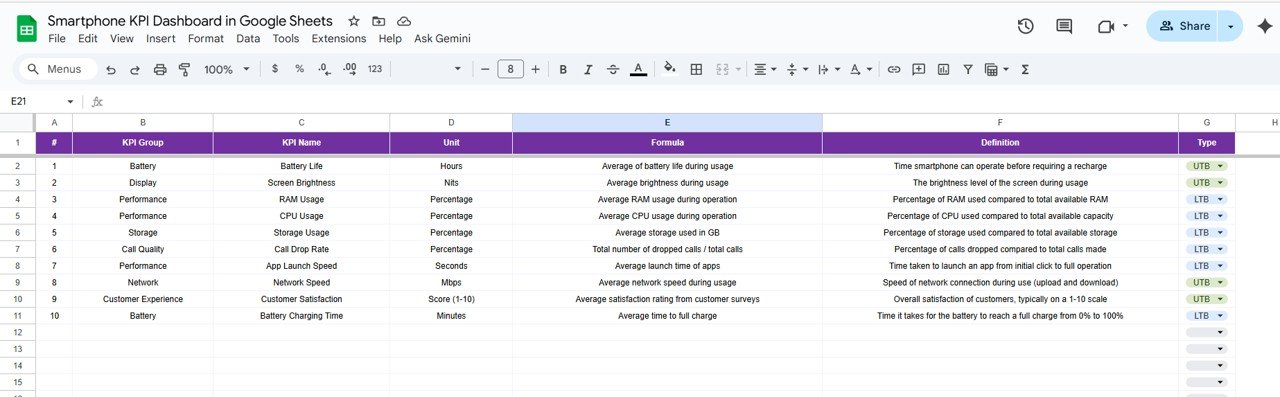
📘 KPI Definition Sheet Tab
This tab defines each KPI with the following details:
-
KPI Group
-
KPI Name
-
Unit of Measurement
-
Formula
-
Definition
-
Type (UTB – Upper the Better, LTB – Lower the Better)
This sheet serves as your KPI reference guide, ensuring everyone interprets data consistently.
📦 What’s Inside the Dashboard
✅ Interactive performance dashboard with automatic updates
✅ 6 organized tabs (Dashboard, Trend, Actual, Target, PY, Definition)
✅ Conditional formatting with up/down indicators
✅ KPI-based MTD and YTD analytics
✅ 100% editable Google Sheets file
✅ Multi-user collaboration via Google Drive
🧑💼 Who Can Use This Dashboard
📱 Smartphone Manufacturers — Track production efficiency and defect trends.
🏬 Retailers & Distributors — Monitor sales, returns, and customer ratings.
💼 Product Managers — Evaluate performance against targets and KPIs.
📊 Executives & Analysts — Review MTD/YTD summaries for strategy and planning.
It’s a complete management solution for smartphone businesses aiming to optimize performance and profitability.
⚙️ Opportunities for Improvement
Enhance your dashboard by:
-
📍 Adding regional sales and production breakdowns for deeper insights.
-
💰 Including profit margin and cost analysis KPIs.
-
🧾 Integrating Google Forms for automated feedback collection.
-
🧠 Adding forecasting models to predict future sales trends.
-
📤 Automating monthly summary reports using Google Apps Script.
🧠 Best Practices
✅ Regularly update Actual and Target sheets for accuracy.
✅ Use standardized KPI names to avoid mismatched data.
✅ Validate inputs such as cost and defect rates.
✅ Compare MTD vs YTD and PY monthly to spot performance shifts.
✅ Protect formula cells from editing to preserve dashboard integrity.
🌟 Why Choose the Smartphone KPI Dashboard in Google Sheets
-
📊 Holistic tracking for all smartphone business KPIs.
-
⚙️ Fully automated calculations and charts.
-
📈 Target vs Actual vs PY performance in one view.
-
☁️ Google Sheets-based for easy access & sharing.
-
🧩 Fully customizable to suit your reporting needs.
The Smartphone KPI Dashboard in Google Sheets is your go-to analytics system for transforming complex performance data into actionable insights — helping you make informed, data-backed decisions that drive growth and innovation.
🔗 Read the detailed blog post
Watch the step-by-step video Demo:


Reviews
There are no reviews yet.