Managing smart city projects without a structured performance monitoring system often leads to delays, budget overruns, missed targets, and weak accountability. Because smart city initiatives involve complex infrastructure, public funding, multiple stakeholders, and high public visibility, relying on manual reports or static Excel sheets is no longer effective.
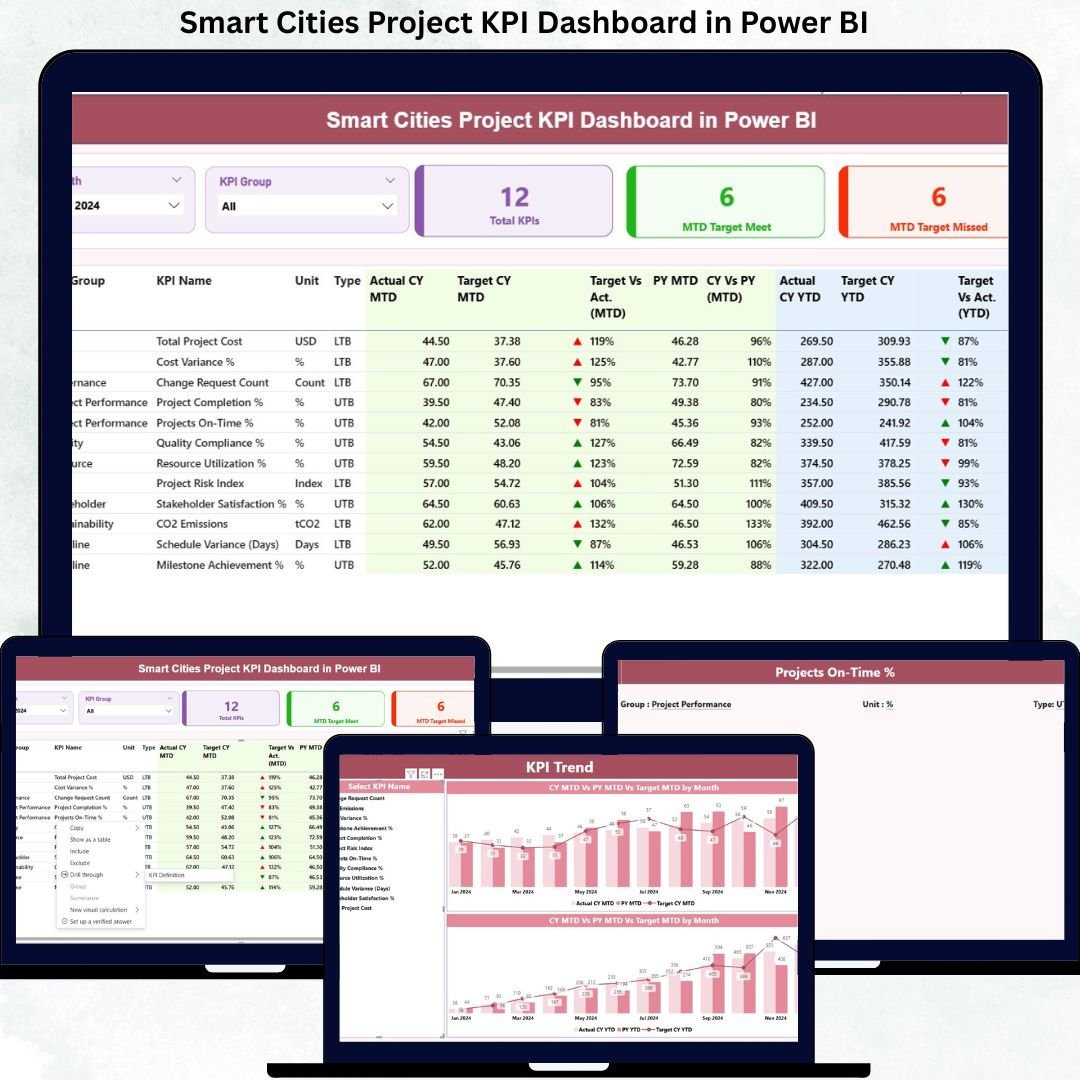
That is exactly why the Smart Cities Project KPI Dashboard in Power BI is designed as a powerful, ready-to-use performance monitoring solution for modern urban governance.
This professionally built dashboard converts raw project data into clear KPIs, visual indicators, and actionable insights. Instead of chasing updates across departments, project leaders get a single, centralized Power BI dashboard that highlights project health, target achievement, trends, and risks—month after month.
🚀 Key Features of Smart Cities Project KPI Dashboard in Power BI
-
📊 Centralized KPI Monitoring to track all smart city project KPIs in one interactive dashboard
-
📅 Dynamic Month & KPI Group Slicers for focused and flexible analysis
-
🎯 MTD & YTD Performance Tracking with automatic calculations
-
📈 Target vs Actual Analysis using icons and percentage indicators
-
🔁 Current Year vs Previous Year Comparison for performance benchmarking
-
📉 Trend Analysis Charts to track progress over time
-
🔍 Drill-Through KPI Definitions for complete transparency
-
📂 Excel-Based Data Input for easy updates without technical complexity
📦 What’s Inside the Smart Cities Project KPI Dashboard in Power BI
This dashboard includes three professionally designed Power BI pages, each serving a specific purpose:
-
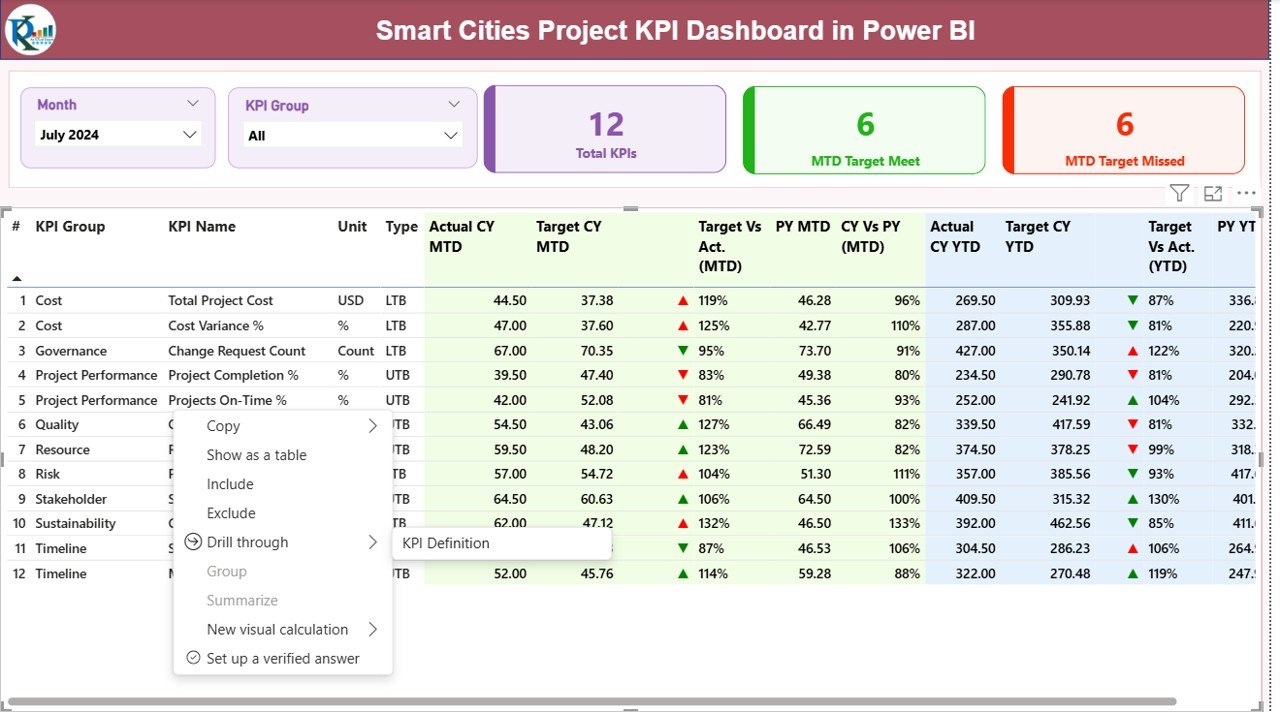
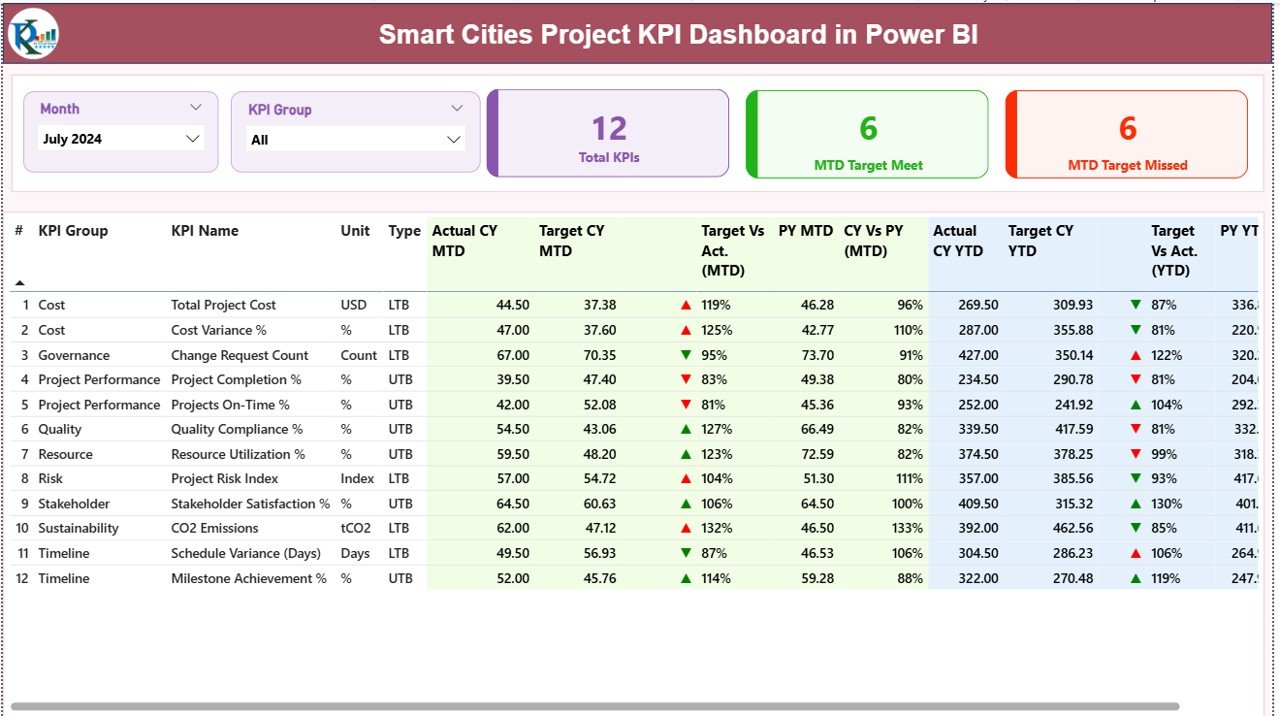
🧭 Summary Page
Provides a high-level view of all KPIs with total KPI count, MTD target met, and MTD target missed cards. A detailed KPI table shows Actual, Target, CY vs PY, and visual indicators for quick decision-making. -
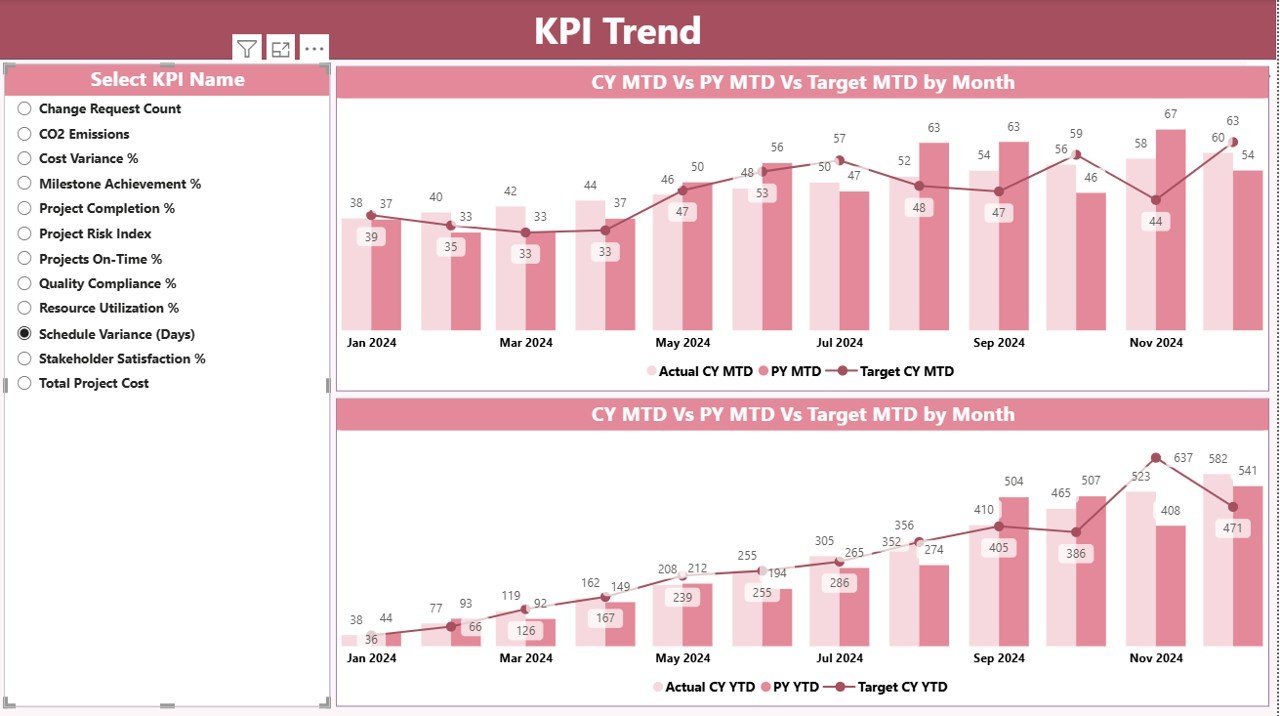
📊 KPI Trend Page
Displays MTD and YTD trend charts comparing Current Year Actuals, Previous Year Actuals, and Targets. Users can select individual KPIs to analyze performance movement over time. -
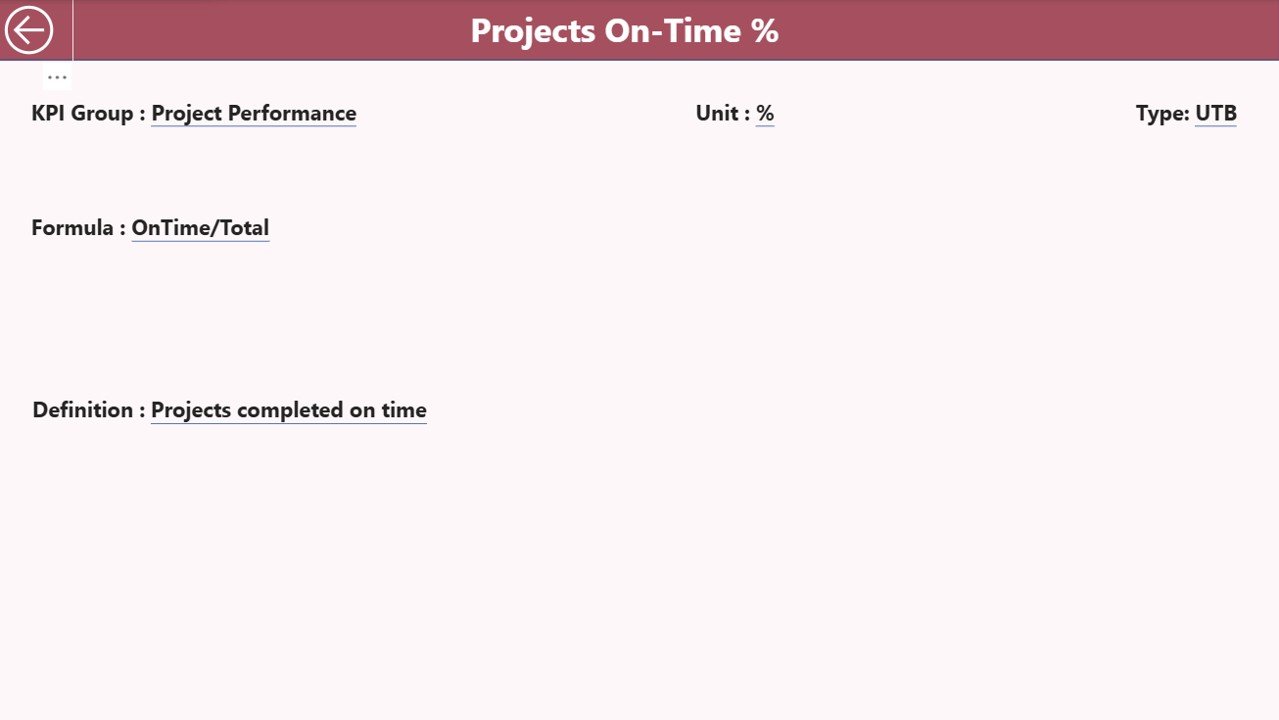
📘 KPI Definition Page
Acts as a knowledge repository, showing KPI formula, definition, unit, and type (LTB/UTB). This page opens via drill-through from the Summary Page to maintain clarity and consistency.
🛠️ How to Use the Smart Cities Project KPI Dashboard in Power BI
Using this dashboard is simple and efficient:
-
📥 Enter Actual KPI values in the Input_Actual Excel sheet
-
🎯 Enter Target KPI values in the Input_Target Excel sheet
-
🧾 Maintain KPI metadata in the KPI Definition sheet
-
🔄 Refresh the Power BI file
-
🧠 Use slicers, tables, charts, and drill-through to analyze performance
No advanced Power BI skills are required—basic knowledge is enough to get started.
👥 Who Can Benefit from This Smart Cities Project KPI Dashboard
-
🏙️ Smart City Project Managers
-
🏗️ Urban Infrastructure Planners
-
🏛️ Municipal & Government Administrators
-
📋 PMO and Monitoring Teams
-
🧑💼 Infrastructure Consultants
-
📊 Policy & Governance Decision-Makers
If you manage public projects where accountability, transparency, and timely delivery matter, this dashboard is built for you.
Click here to read the Detailed Blog Post
Watch the step-by-step video tutorial:


Reviews
There are no reviews yet.