Managing smart city procurement without real-time performance tracking often leads to budget overruns, vendor risks, compliance gaps, and weak transparency. Because smart city procurement deals with large public funds, multiple suppliers, strict regulations, and high public accountability, relying on manual reports is no longer practical.
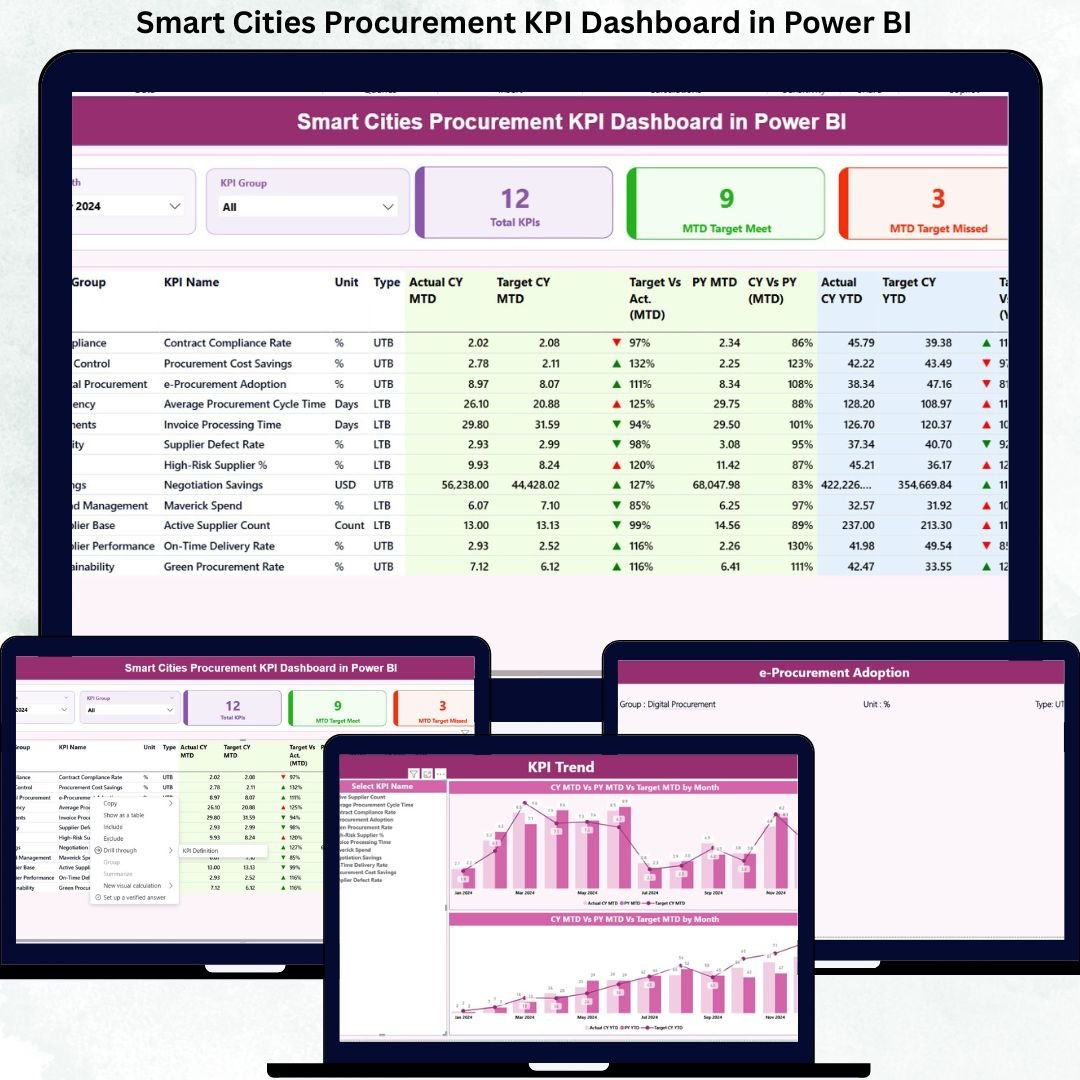
That is exactly why the Smart Cities Procurement KPI Dashboard in Power BI is designed as a powerful, ready-to-use analytical solution. This dashboard transforms raw procurement data into clear KPIs, visual indicators, and actionable insights, helping decision-makers track performance instantly and confidently.
Built using Power BI with Excel as the data source, this dashboard offers a perfect balance of simplicity, flexibility, and advanced analytics—making it ideal for smart city governance.
🔑 Key Features of Smart Cities Procurement KPI Dashboard in Power BI
📊 Centralized Procurement KPI Monitoring
Track all smart city procurement KPIs from a single interactive Power BI dashboard instead of juggling multiple Excel files.
📅 Dynamic Month & KPI Group Slicers
Instantly filter procurement KPIs by reporting month or procurement category for focused analysis.
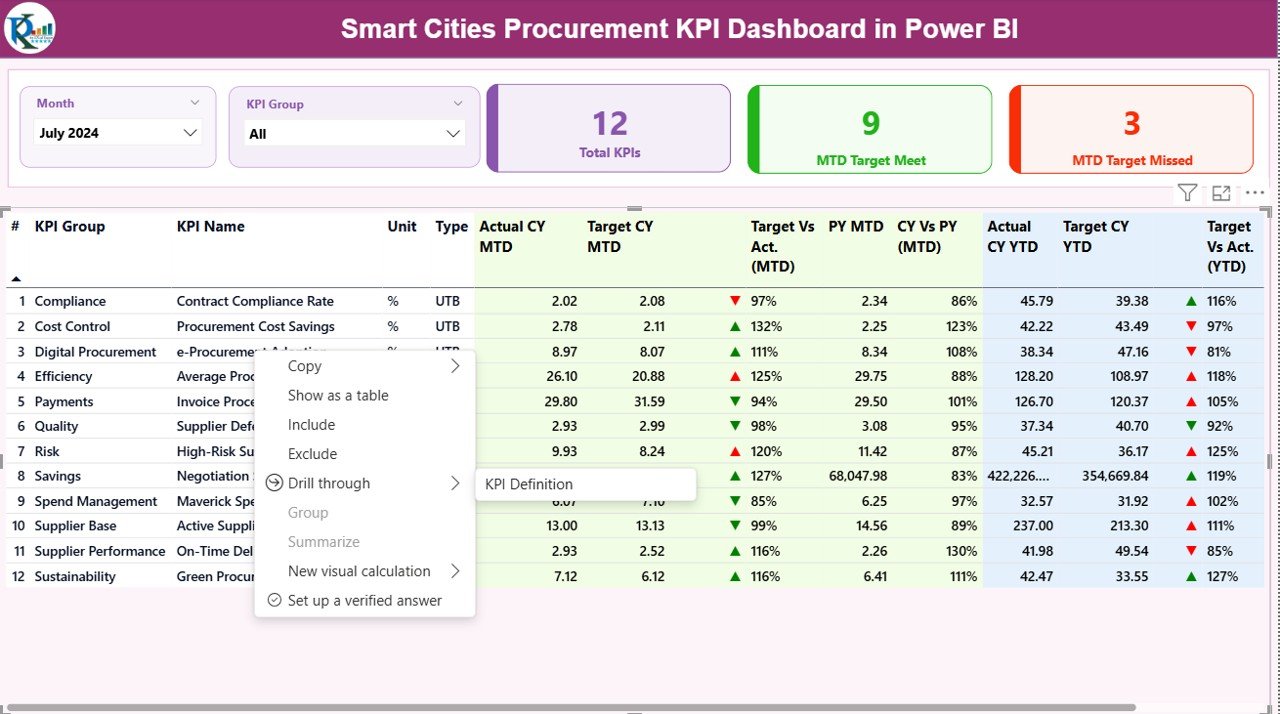
🎯 MTD & YTD Performance Tracking
Monitor Month-to-Date and Year-to-Date performance with automated calculations and visual status indicators.
📈 Target vs Actual Comparison
Quickly identify underperformance or overachievement using percentage metrics and directional icons.
🔁 Current Year vs Previous Year Analysis
Compare procurement efficiency across years to evaluate improvements or emerging risks.
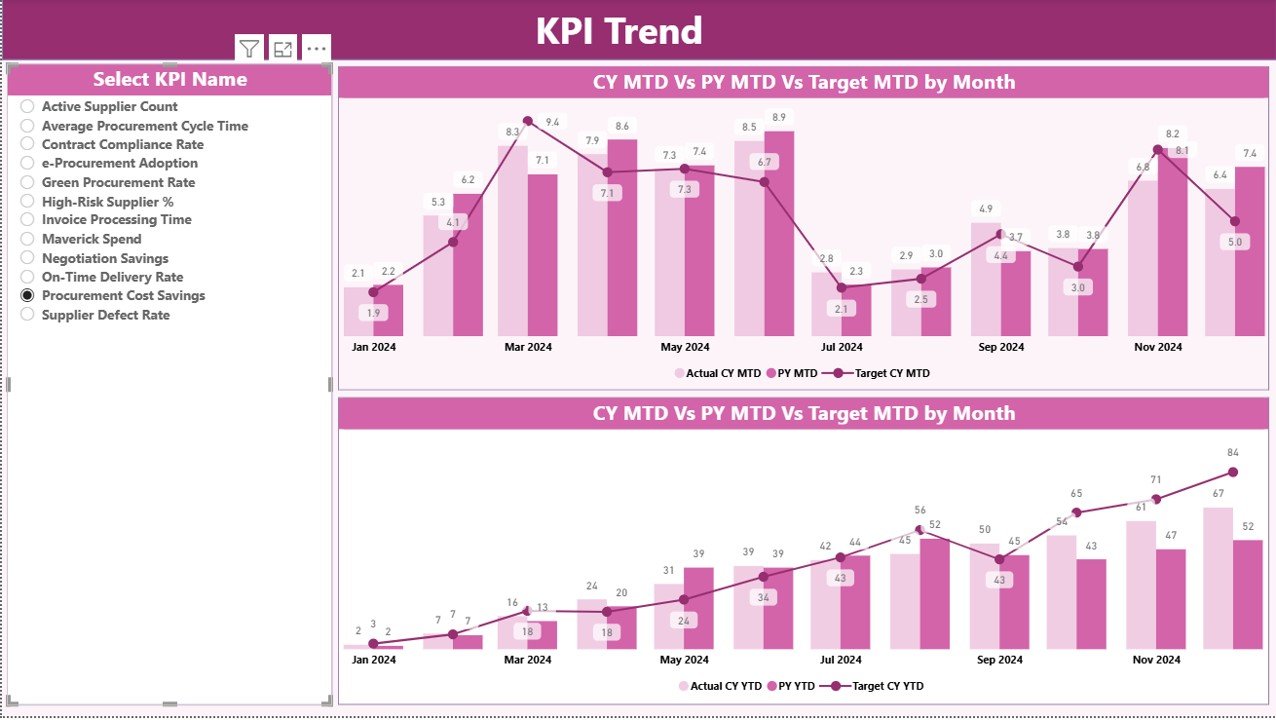
📉 Trend Analysis with Combo Charts
Analyze MTD and YTD trends over time to spot procurement issues early.
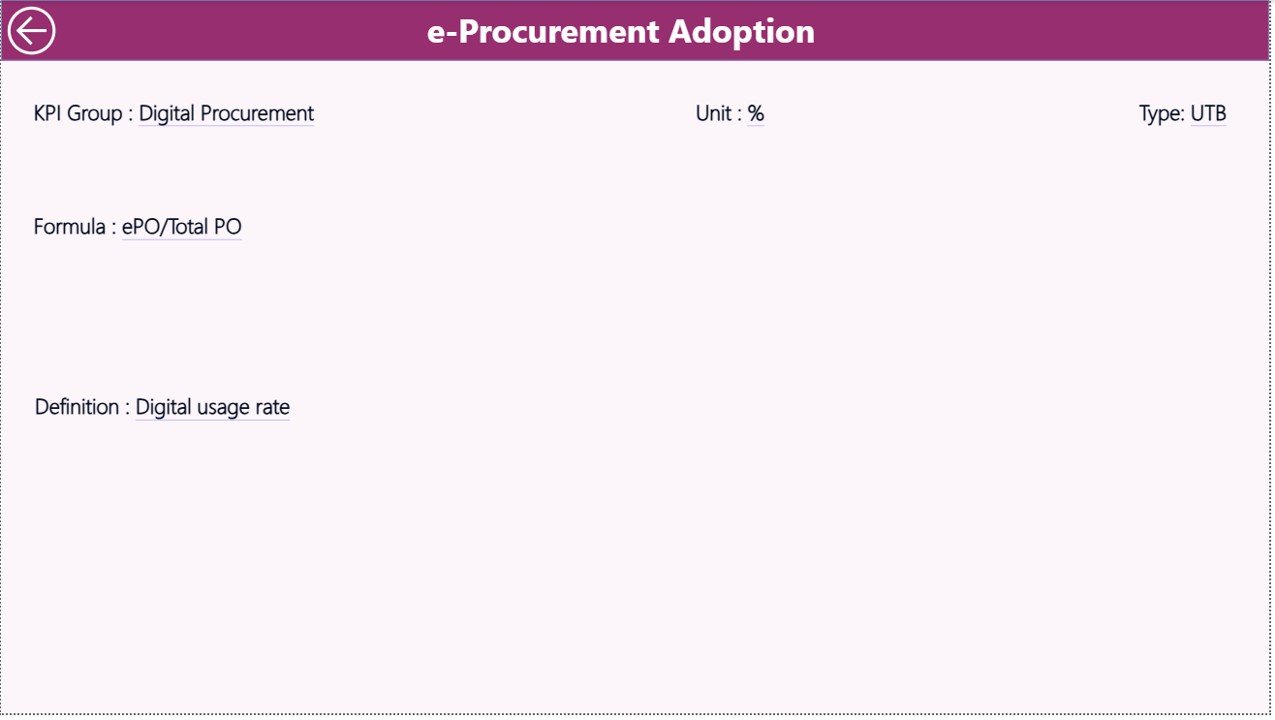
📘 KPI Definition & Formula Transparency
Ensure clarity and governance with a dedicated KPI Definition page showing formulas and logic.
📦 What’s Inside the Smart Cities Procurement KPI Dashboard in Power BI
This professionally designed Power BI file contains three powerful analytical pages:
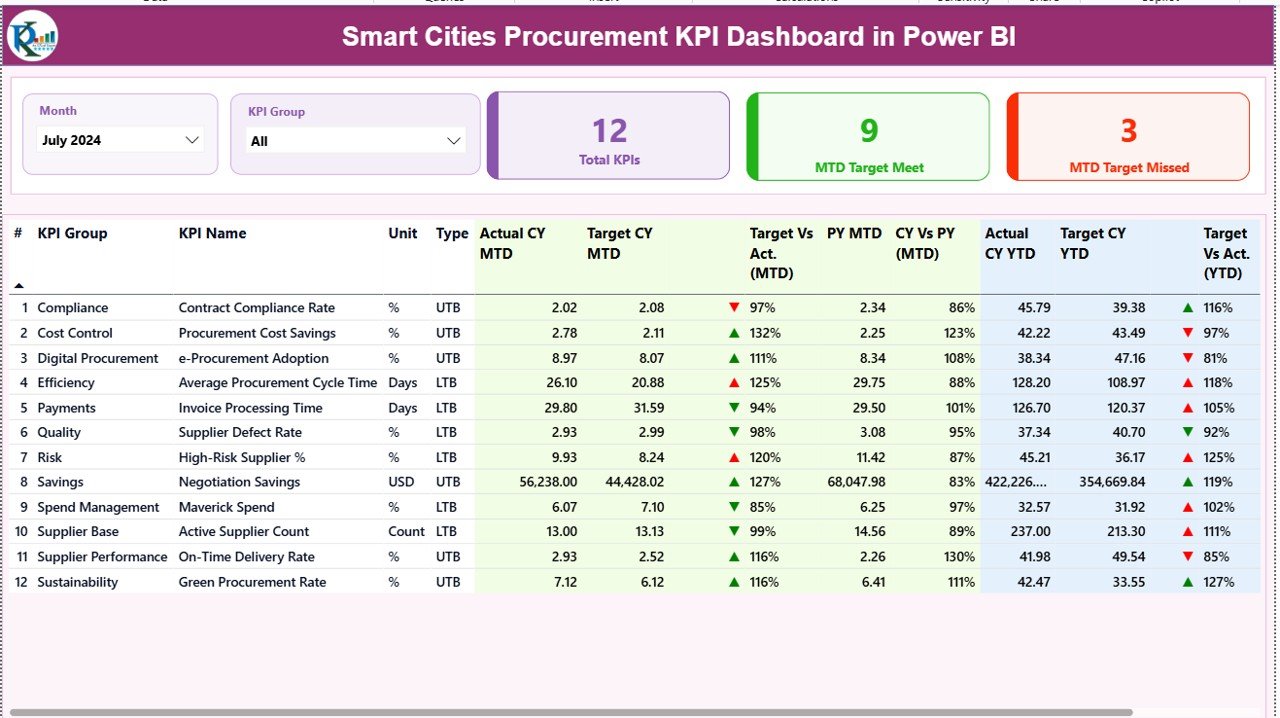
📍 Summary Page
-
Month & KPI Group slicers
-
KPI cards showing Total KPIs, MTD Target Met, and MTD Target Missed
-
Detailed KPI table with MTD, YTD, Target vs Actual, and CY vs PY metrics
📍 KPI Trend Page
-
MTD trend combo chart
-
YTD trend combo chart
-
KPI selection slicer for deep-dive analysis
📍 KPI Definition Page
-
KPI formula and description
-
Measurement logic and KPI type (LTB / UTB)
-
Drill-through navigation for easy access
📁 Excel Data File (Input-Ready)
-
Input_Actual sheet
-
Input_Target sheet
-
KPI Definition sheet
🛠️ How to Use the Smart Cities Procurement KPI Dashboard in Power BI
📝 Step 1: Enter actual procurement values in the Excel Input_Actual sheet
🎯 Step 2: Enter target values in the Excel Input_Target sheet
📘 Step 3: Define KPIs and formulas in the KPI Definition sheet
🔄 Step 4: Refresh the Power BI report
📊 Step 5: Analyze procurement performance using visuals and slicers
Because the dashboard uses Excel as the data source, no complex integrations or advanced Power BI skills are required.
👥 Who Can Benefit from This Smart Cities Procurement KPI Dashboard in Power BI
🏛️ Smart City Authorities & Municipal Corporations
📦 Procurement & Purchasing Departments
📊 Urban Governance & Compliance Teams
🏗️ Project Monitoring Units
📉 Public Sector Consultants & Analysts
📑 Policy Makers & City Administrators
If your organization handles public procurement, vendor management, or smart city projects, this dashboard becomes an essential decision-support tool.
Click here to read the Detailed blog post
Visit our YouTube channel to learn step-by-step video tutorials
Watch the step-by-step video tutorial:


Reviews
There are no reviews yet.