
In the shipping and logistics industry, efficiency, visibility, and accuracy are everything. Late deliveries, rising costs, and customer complaints can quickly damage trust and profitability. Traditional tracking methods—like manual spreadsheets or scattered reports—often create more confusion than clarity.
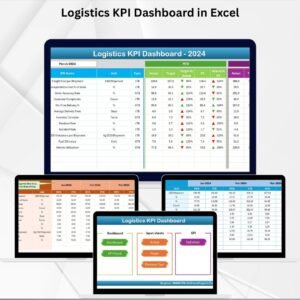
That’s why we created the Shipping KPI Dashboard in Excel—a professional, ready-to-use performance management tool that helps logistics managers, freight forwarders, and supply chain professionals track, analyze, and improve shipping performance with ease.
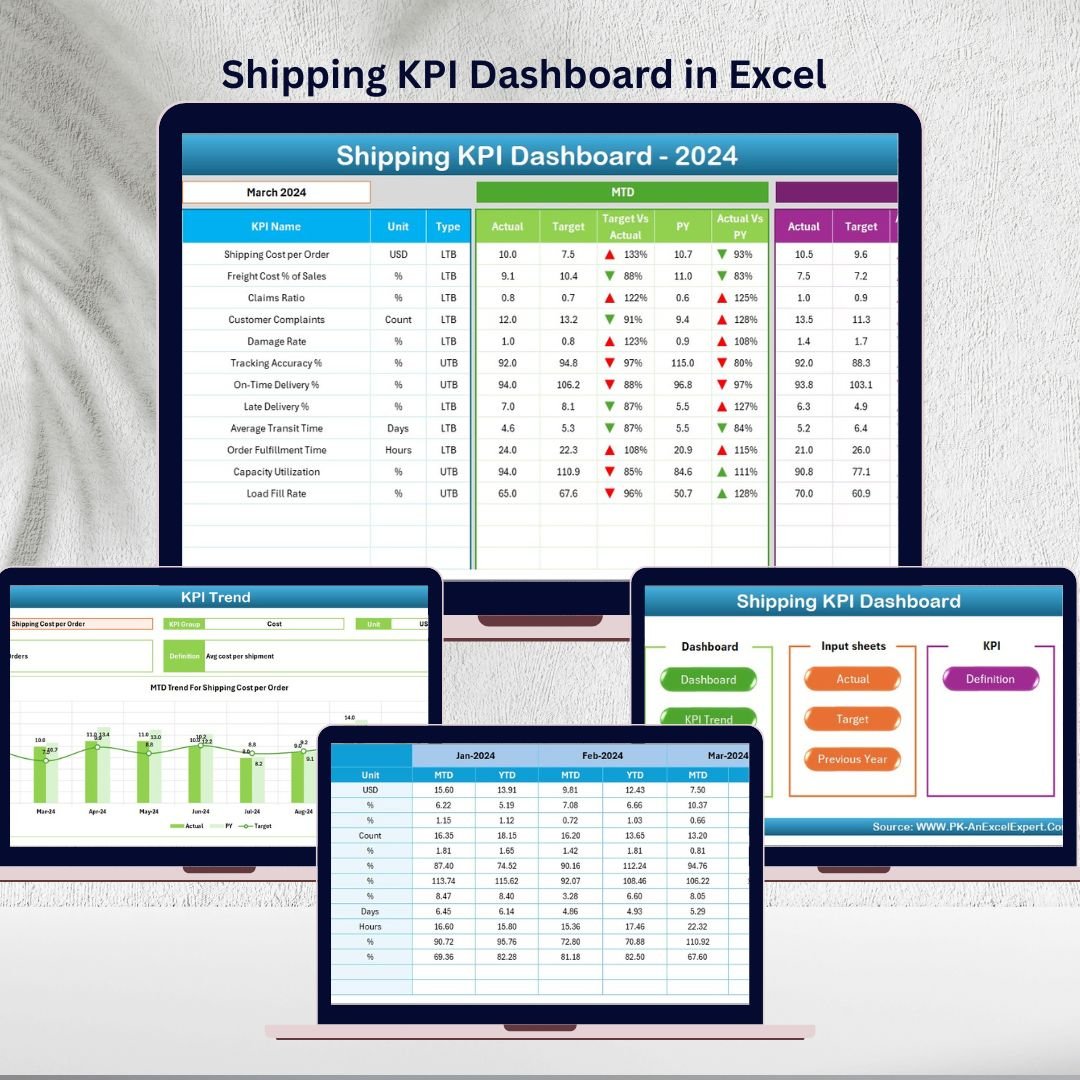
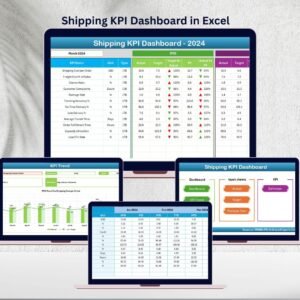
This Excel-based dashboard consolidates all shipping metrics into one structured platform. Instead of juggling multiple files, you get a single, interactive system that provides real-time insights, variance analysis, and historical comparisons. With built-in visuals, conditional formatting, and trend charts, it transforms raw shipping data into actionable intelligence.
✨ Key Features of the Shipping KPI Dashboard in Excel
-
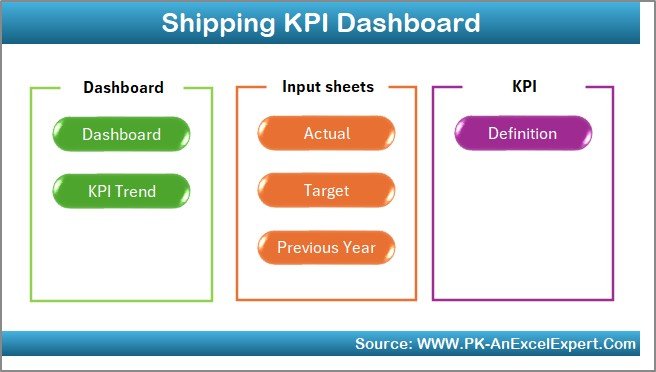
🏠 Home Sheet – Navigation hub with clickable buttons for smooth movement across all sheets.
-
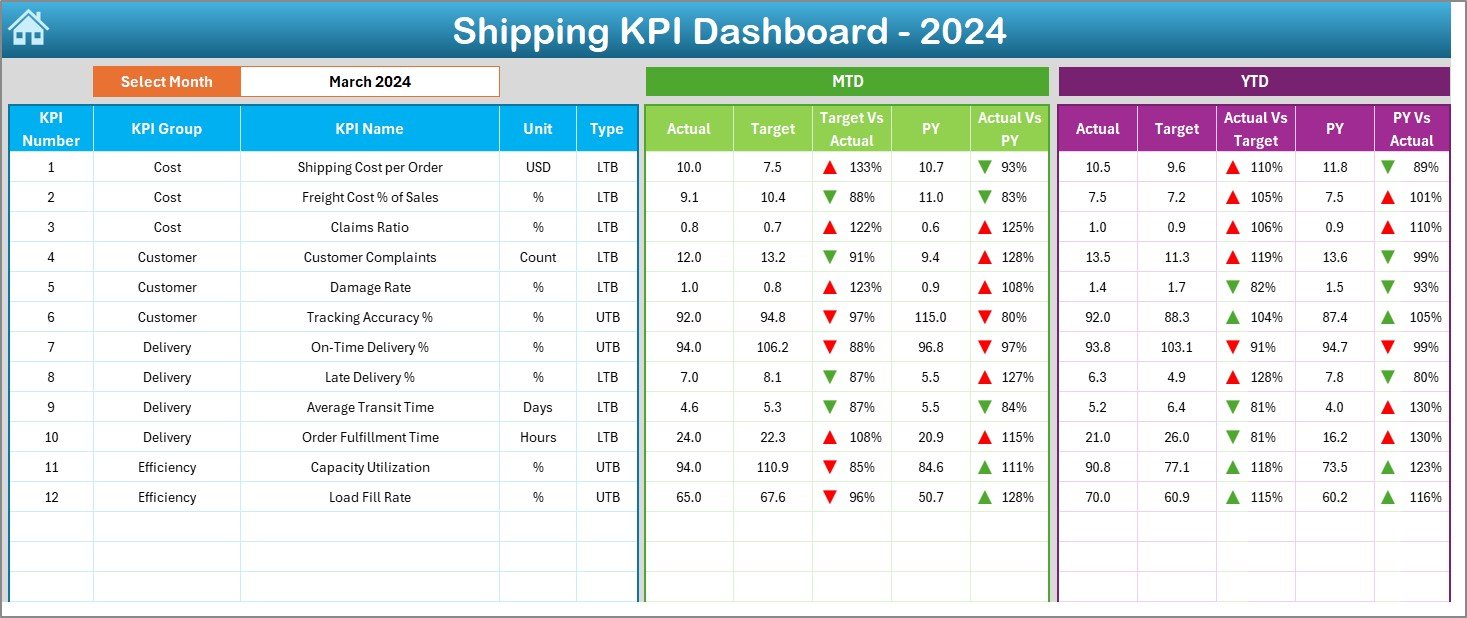
📊 Dashboard Tab – Central performance view showing MTD & YTD data, Actual vs Target, and Actual vs Previous Year comparisons with arrows.
-
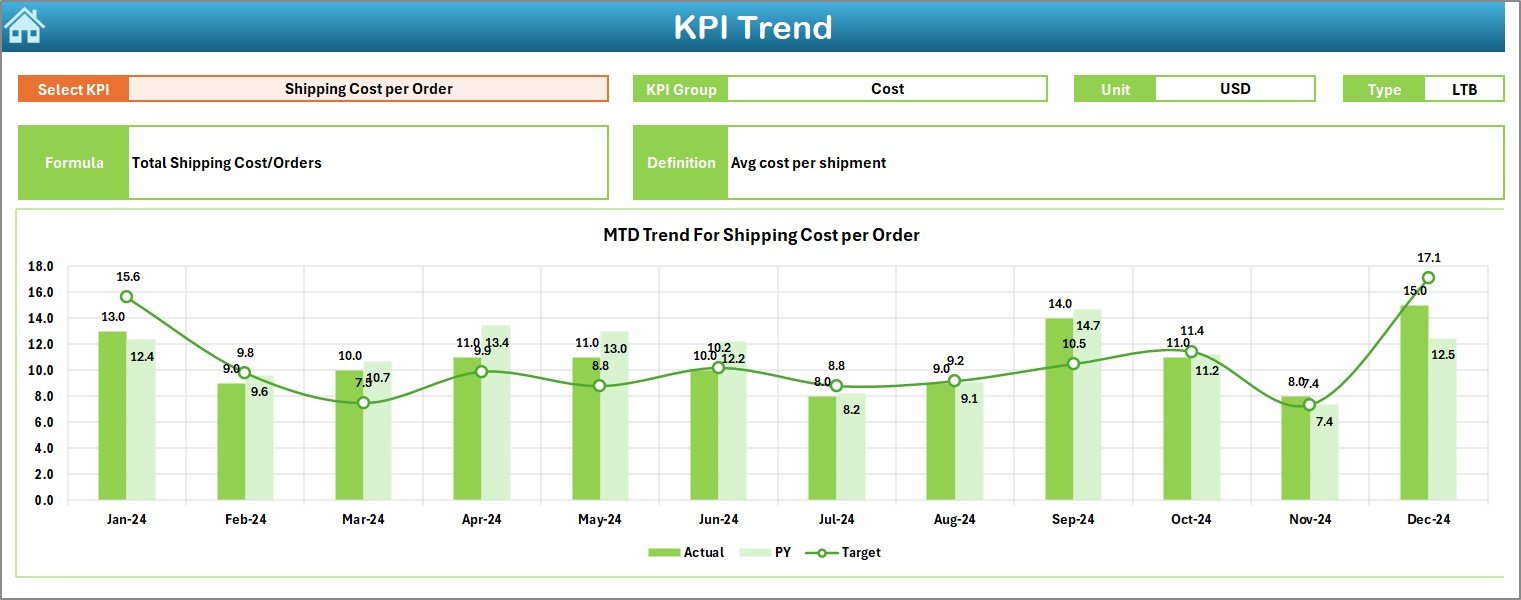
📈 KPI Trend Tab – Track individual KPIs over time with trend charts and definitions.
-
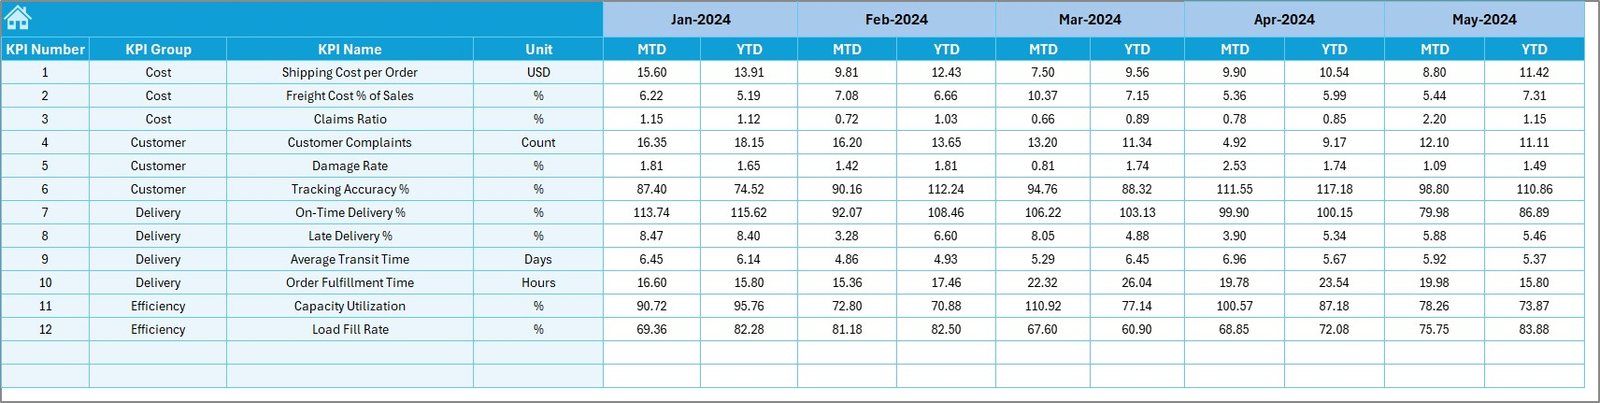
📥 Actual Numbers Input – Enter monthly data for shipping KPIs in one place.
-
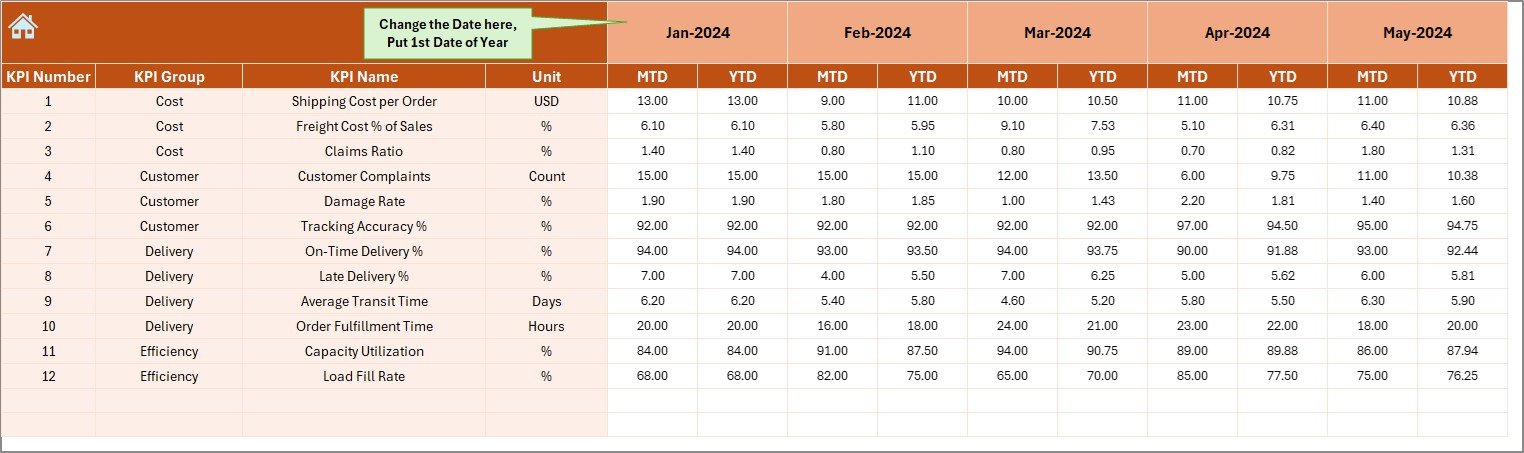
🎯 Target Sheet – Record planned MTD and YTD goals to measure against actual performance.
-
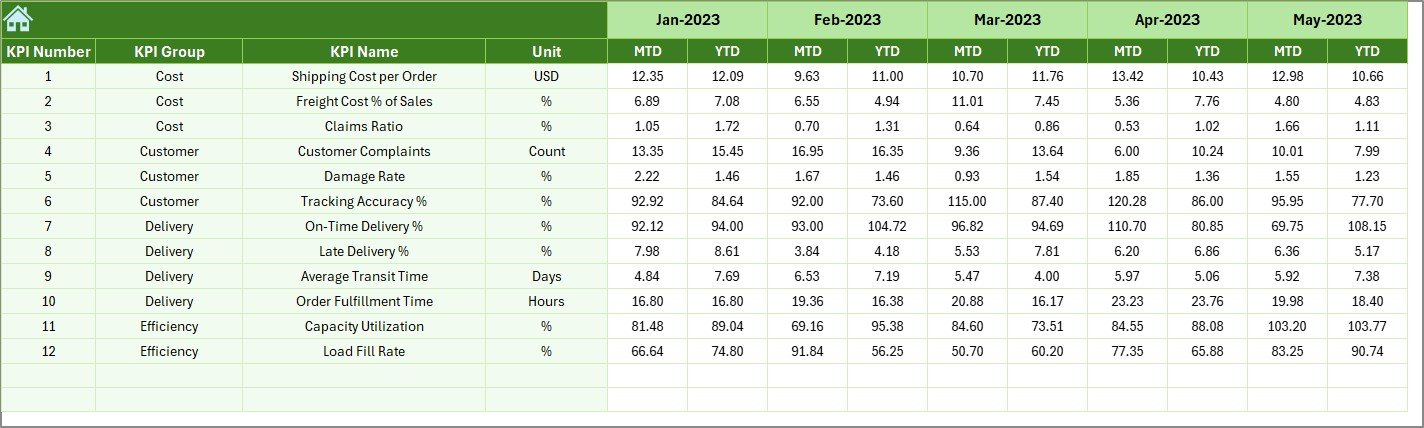
📂 Previous Year Data – Store historical results for easy comparison.
-
📖 KPI Definition Sheet – Reference all KPI names, formulas, units, and descriptions.
-
✅ Interactive Visuals – Arrows, variance analysis, and charts make interpretation quick and easy.
📂 What’s Inside the Dashboard
When you download the Shipping KPI Dashboard in Excel, you’ll get:
-
Home Sheet – Easy navigation with 6 quick-access buttons.
-
Dashboard Sheet – A high-level performance snapshot with conditional formatting.
-
KPI Trend Sheet – Deep dive into KPI behavior over time.
-
Actual Numbers Sheet – Enter monthly shipping data consistently.
-
Target Sheet – Define performance benchmarks.
-
Previous Year Numbers – Compare results with last year’s data.
-
KPI Definition Sheet – Clear documentation of each KPI’s formula, unit, and type (UTB/LTB).
🛠️ How to Use the Dashboard
-
Enter Actual Data – Input monthly shipping performance into the Actual Numbers sheet.
-
Set Targets – Record monthly and yearly goals in the Target sheet.
-
Review Dashboard – Use the Dashboard tab to monitor MTD & YTD performance.
-
Analyze Trends – Switch to the KPI Trend sheet for visual patterns.
-
Compare with Past – Leverage Previous Year Numbers for historical insights.
-
Take Action – Use the variance analysis and arrows to spot issues and make improvements.
👥 Who Can Benefit from This Dashboard
-
Logistics Managers – Monitor delivery performance and cost efficiency.
-
Supply Chain Analysts – Gain insights into bottlenecks and improvements.
-
E-commerce Businesses – Track on-time delivery and customer complaint rates.
-
Freight Forwarders – Manage transit times and freight claims.
-
Manufacturers & Retailers – Control shipping costs and ensure customer satisfaction.
Whether you’re running global shipping operations or managing a local logistics business, this dashboard helps you stay competitive with data-driven decision-making.


Reviews
There are no reviews yet.