
A well-managed logistics operation requires speed, accuracy, and complete visibility. But with hundreds of shipments, container movements, documents, and fleet activities happening every single day, manual tracking becomes impossible. That’s where the Shipping & Cargo KPI Dashboard in Power BI becomes your most powerful performance-tracking tool. This ready-to-use dashboard transforms Excel data into clean visual reports, helping logistics teams track key performance indicators with clarity, confidence, and speed.
Designed for shipping companies, cargo handlers, warehouses, freight forwarders, and logistics teams, this dashboard delivers real-time insights that improve decisions, reduce delays, control costs, and boost customer satisfaction. Whether your team manages vessel schedules, cargo movements, loading/unloading, storage, documentation, or customer service performance—this dashboard helps you monitor every KPI in one place.
🚀 Key Features of the Shipping & Cargo KPI Dashboard in Power BI
This powerful dashboard is packed with features that simplify logistics reporting and boost productivity:
⭐ ✔ Real-Time KPI Monitoring
Track Month-to-Date (MTD), Year-to-Date (YTD), Target, and Previous Year (PY) values instantly.
📊 ✔ Interactive Filters & Slicers
Filter data by Month and KPI Group to view performance from any angle.
📌 ✔ Smart KPI Cards
View total KPIs, how many targets are met, and how many are missed—right at the top.
📈 ✔ Detailed KPI Table
Analyze all metrics with fields like KPI number, group, unit, type (LTB/UTB), targets, trends, and status icons (▲▼).
🔁 ✔ Drill-Through KPI Definitions
Right-click any KPI to understand its formula, definition, type, and usage on a dedicated drill-through page.
📉 ✔ Monthly Trend Charts
Understand if performance is improving or dropping across MTD and YTD trends.
⚡ ✔ Fast & Refreshable
Connected to Excel sources, the dashboard refreshes with one click—no manual reporting needed.
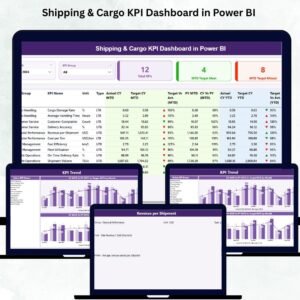
📦 What’s Inside the Shipping & Cargo KPI Dashboard
When you download this product, you get a complete and structured dashboard environment built for professional reporting:
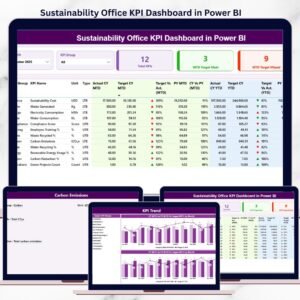
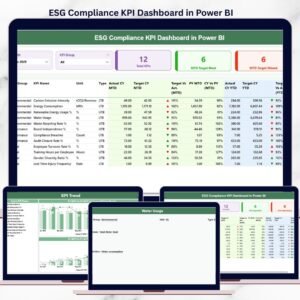
🗂 1. Summary Page
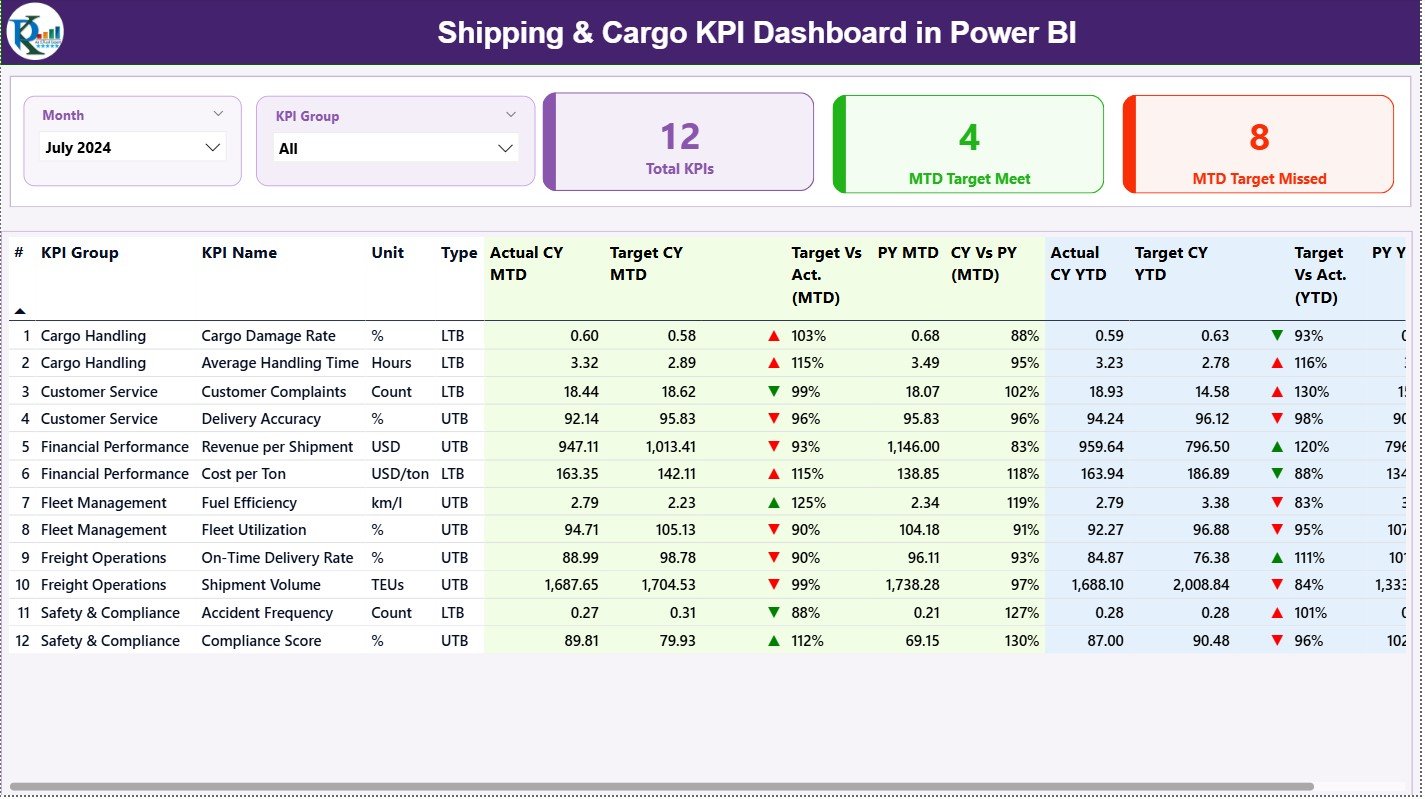
✔ Month slicer
✔ KPI group filter
✔ KPI cards (Total KPIs, MTD Meet, MTD Missed)
✔ Detailed KPI performance table
✔ Actual vs Target comparisons
✔ Current vs Previous Year analytics
✔ Automatic green/red indicators for KPI status
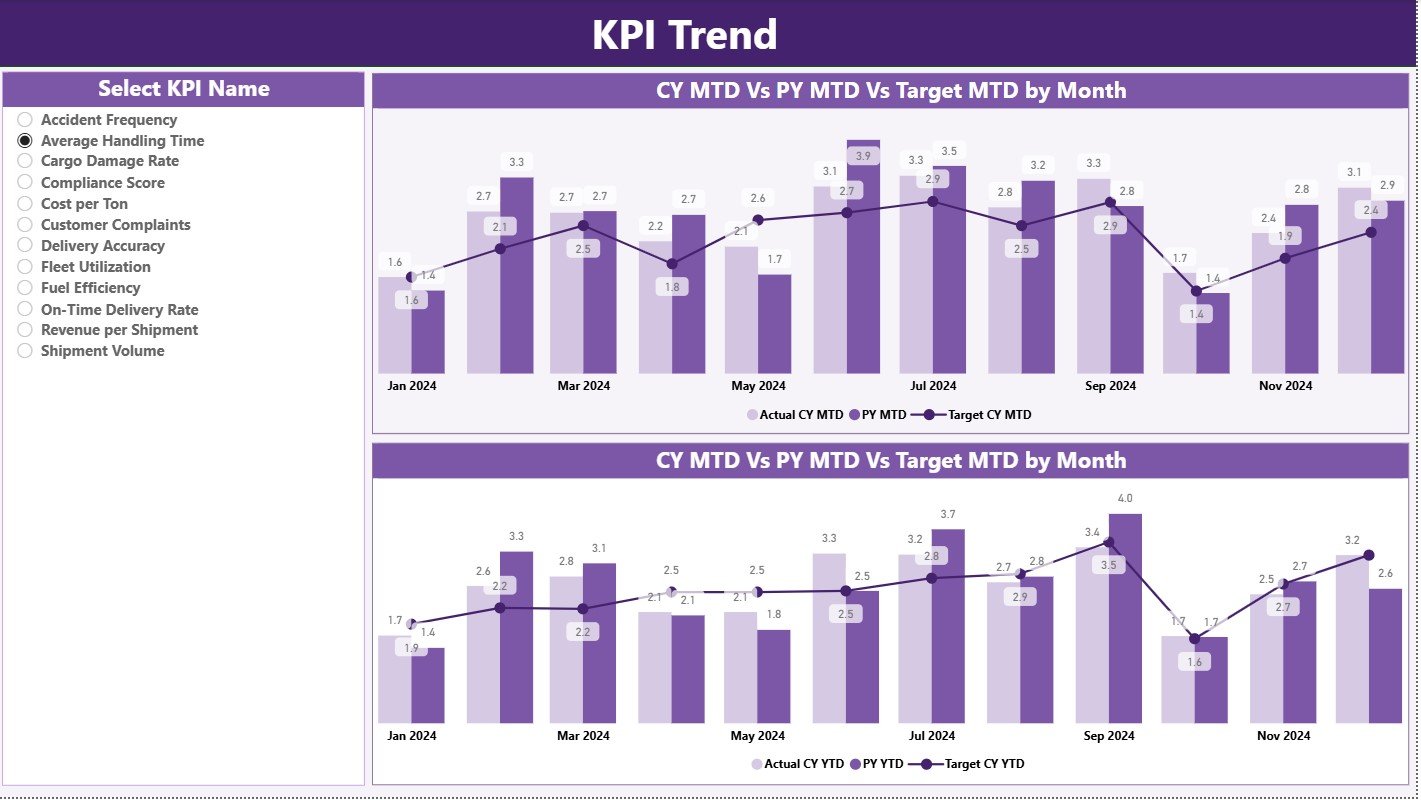
📉 2. KPI Trend Page
✔ KPI selector
✔ Monthly trend charts (Actual CY, Actual PY, Target)
✔ MTD and YTD combo charts
✔ Trend comparison visuals
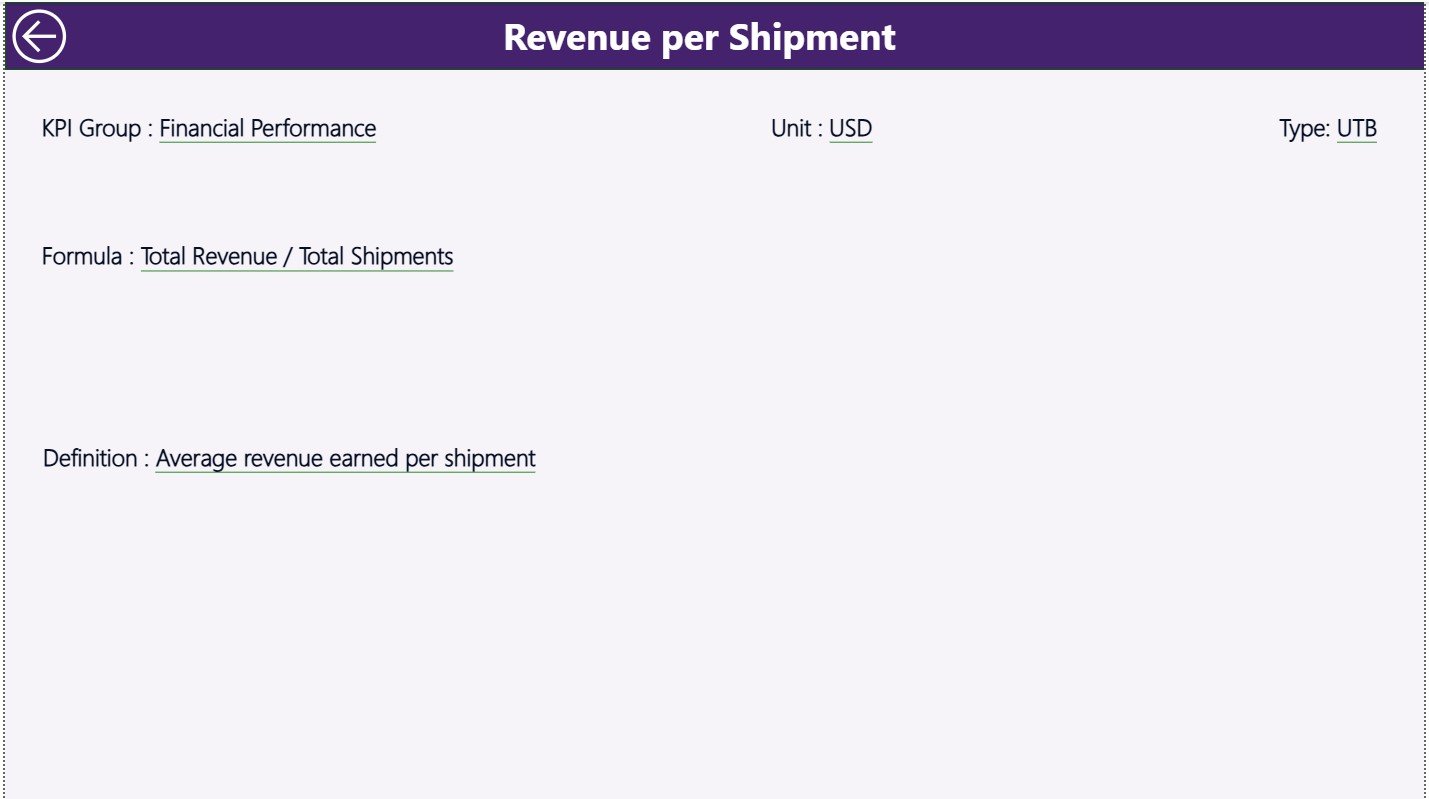
📘 3. KPI Definition Page (Drill-through)
✔ KPI number, name, group, and unit
✔ Formula and KPI definition
✔ KPI type (UTB or LTB)
✔ Back button to return to the dashboard
📁 Excel Data Templates Included
✔ Input_Actual Sheet
✔ Input_Target Sheet
✔ KPI Definition Sheet
Just fill these sheets and refresh Power BI—your dashboard updates instantly.
🧭 How to Use the Shipping & Cargo KPI Dashboard
Using this dashboard is extremely simple, even for beginners:
🔹 Step 1: Fill the Excel Sheets
Enter your monthly Actual, Target, and KPI definition data.
🔹 Step 2: Load Data into Power BI
Open the dashboard file and click Refresh.
🔹 Step 3: Explore KPIs Using Slicers
Use the month and KPI group slicers for instant filtering.
🔹 Step 4: Analyze Trends
Visit the Trend page to understand performance patterns.
🔹 Step 5: Drill Through for Details
Right-click any KPI in the summary table to view its definition.
🔹 Step 6: Use the Insights to Improve Performance
Track delays, improve shipping accuracy, reduce cargo damage, and optimize fleet operations.
👥 Who Can Benefit from This Dashboard
This product is ideal for:
🚢 • Shipping Companies
To track vessel schedules, loading/unloading efficiency, and on-time delivery.
📦 • Cargo Handlers & Warehouses
To monitor cargo safety, damage percentage, storage efficiency, and staff performance.
🚛 • Logistics & Supply Chain Teams
To compare actual vs target KPIs daily, weekly, and monthly.
🏭 • Manufacturers & Exporters
To track freight movement, cost per shipment, and container utilization.
🧑💼 • Operations & Performance Managers
To measure department-wise KPIs in a structured, visual format.
This dashboard makes reporting simpler, faster, and more accurate for every logistics professional.


Reviews
There are no reviews yet.