


The Server Uptime KPI Dashboard in Excel is a powerful and easy-to-use tool designed to help IT teams, system administrators, and business owners track and optimize the uptime performance of their servers. This Excel-based dashboard allows you to monitor key performance indicators (KPIs) such as server availability, downtime, and uptime percentage in real time, providing valuable insights into server performance and reliability.
Server uptime is crucial for maintaining business operations and ensuring that customers and employees can access critical services without interruption. With this tracker, you can stay on top of server performance, identify potential issues before they become critical, and optimize your IT infrastructure to ensure seamless operations.
Key Features of the Server Uptime KPI Dashboard in Excel
📊 Uptime & Downtime Tracking
Monitor the uptime and downtime of your servers in real time. This feature tracks when the server is up and running, as well as when it’s experiencing downtime, ensuring you stay informed about server health.
🔧 Real-Time Performance Monitoring
Get up-to-date data on server performance, including uptime percentage, downtime duration, and maintenance schedules. This real-time monitoring helps identify and resolve issues promptly.
📉 Downtime Analysis & Reporting
Track downtime duration, analyze its causes, and generate detailed reports to assess the impact on business operations. Identify trends in server performance and implement corrective measures to improve uptime.
📅 Maintenance & Scheduled Downtime Tracking
Monitor scheduled server maintenance and updates to ensure that downtime is planned and communicated effectively. This helps prevent unexpected disruptions during critical business hours.
⚙️ Customizable & Scalable
Tailor the dashboard to meet your specific needs, whether you’re tracking multiple servers or focusing on a single server’s performance. The dashboard is customizable to scale with your IT infrastructure.
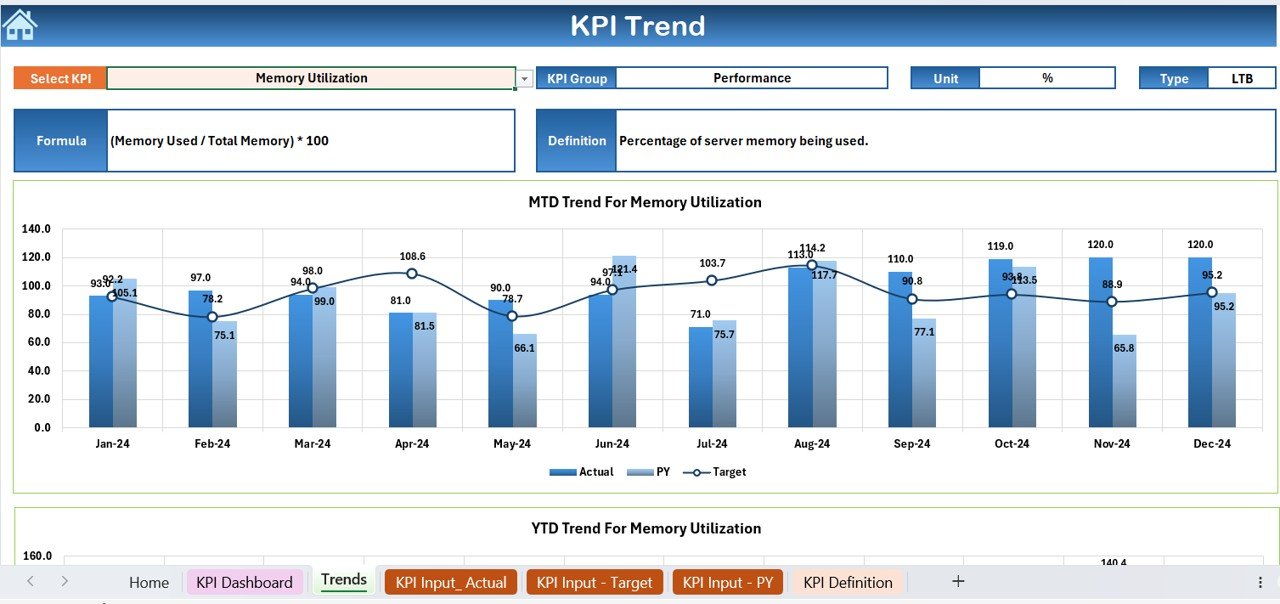
📈 Data Visualization & Insights
Visualize your server performance through easy-to-understand graphs and charts. Track key metrics such as uptime percentage and downtime trends over different time periods.
Why You’ll Love the Server Uptime KPI Dashboard in Excel

✅ Track Server Health & Performance
Monitor the availability and reliability of your servers in real time. Track performance metrics such as uptime percentage and downtime duration to ensure that servers are operating smoothly.
✅ Reduce Unplanned Downtime
Identify patterns in downtime and take proactive measures to prevent unplanned outages, improving overall server performance and reliability.
✅ Enhance IT Efficiency
Optimize server maintenance schedules and improve efficiency by tracking downtime, performance trends, and maintenance windows effectively.
✅ Improve Communication & Planning
Use the dashboard to communicate downtime and performance metrics with team members, stakeholders, and decision-makers. Plan better for scheduled downtime and maintenance.
✅ Customizable for Any Server Setup
Whether you’re managing a single server or a complex network, the dashboard is flexible and can be adjusted to your specific needs, ensuring it meets the requirements of your IT infrastructure.
What’s Inside the Server Uptime KPI Dashboard in Excel?
-
Uptime & Downtime Tracking: Track server uptime and downtime in real time.
-
Real-Time Performance Monitoring: Monitor server performance and availability.
-
Downtime Analysis & Reporting: Analyze downtime causes and impacts.
-
Maintenance & Scheduled Downtime Tracking: Track planned downtime and maintenance.
-
Customizable Features: Adjust the dashboard for multiple servers or other specific requirements.
-
Data Visualization: View key metrics such as uptime percentage and downtime duration with charts and graphs.
How to Use the Server Uptime KPI Dashboard in Excel
1️⃣ Download the Template: Instantly access the Server Uptime KPI Dashboard in Excel.
2️⃣ Input Server Data: Enter the uptime and downtime data for your servers.
3️⃣ Monitor Server Performance: Track uptime, downtime, and scheduled maintenance in real time.
4️⃣ Generate Reports: Analyze downtime trends, causes, and impacts through detailed reports.
5️⃣ Optimize Server Efficiency: Use the insights from the dashboard to improve server performance and reduce downtime.
Who Can Benefit from the Server Uptime KPI Dashboard in Excel?
🔹 IT Teams & System Administrators
🔹 Server Managers & Engineers
🔹 Network Operations Centers (NOCs)
🔹 Business Owners & Decision Makers
🔹 Enterprises with Complex IT Infrastructures
🔹 Small & Medium-Sized Businesses (SMBs)
🔹 Organizations Focused on Operational Efficiency
Ensure that your servers are running smoothly with the Server Uptime KPI Dashboard in Excel. Track uptime, downtime, maintenance, and performance in real time, and make informed decisions to optimize server efficiency.
Click here to read the Detailed blog post
Visit our YouTube channel to learn step-by-step video tutorials
Youtube.com/@PKAnExcelExpert


Reviews
There are no reviews yet.