Managing seed and fertilizer operations requires speed, accuracy, and seamless coordination across production, quality, procurement, packaging, and dispatch teams. Yet most manufacturing plants still rely on scattered spreadsheets and manual reports that slow down performance. The Seed & Fertilizer Manufacturing KPI Dashboard in Excel solves these challenges instantly. It brings all operational KPIs into one smart, automated dashboard—helping teams monitor production output, quality trends, wastage levels, cost efficiency, and year-over-year performance with a single click.
This ready-to-use Excel dashboard turns raw operational data into clear, actionable insights. Whether you want to track germination rates, blending accuracy, batch yield, cycle time, or packaging output, this dashboard visualizes everything in real-time. With automated charts, structured KPI definitions, target comparisons, conditional formatting arrows, and drop-down selectors, it becomes the simplest and most powerful analytics tool for modern seed and fertilizer manufacturing units.
🌟 Key Features of the Seed & Fertilizer Manufacturing KPI Dashboard in Excel
This dashboard is designed for complete operational intelligence. Every sheet plays a unique role in providing accurate and transparent reporting:
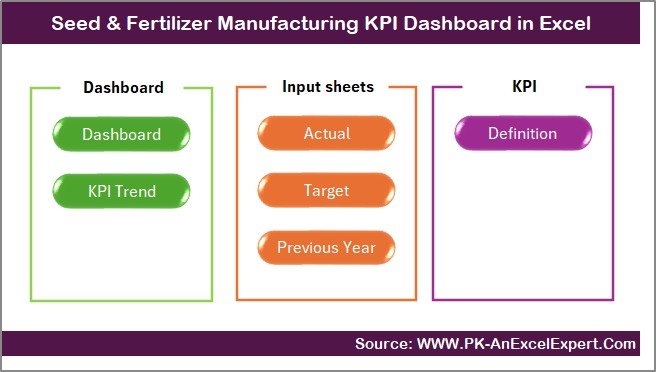
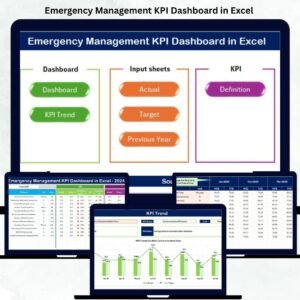
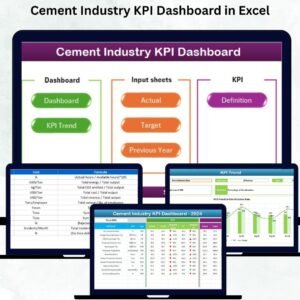
📌 1. Summary Page – One-Click Navigation
A user-friendly index page with pre-built buttons that take you instantly to any worksheet. Perfect for plant heads, shift managers, and quality teams who need quick access.
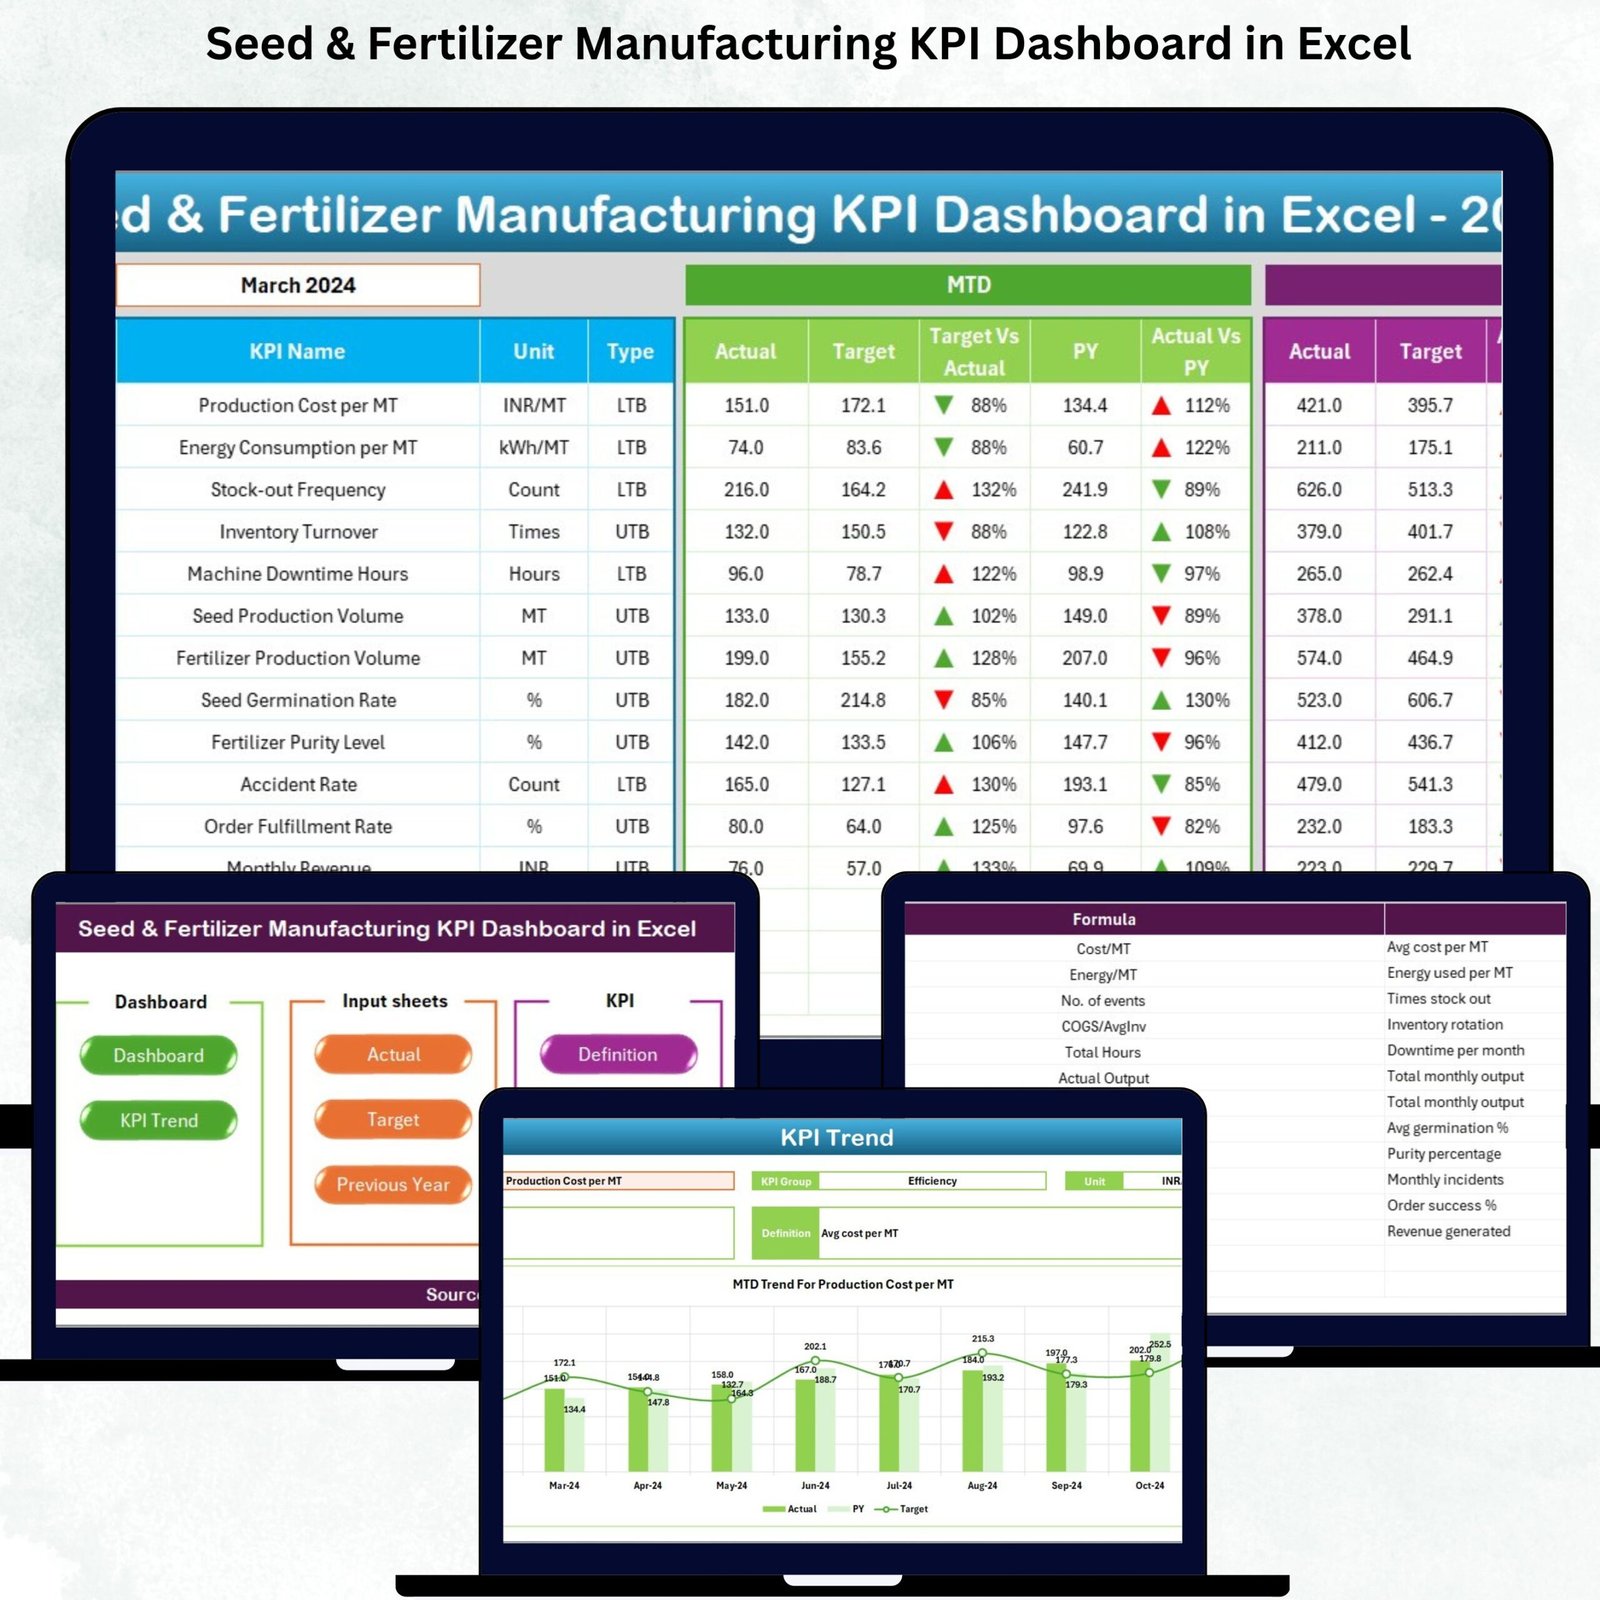
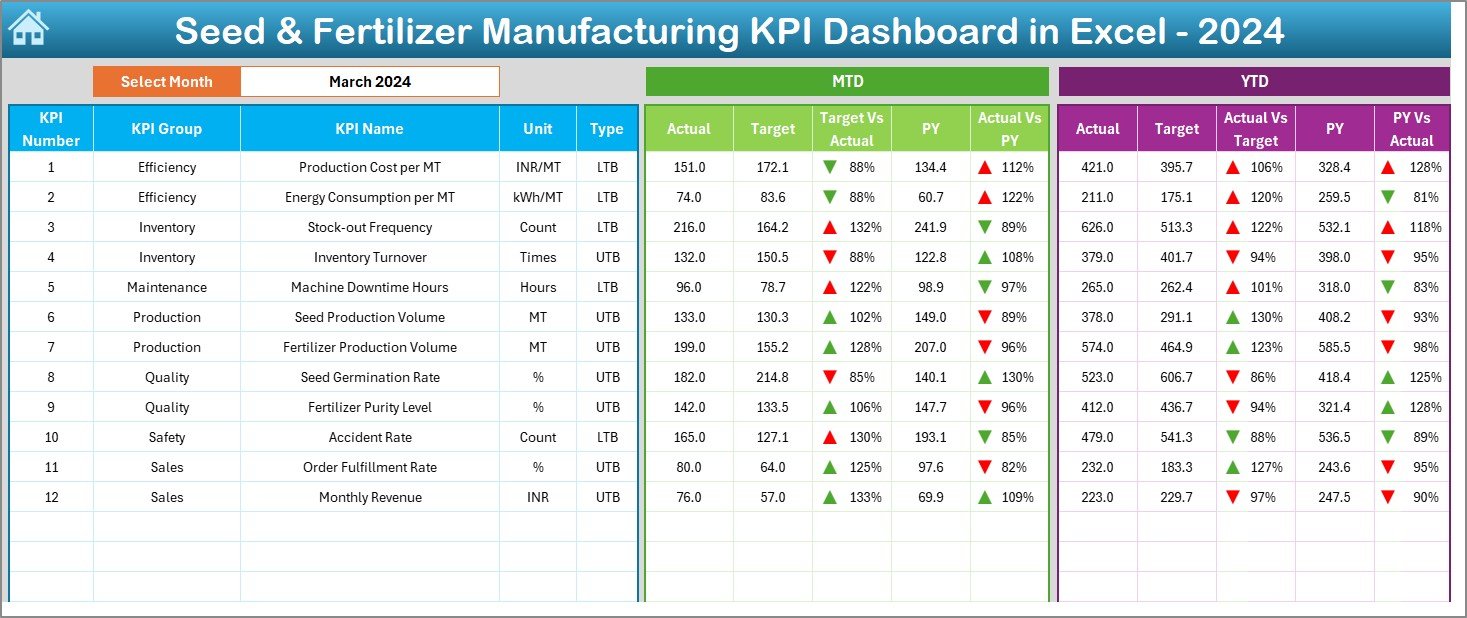
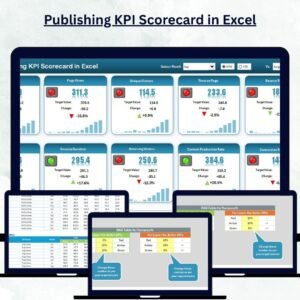
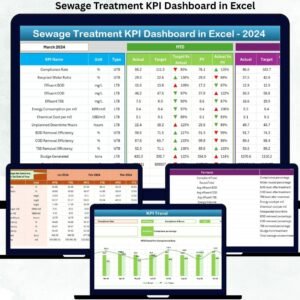
📌 2. Dashboard Page – Complete KPI Overview
The heart of the tool where all KPIs display in one place.
✔ Month selector for instant period switch
✔ MTD & YTD Actual vs Target vs Previous Year
✔ Automated arrows to show improvement or decline
✔ Clean visuals for quick decision-making
This page highlights production efficiency, batch yield, raw material usage, wastage trends, quality performance, and dispatch accuracy—everything a manufacturing leader needs to monitor.
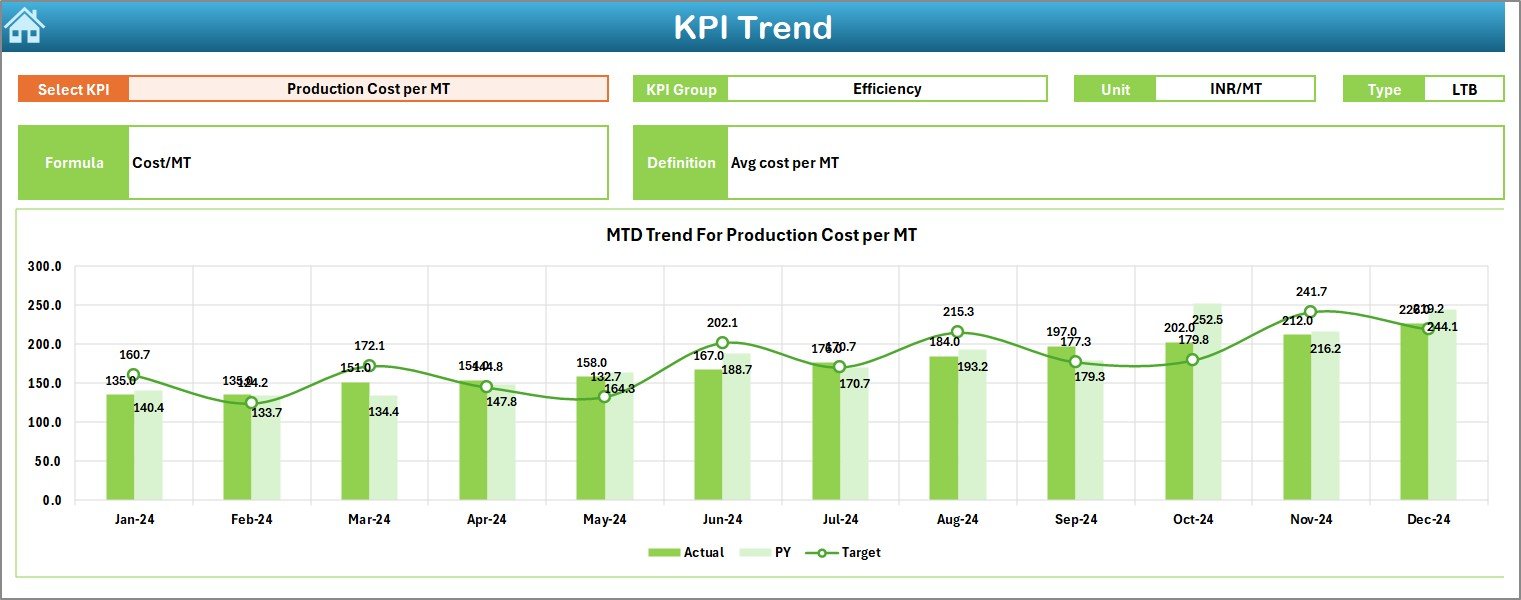
📌 3. Trend Page – KPI-Wise Performance Movement
✔ Select any KPI
✔ View its formula, definition, group, and type (UTB/LTB)
✔ Analyze long-term MTD & YTD patterns
✔ Predict seasonal demand and production behaviour
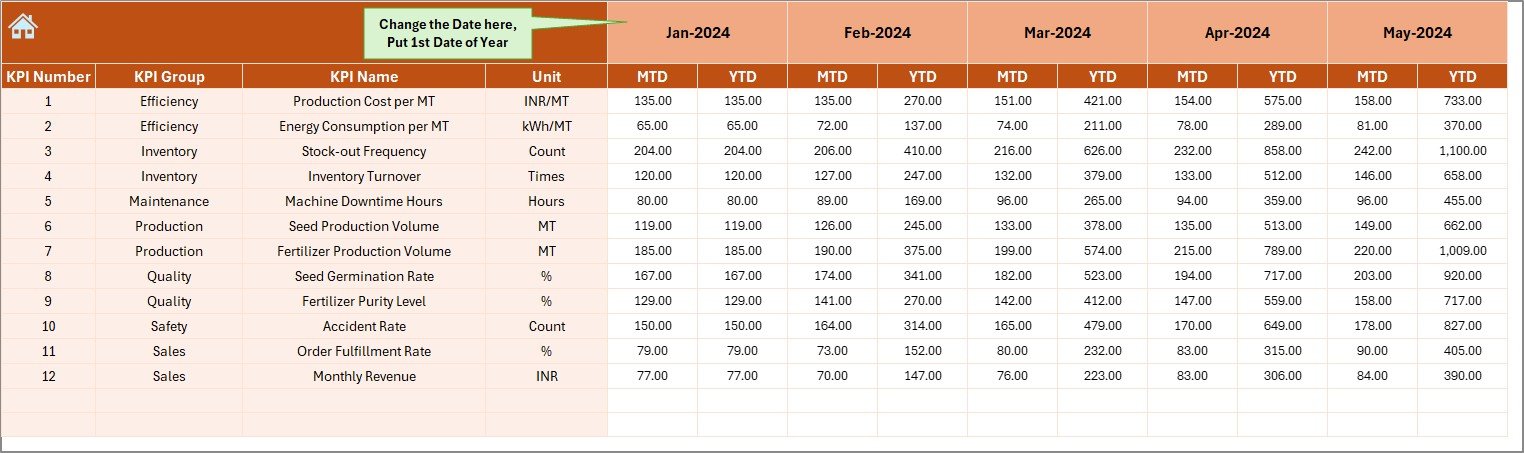
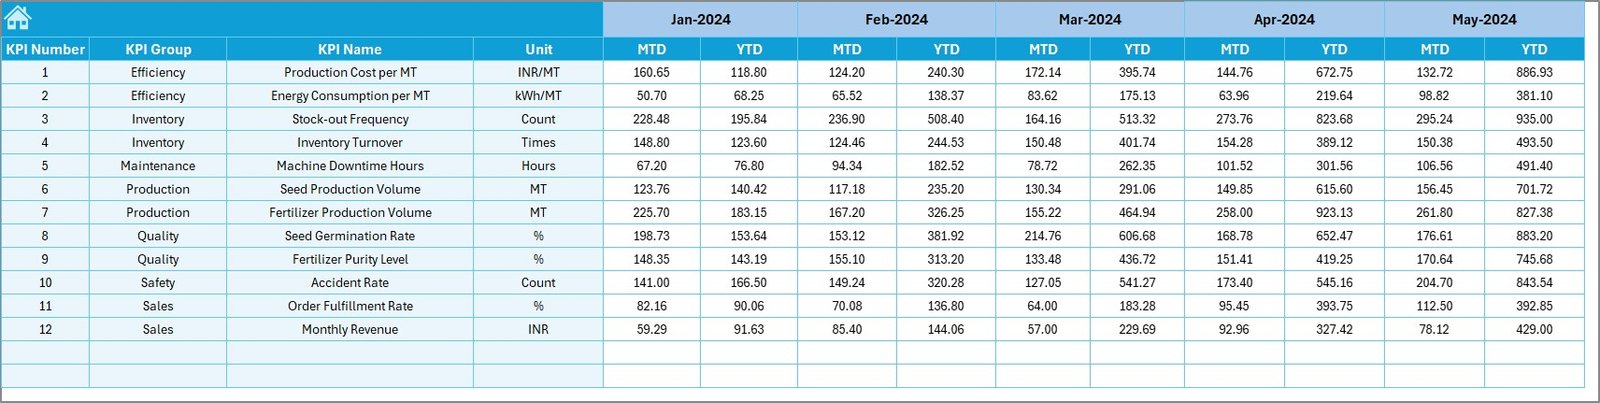
📌 4. Actual Numbers Entry Sheet
Easy-to-update layout for monthly MTD and YTD numbers. Change the financial-year start once, and the whole dashboard adjusts automatically.
📌 5. Target Sheet
Enter monthly and yearly targets for every KPI. Helps leadership evaluate variances and improvement areas.
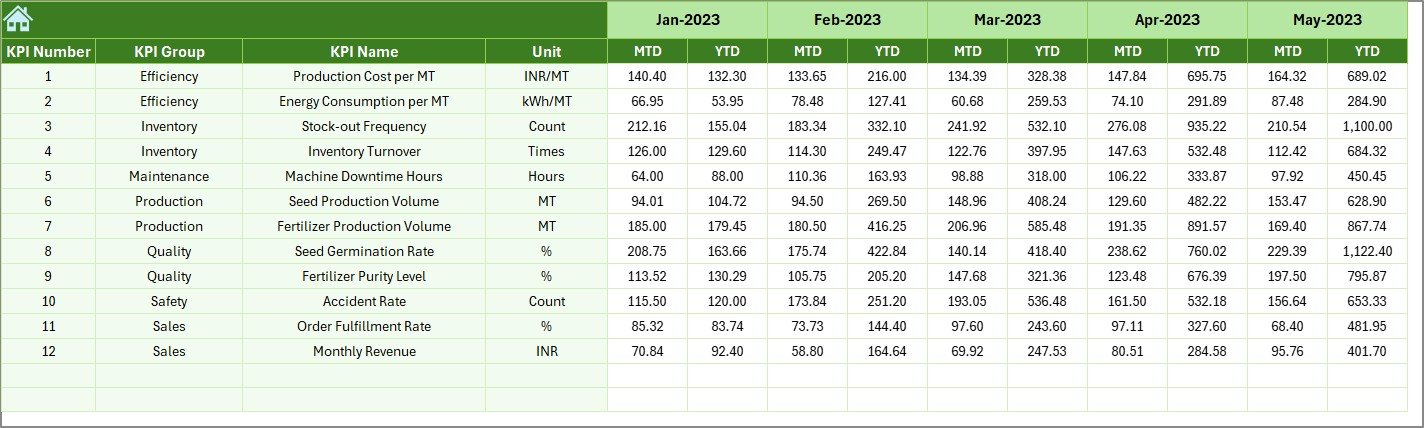
📌 6. Previous Year Input Sheet
Supports year-over-year comparison. Perfect for understanding growth, efficiency improvements, or quality decline.
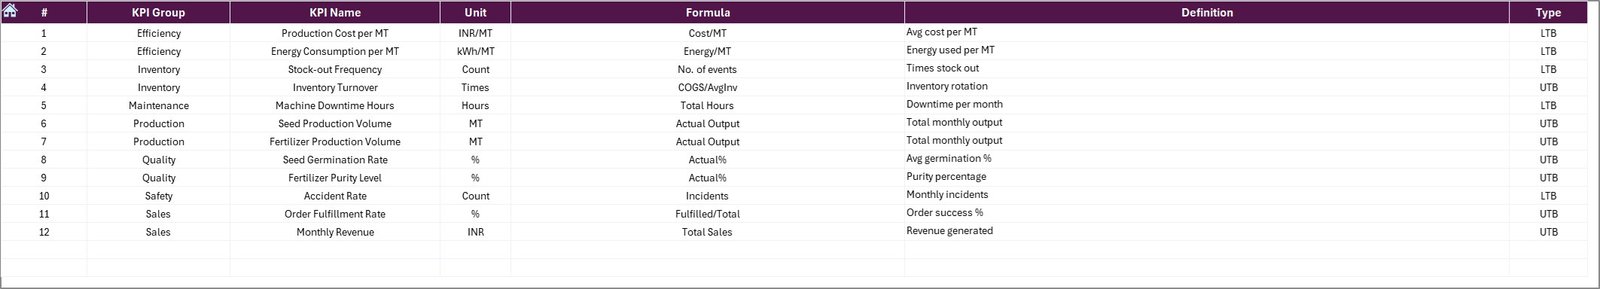
📌 7. KPI Definition Sheet
A centralized place containing:
✔ KPI Name
✔ KPI Group
✔ Unit
✔ Formula
✔ KPI Type (LTB/UTB)
✔ Clear definitions
This ensures consistency across all teams.
📦 What’s Inside the Seed & Fertilizer Manufacturing KPI Dashboard in Excel
When you download the product, you get:
✨ A fully automated Excel dashboard
✨ 7 professionally designed worksheets
✨ Standardized KPI definitions
✨ Ready-to-edit Actual, Target, and PY sheets
✨ Month selector & automated visuals
✨ Trend charts and variance indicators
✨ No coding required—100% Excel-based
Everything is pre-built so you can plug in your monthly numbers and start using the dashboard instantly.
🛠️ How to Use the Seed & Fertilizer Manufacturing KPI Dashboard in Excel
Using this dashboard is as simple as updating three sheets monthly:
1️⃣ Enter Actual MTD & YTD values
2️⃣ Update monthly Targets
3️⃣ Refresh Previous Year numbers once
After updating, the dashboard automatically displays:
✔ Performance variances
✔ Up/down trends
✔ Production gaps
✔ Quality improvements
✔ Monthly vs yearly comparisons
No formulas to adjust. No technical skills required.
👥 Who Can Benefit from This Seed & Fertilizer Manufacturing KPI Dashboard?
This tool is ideal for:
🌾 Seed processing plants
🧪 Fertilizer blending & mixing plants
🏭 Production supervisors & shift managers
📈 Quality assurance teams
🚛 Logistics & dispatch departments
📦 Packaging units
💼 Senior leadership & plant directors
Whether you’re tracking daily operations or preparing your monthly review deck, this dashboard simplifies everything.
📘 Click here to read the Detailed Blog Post
Watch the step-by-step video tutorial:


Reviews
There are no reviews yet.