
In a world where data breaches and cyber threats are rising daily, businesses can’t afford to rely on guesswork when it comes to security. The Security KPI Dashboard in Excel gives you the clarity and control your organization needs to stay one step ahead.
This ready-to-use Excel dashboard consolidates all your security performance metrics — from incident response times to policy compliance rates — into a single, visual, and interactive report. Designed for IT professionals, compliance officers, and business leaders, it helps track, analyze, and improve your organization’s security performance — all within the familiar environment of Microsoft Excel.
⚙️ Key Features of the Security KPI Dashboard in Excel
💡 Comprehensive Monitoring: Track cybersecurity, physical security, and compliance KPIs in one place.
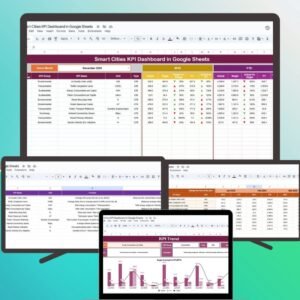
📊 Dynamic Dashboard View: Interactive slicers and dropdowns let you instantly switch between months or KPIs.
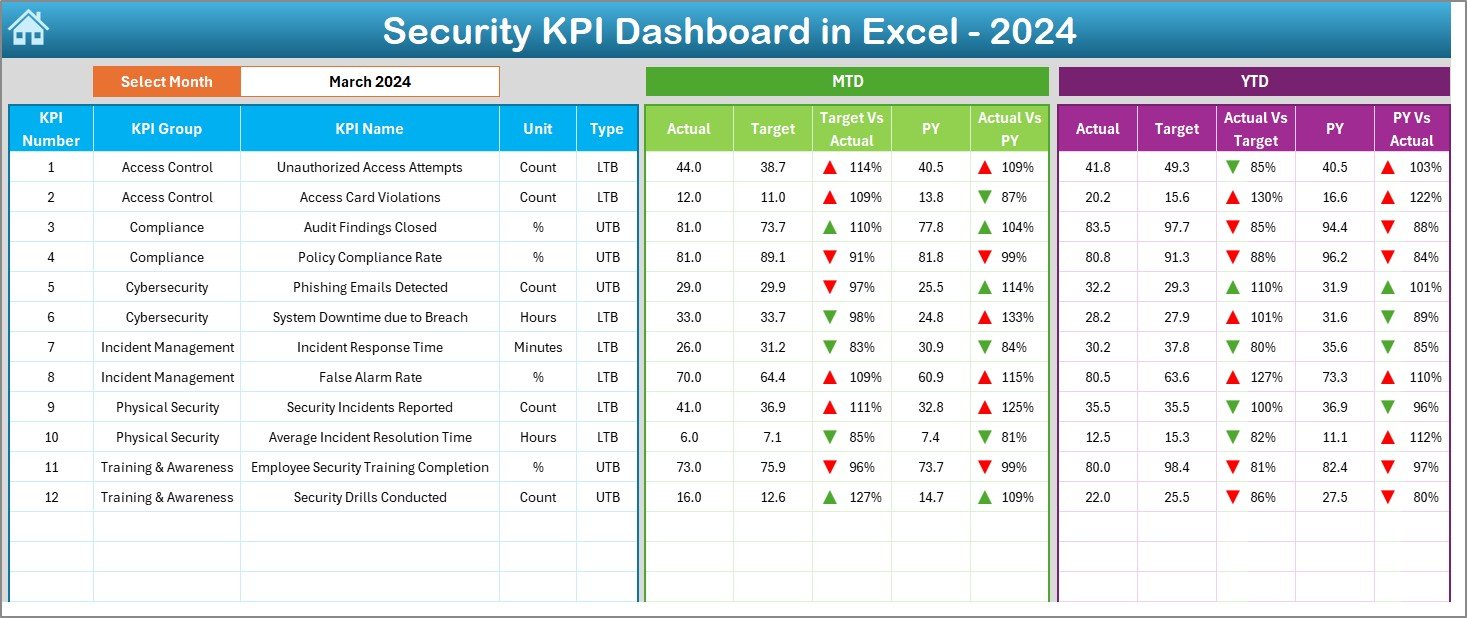
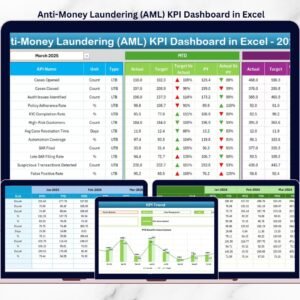
🎯 MTD & YTD Analysis: Instantly compare Month-to-Date and Year-to-Date performance with conditional arrows and color-coded visuals.
📈 Historical Data Comparison: Easily measure current progress against the previous year’s results to identify improvement trends.
🔐 Target vs Actual Insights: Clearly see how your team is performing against set benchmarks.
🧭 Simple Navigation: A clean home page with quick-access buttons takes you directly to each key section.
💬 Fully Customizable: Add, edit, or remove KPIs and adapt the dashboard for your organization’s specific needs.
💰 Cost-Effective Solution: Built entirely in Excel — no extra software or subscriptions required.
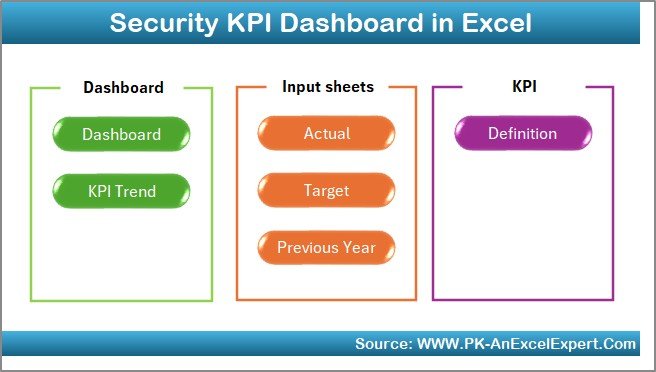
📘 What’s Inside the Security KPI Dashboard in Excel
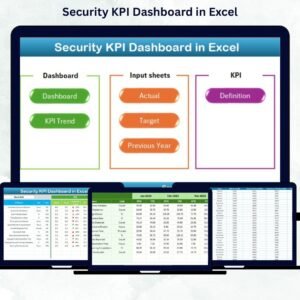
📍 Home Sheet: A smart control hub with navigation buttons for Dashboard, KPI Trend, Target, and Data Entry sheets.
📍 Dashboard Sheet: The main visual interface — shows MTD, YTD, and comparison charts for Actual vs Target and Actual vs Previous Year.
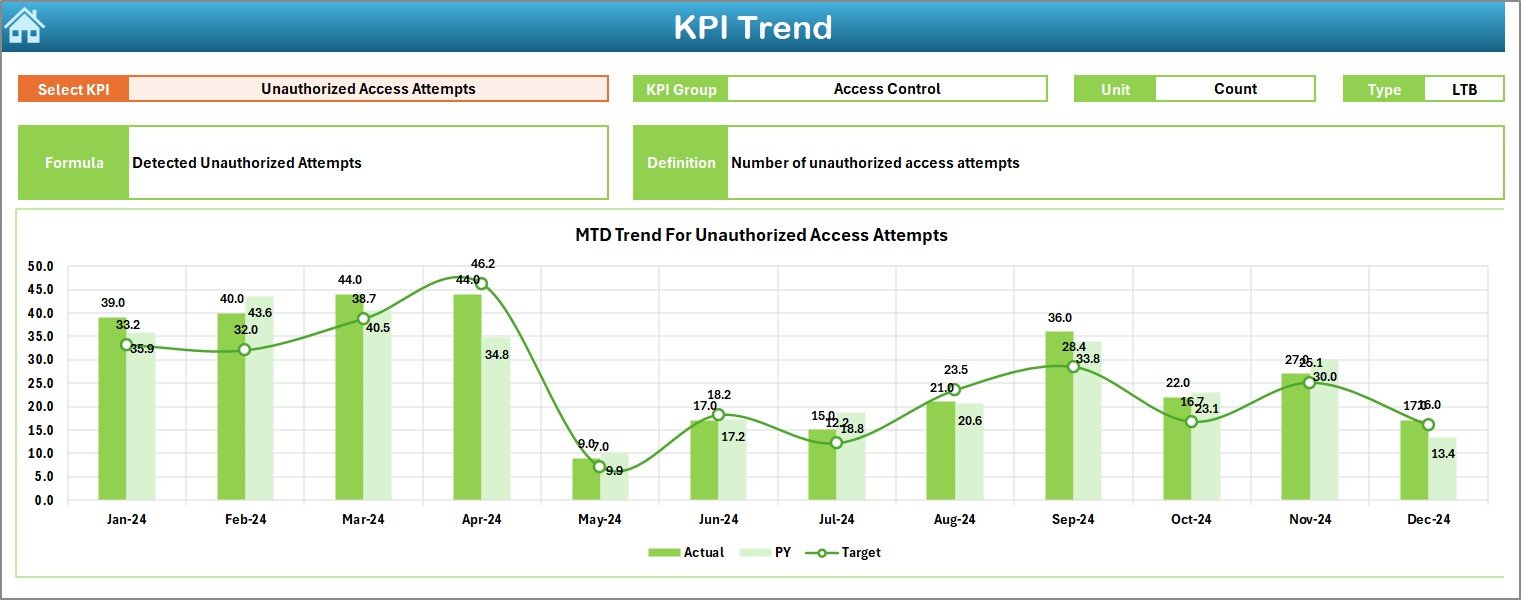
📍 KPI Trend Sheet: Choose any KPI from a dropdown and explore trend charts, formula, type (UTB/LTB), and definition in one view.
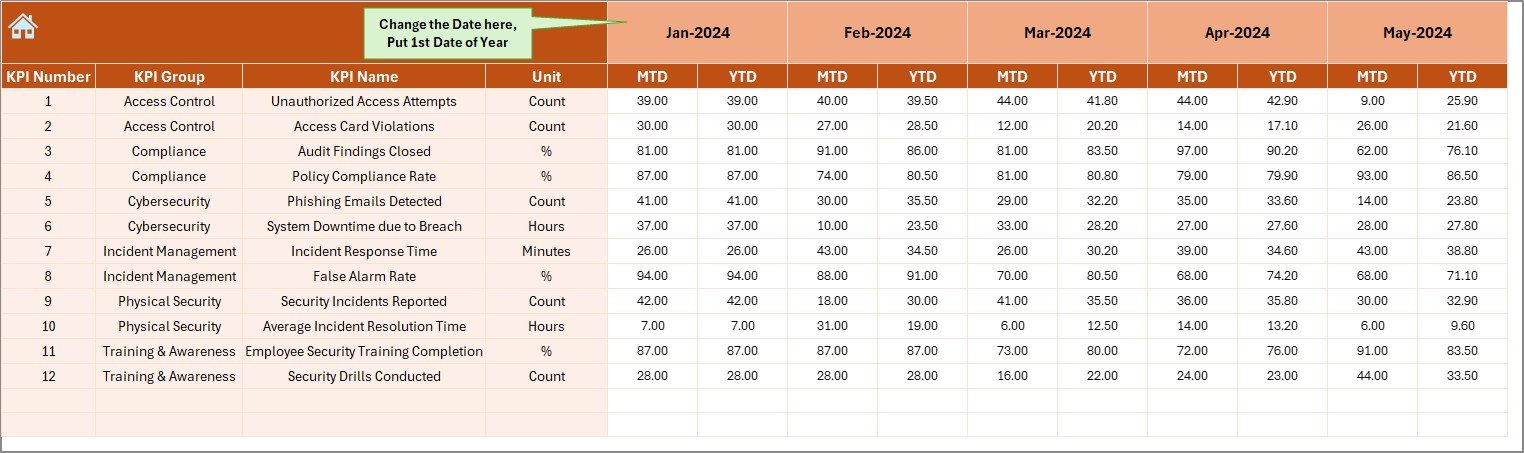
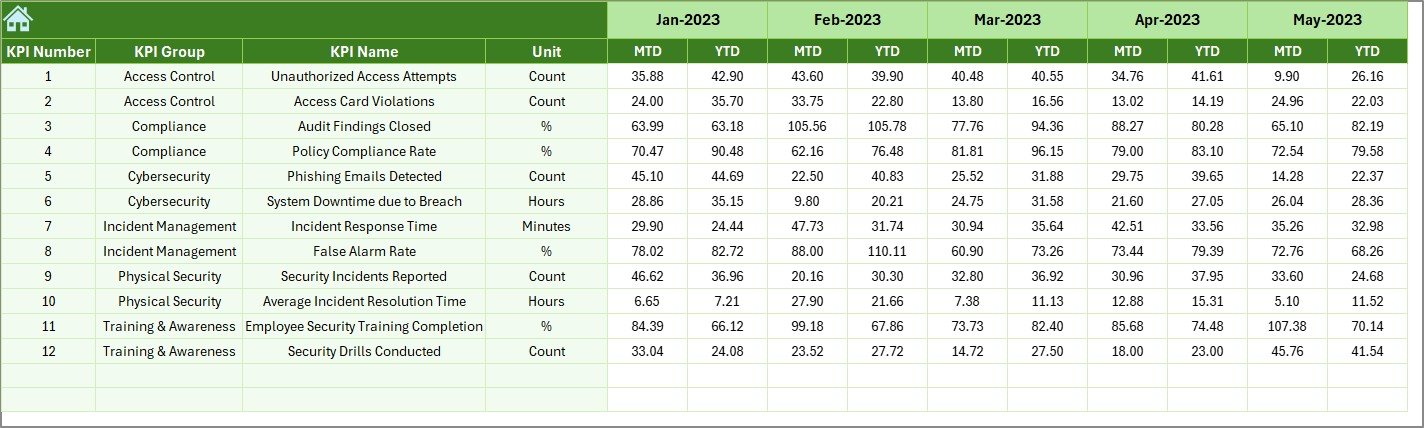
📍 Actual Numbers Input Sheet: Input your team’s monthly data — the dashboard updates automatically.
📍 Target Sheet: Store and adjust performance goals for each KPI to maintain realistic benchmarks.
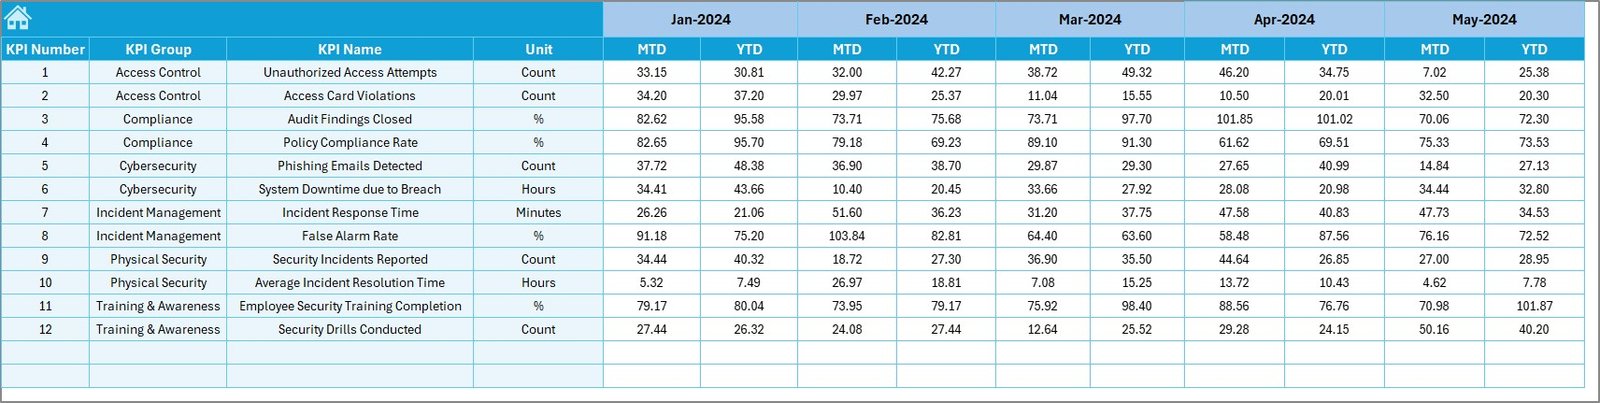
📍 Previous Year Sheet: Compare current performance with past year data to assess growth and consistency.
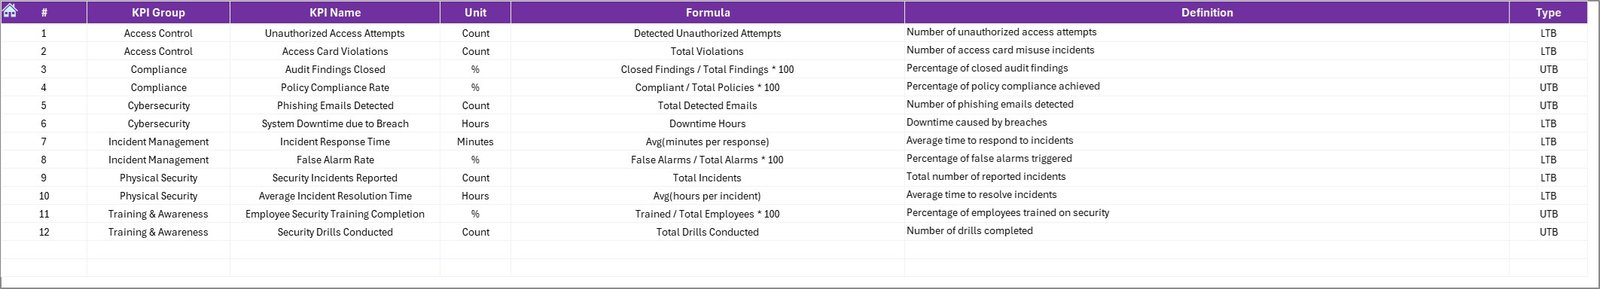
📍 KPI Definition Sheet: Contains the KPI library — names, units, formulas, and concise definitions for full transparency.
🧠 How to Use the Security KPI Dashboard in Excel
1️⃣ Enter Data Easily: Input your monthly actual numbers, targets, and previous year data in the respective sheets.
2️⃣ Select Your Month: Use the dropdown in cell D3 to view specific month reports.
3️⃣ Analyze with Charts: View MTD/YTD data with visual trends and conditional arrows showing growth or decline.
4️⃣ Drill Down by KPI: Use the KPI Trend sheet to review detailed performance for each metric.
5️⃣ Compare & Improve: Track Actual vs Target and identify improvement areas instantly.
6️⃣ Share Reports Instantly: Save or share your dashboard across teams using OneDrive or SharePoint.
With zero coding required and pre-built structure, you can set it up in minutes and start monitoring performance right away.
👥 Who Can Benefit from This Security KPI Dashboard in Excel
🏢 Security Managers: Track team performance and incident trends.
💻 IT Administrators: Measure response times, vulnerabilities, and patch compliance.
📑 Compliance Officers: Ensure audit readiness and policy adherence.
📊 Business Leaders: Gain strategic insights into risk management and ROI of security investments.
🏫 Educational Institutions & Startups: Leverage cost-effective security monitoring without complex software.
This Excel-based dashboard is flexible, automated, and designed to make your security reporting process easier, faster, and more reliable.


Reviews
There are no reviews yet.