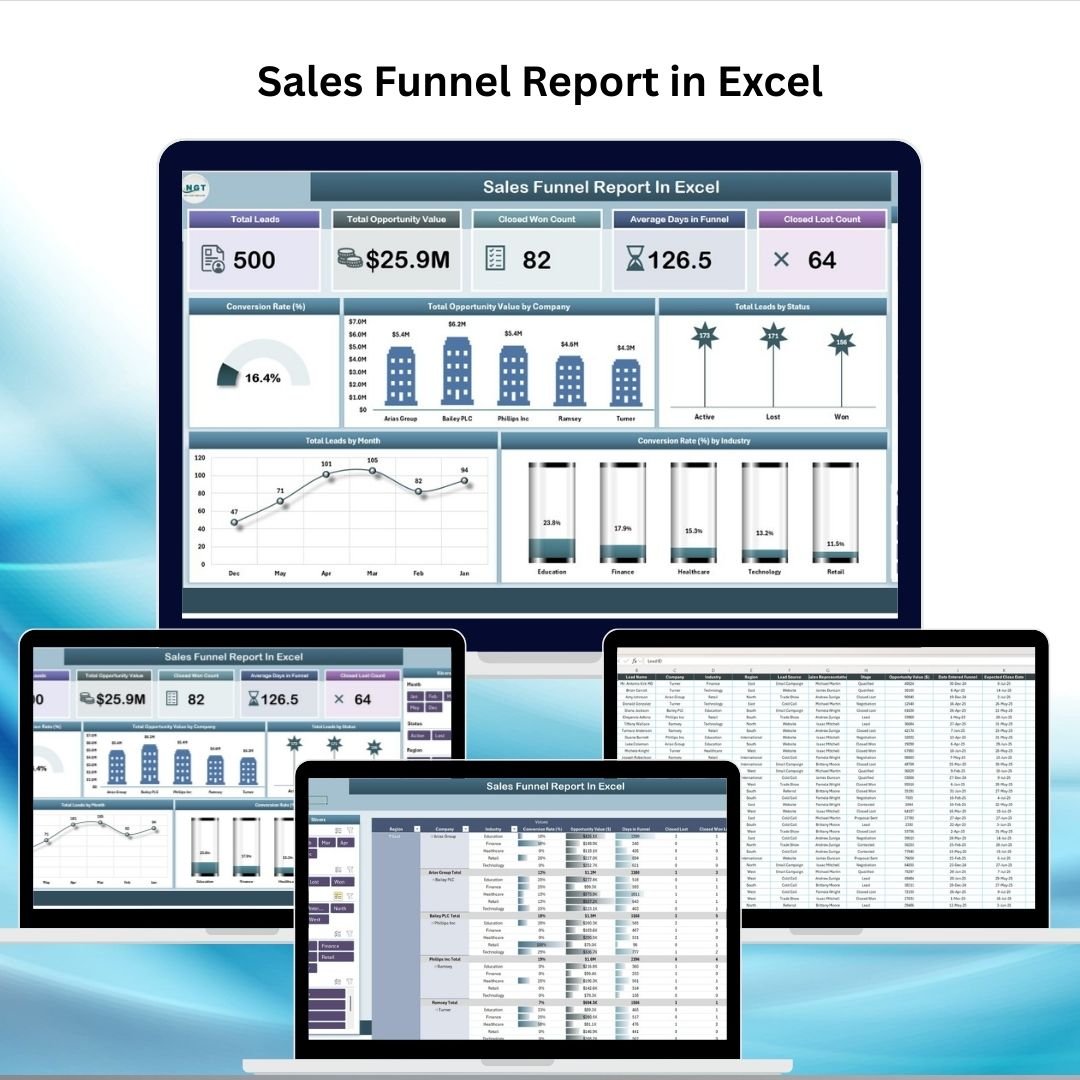
Managing your sales pipeline effectively is critical for driving growth and revenue. Without clear visibility into leads, opportunities, and conversions, sales teams may struggle to prioritize efforts and close deals on time. That’s where our Sales Funnel Report in Excel comes in—a ready-to-use, interactive reporting tool designed to give you complete visibility into your sales process from lead generation to deal closure.
This Excel-based solution makes sales tracking simple, visual, and actionable, helping sales managers and teams identify bottlenecks, analyze conversion trends, and focus on high-value opportunities.
⭐ Key Features of the Sales Funnel Report
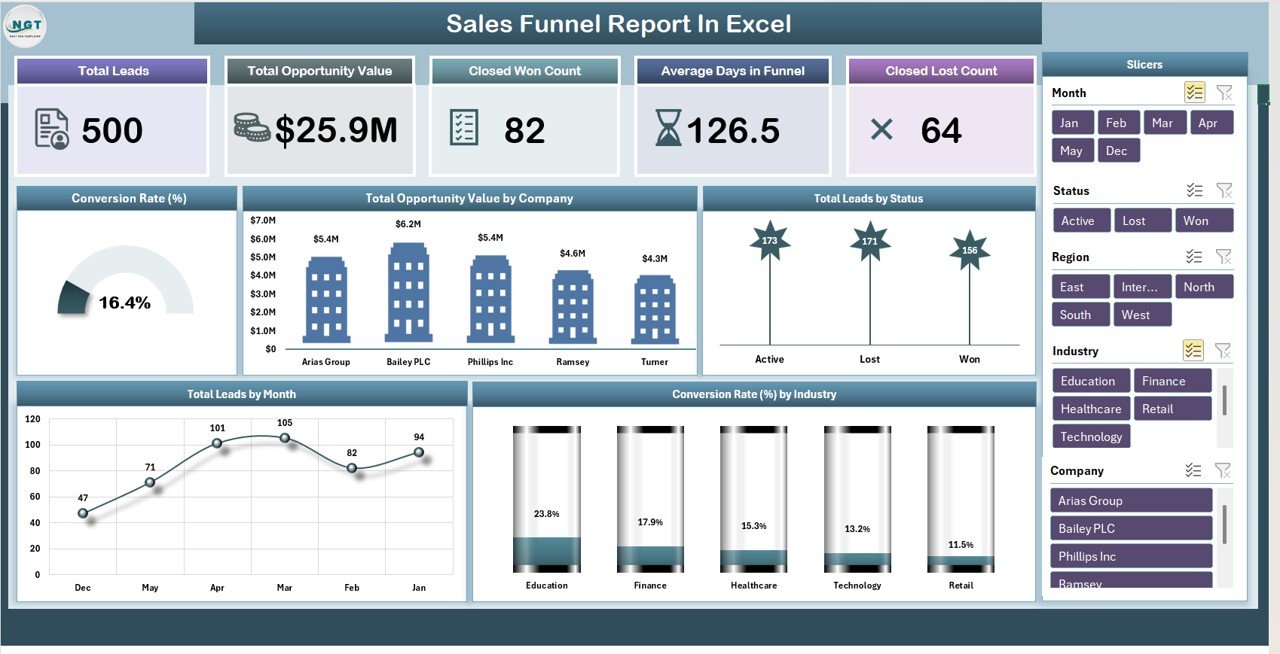
1. Summary Sheet Tab 🏷️
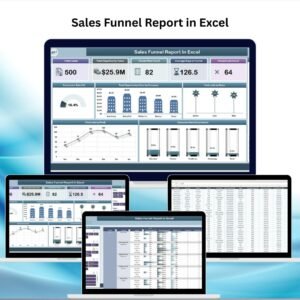
The Summary Sheet provides a high-level overview of the sales pipeline using cards and charts:
Cards Include:
-
Total Leads → Overall number of leads in the pipeline.
-
Total Opportunity Value ($) → Revenue potential from all opportunities.
-
Closed Won Count → Number of deals successfully closed.
-
Average Days in Funnel → Average lead cycle duration.
-
Closed Leads → Total closed deals (won + lost).
Charts Include:
-
📊 Conversion Rate (%) – Lead-to-deal closure success rate.
-
📊 Opportunity Value by Company – Identify top-revenue contributors.
-
📊 Total Leads by Status – New, Contacted, Qualified, Lost.
-
📊 Leads by Month – Monthly lead generation trends.
-
📊 Conversion Rate (%) by Industry – Benchmark industry performance.
This page gives actionable insights to prioritize sales efforts and refine the funnel.
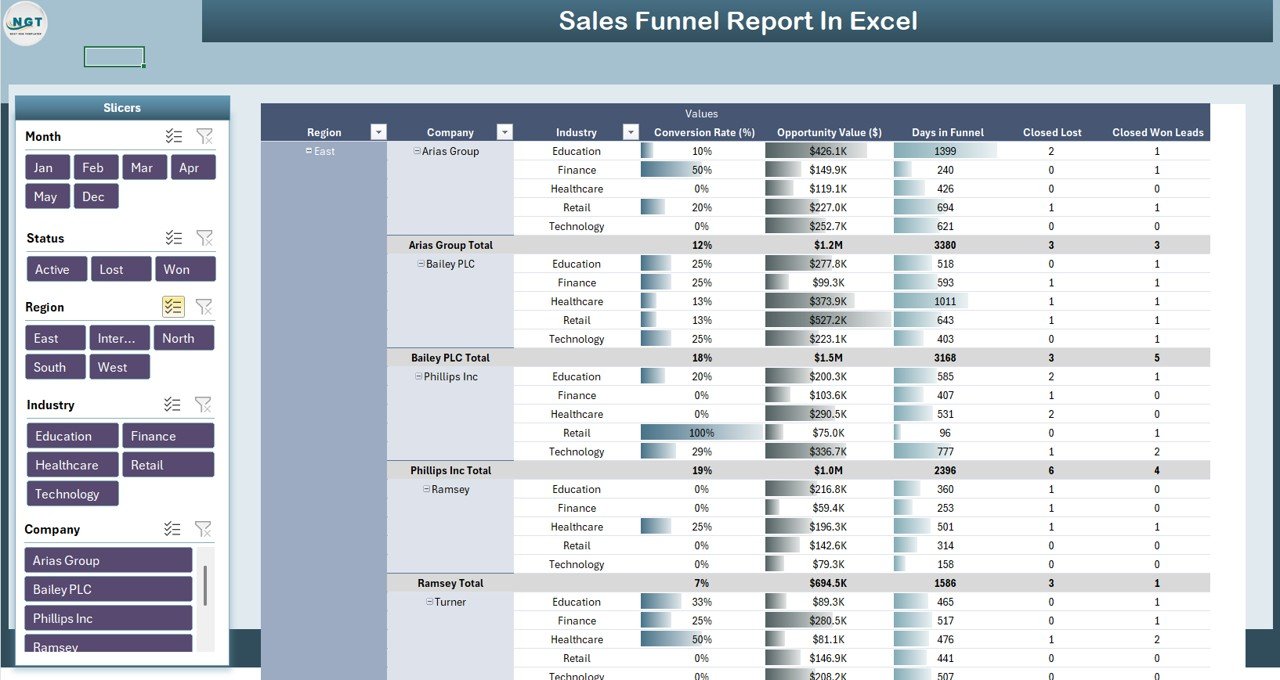
2. Report Sheet Tab 🔍
The Report Sheet offers an interactive Power Pivot view for deeper insights.
You can:
-
Slice and filter data by company, industry, or lead status.
-
Analyze conversion rates across time periods, reps, or regions.
-
Visualize opportunity values and lead volumes.
This sheet empowers sales leaders to conduct detailed analysis and strategy planning with ease.
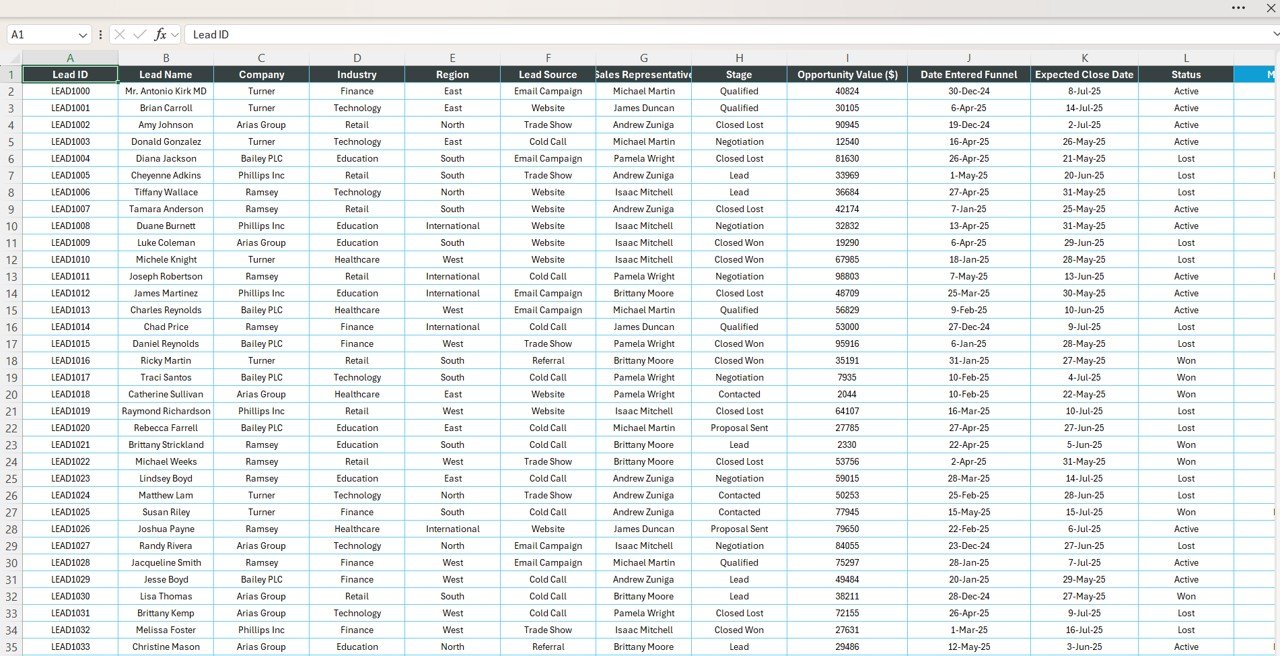
3. Data Sheet Tab 📑
The Data Sheet is your central input database, capturing raw lead and opportunity information:
-
Lead ID
-
Lead Name
-
Company
-
Industry
-
Lead Status
-
Opportunity Value ($)
-
Lead Source
-
Assigned Sales Rep
-
Lead Created Date
-
Lead Closed Date
All summary charts and metrics auto-refresh from this sheet, ensuring real-time updates and reporting accuracy.
💡 Advantages of the Sales Funnel Report
-
📈 Real-Time Insights – Always see the latest funnel performance.
-
🎯 Better Pipeline Management – Identify bottlenecks quickly.
-
🏢 Company & Industry Analysis – Focus on profitable clients.
-
📊 Trend Analysis – Monitor monthly lead and conversion patterns.
-
✅ Ease of Use – Built in Excel, no special tools required.
🚀 Opportunities for Improvement
-
🔗 Integrate with CRMs (Salesforce, HubSpot) for automatic updates.
-
🎨 Use conditional formatting to highlight high-value deals.
-
🧭 Track lead source performance to measure marketing ROI.
-
👤 Add sales rep performance metrics for accountability.
-
⏰ Build alerts for leads “stuck” too long in the funnel.
📝 Best Practices
-
Update the Data Sheet regularly for accuracy.
-
Monitor conversion rates at every funnel stage.
-
Use filters & slicers to tailor reports by department or region.
-
Analyze monthly and quarterly trends to refine strategy.
-
Share insights in team meetings for alignment.
✅ Conclusion
The Sales Funnel Report in Excel is a powerful yet simple tool for tracking leads, opportunities, and conversions. It helps sales managers and teams spot bottlenecks, prioritize efforts, and close high-value deals faster. With automated charts, interactive pivots, and a clean design, this report is the go-to solution for smarter sales pipeline management.


Reviews
There are no reviews yet.