In today’s fast-moving market, guessing your sales numbers is no longer an option. Every discount, every shipment, and every product category directly impacts your profit. However, many businesses still rely on static spreadsheets and outdated reports. As a result, leaders struggle to understand revenue trends, margin pressure, and regional performance clearly.Now imagine having complete control over your sales performance in one interactive screen.That is exactly what the Sales Dashboard in Power BI delivers.
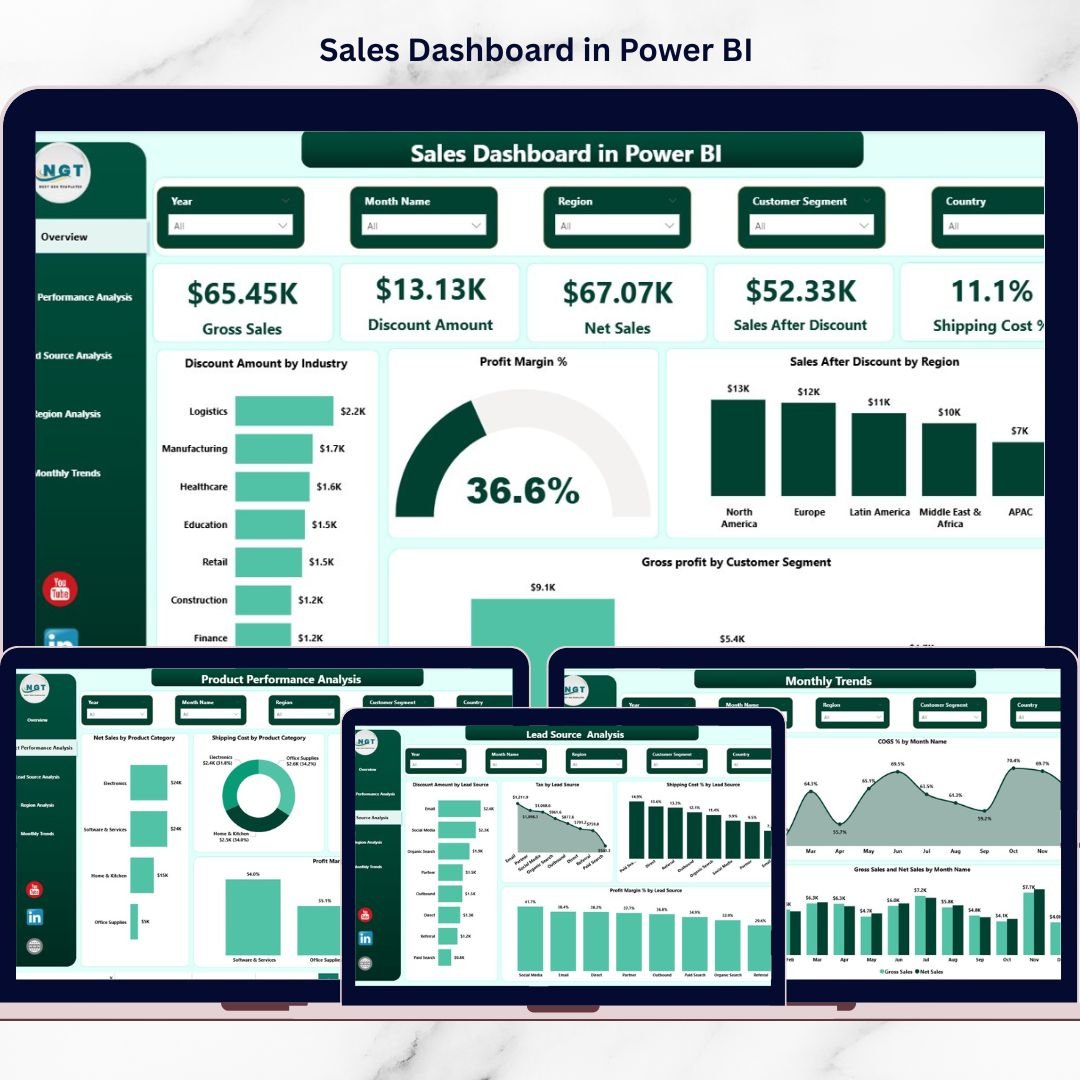
This professionally designed, ready-to-use dashboard transforms your raw sales data into powerful visual insights. Instead of digging through Excel sheets, you can instantly monitor Gross Sales, Net Sales, Profit Margin %, Discount Impact, Shipping Cost %, Regional Performance, Product Profitability, and Monthly Trends — all in one centralized Power BI report.
Therefore, you move from reactive reporting to proactive decision-making.
🚀 Key Feature of Sales Dashboard in Power BI
This dashboard includes 5 powerful and interactive pages designed for complete sales visibility:
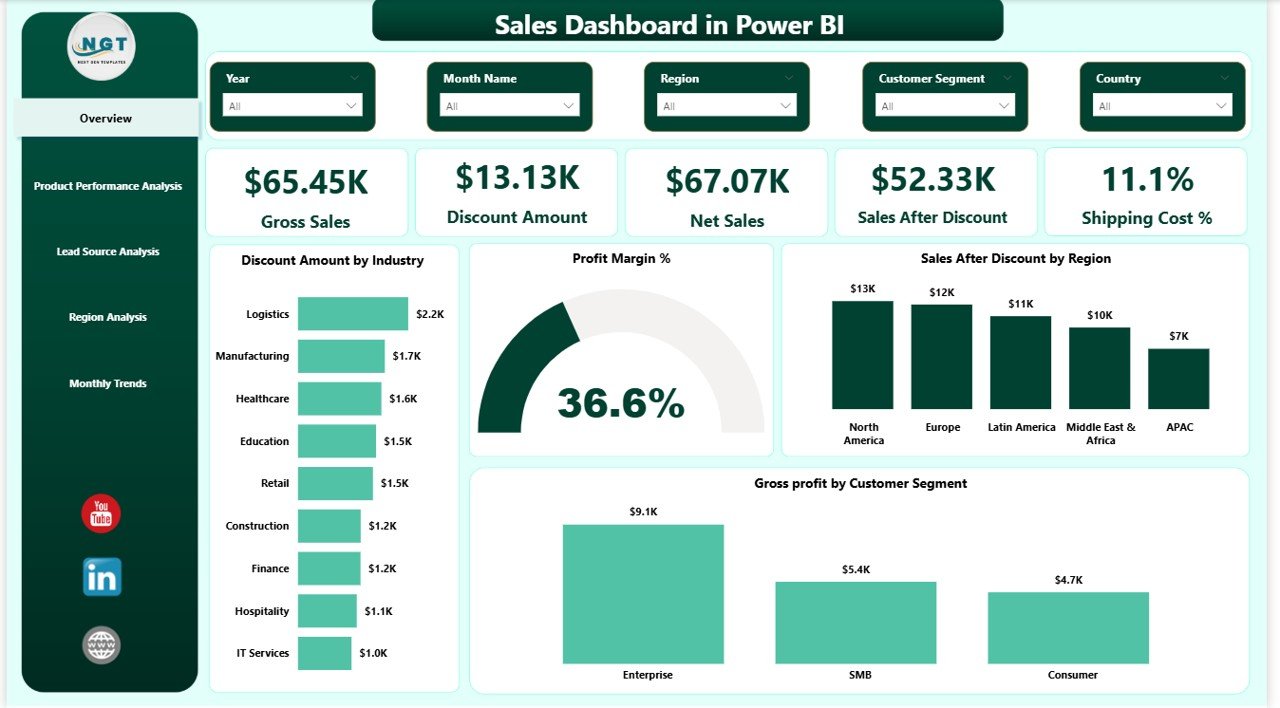
📊 Overview Page
Track high-level KPIs like Gross Sales, Net Sales, Discount Amount, Profit Margin %, and Shipping Cost %. Instantly understand business health at a glance.
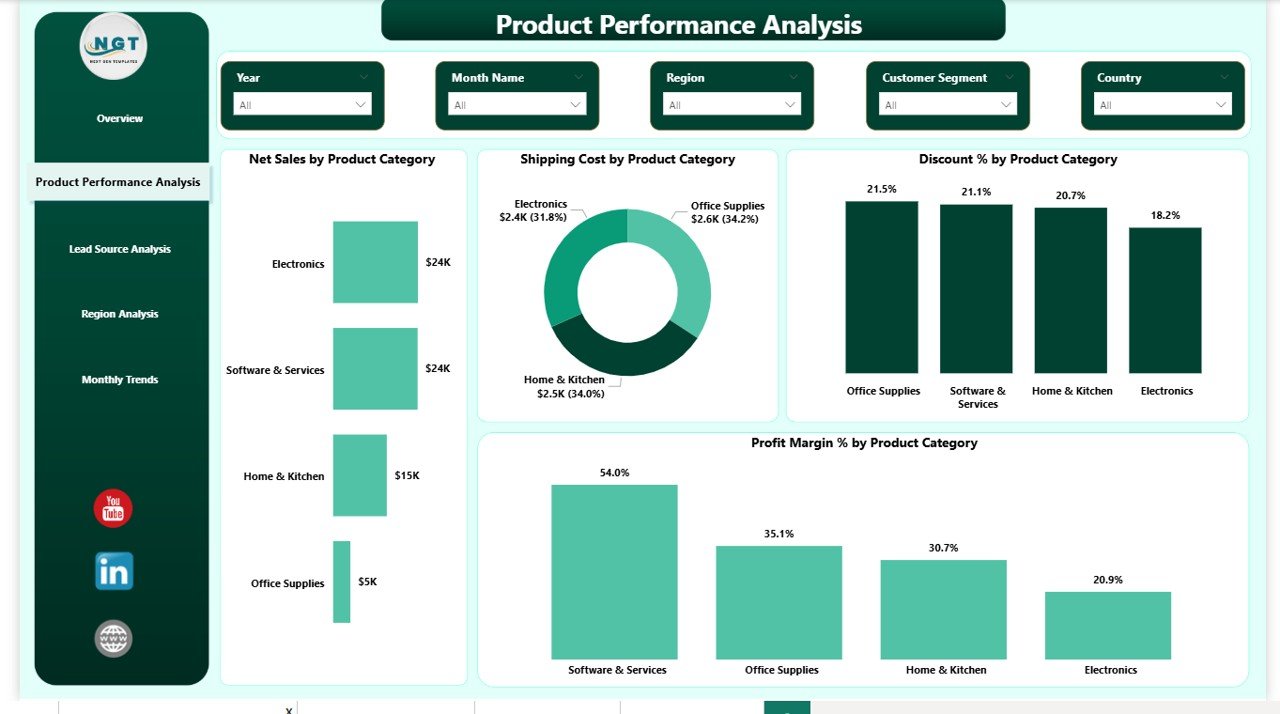
📦 Product Performance Analysis
Identify which product categories generate the highest profit and which ones suffer from excessive discounts or shipping costs.
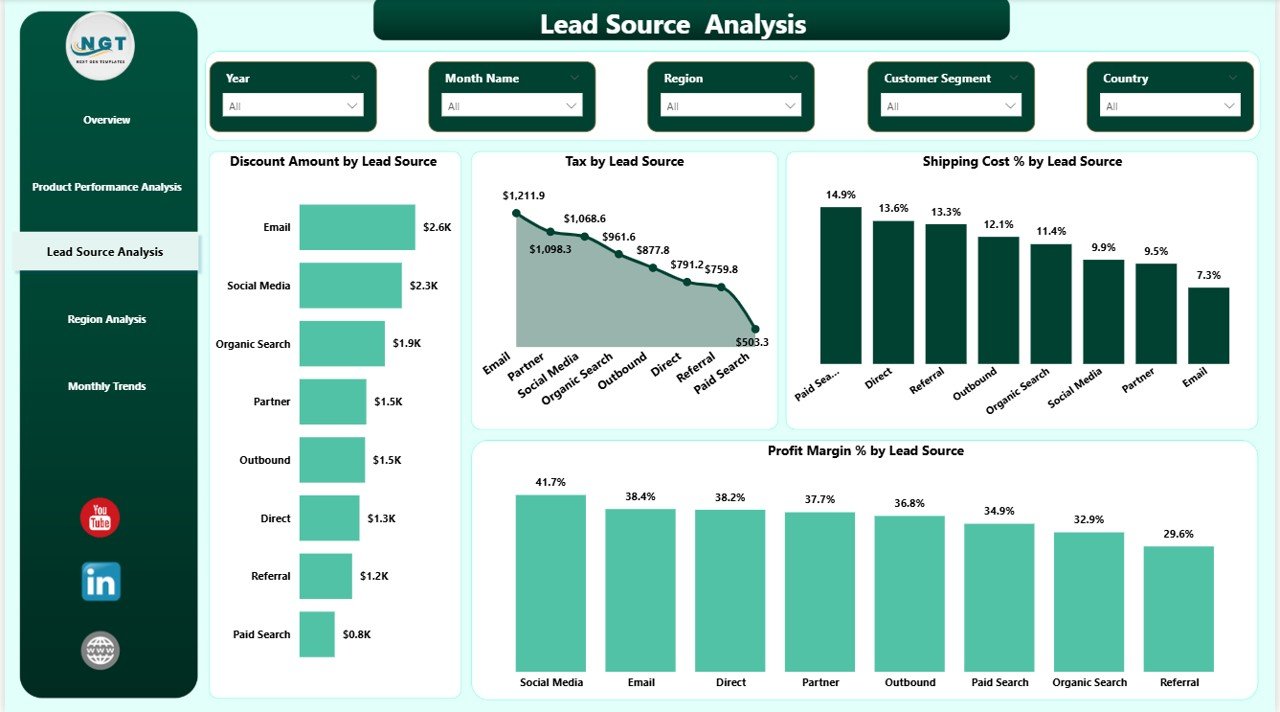
🎯 Lead Source Analysis
Measure performance by marketing channel. Discover which lead sources generate profitable customers and which drain margins.
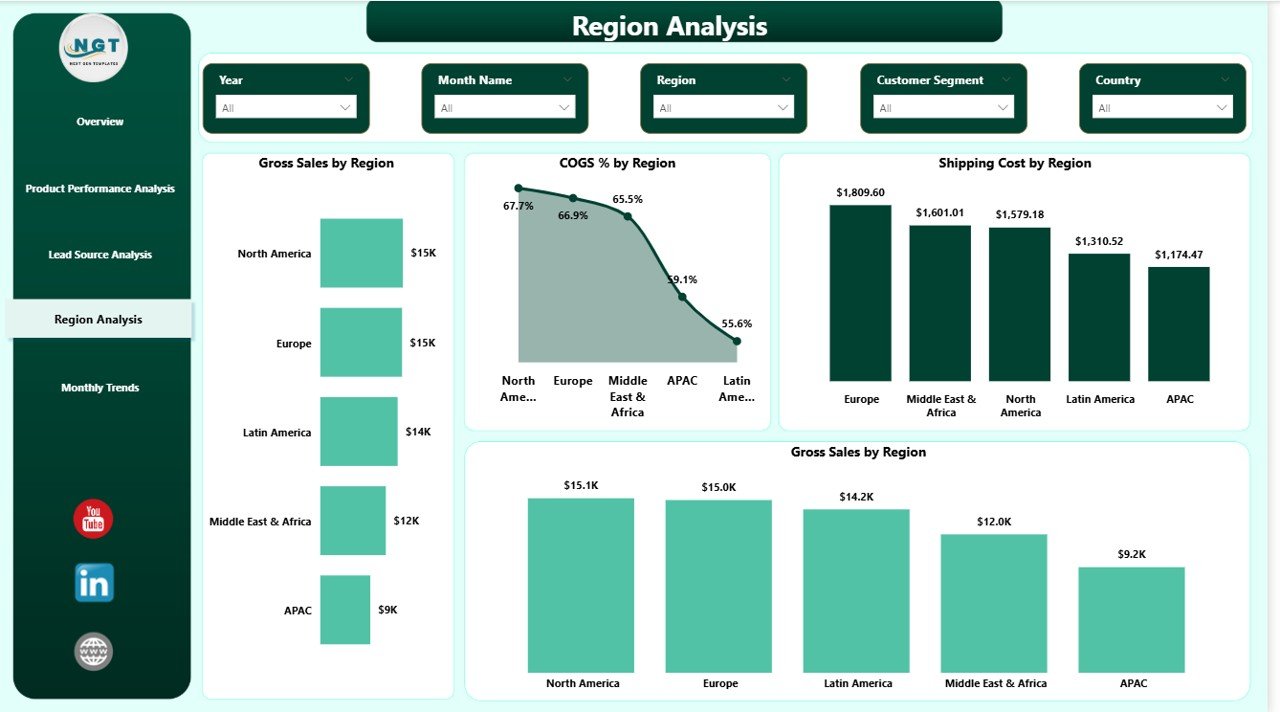
🌍 Region Analysis
Compare sales, COGS %, and shipping costs across territories to detect high-growth and high-cost regions.
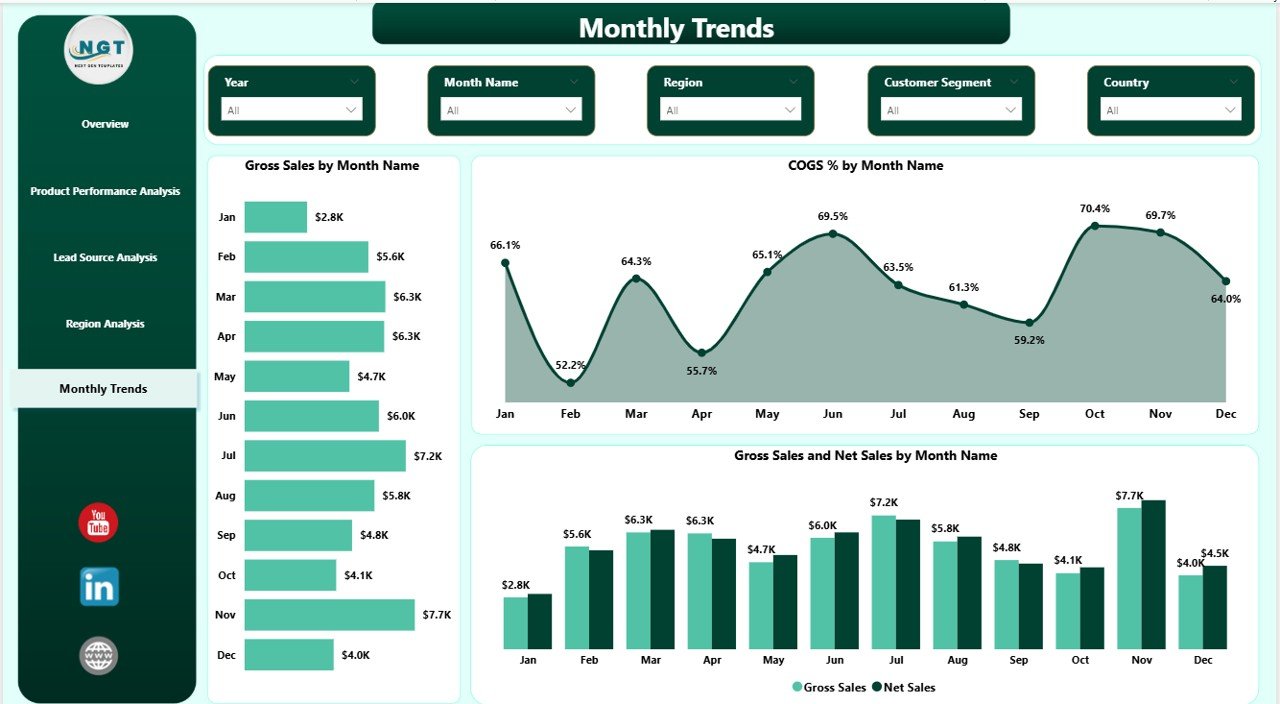
📈 Monthly Trends Page
Analyze Gross Sales vs Net Sales trends, seasonal patterns, and cost fluctuations month-over-month.
Because Power BI supports slicers and drill-downs, you can filter data by Month, Region, Industry, Product Category, or Lead Source within seconds.
📦 What’s Inside the Sales Dashboard in Power BI
When you download this dashboard, you get:
✔️ A fully designed 5-page Power BI (.pbix) file
✔️ Pre-built KPI Cards and dynamic charts
✔️ Professionally structured DAX measures
✔️ Clean and consistent color theme
✔️ Interactive slicers for quick filtering
✔️ Trend analysis visuals for forecasting
✔️ Profit-focused metrics like Margin %, COGS %, and Shipping %
✔️ Scalable model suitable for small and large businesses
The dashboard is structured for real business scenarios, not just visuals. Every page is designed to support profitability improvement and smarter decision-making.
🛠️ How to Use the Sales Dashboard in Power BI
Using this dashboard is simple and straightforward:
1️⃣ Open the Power BI Desktop file.
2️⃣ Connect your sales dataset to the model.
3️⃣ Refresh the data.
4️⃣ Use slicers to filter by Month, Region, Product, or Lead Source.
5️⃣ Analyze KPIs and identify performance gaps instantly.
Because the dashboard is pre-built, you save hours of design and DAX writing time. Instead of building from scratch, you focus only on insights and strategy.
You can also publish it to Power BI Service for sharing with your team.
👥 Who Can Benefit from This Sales Dashboard in Power BI
This dashboard is ideal for:
💼 Sales Managers
📊 Business Analysts
🏢 Small and Medium Enterprises
🏭 Manufacturing Companies
🛍️ Retail Businesses
📦 Distribution Companies
📈 Startup Founders
🎯 Marketing Heads
If you want to reduce reporting time, improve visibility, and increase profitability, this dashboard is built for you.
This Sales Dashboard in Power BI is not just a reporting tool. It is your sales command center. It helps you detect margin leakage, optimize discounts, monitor regional growth, and align marketing with profitability.
When you implement this dashboard, you gain clarity. When you gain clarity, you gain control. And when you gain control, you drive growth.
Click here to read the Detailed Blog Post
Watch the step-by-step video tutorial: