Road safety management is essential for protecting lives, improving traffic systems, and reducing road accidents. Governments, transportation departments, and safety agencies constantly monitor accident rates, compliance checks, safety inspections, and public awareness programs. However, when safety data is scattered across spreadsheets and reports, it becomes difficult to analyze performance and take timely action.
This is where the Road Safety Services KPI Dashboard in Power BI becomes a powerful solution.
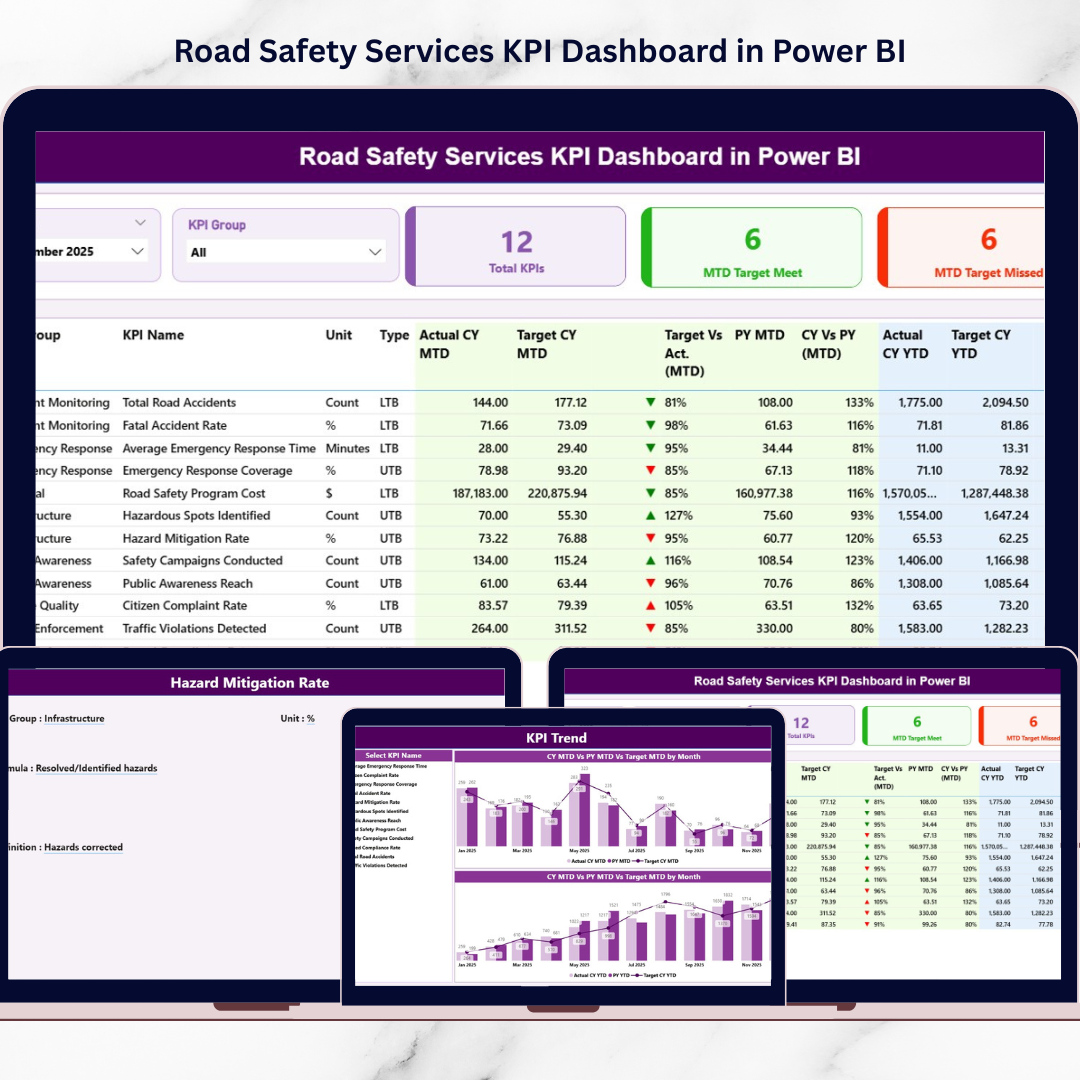
This ready-to-use Power BI dashboard transforms raw road safety data into clear, interactive visual insights. Instead of manually reviewing multiple reports, decision-makers can monitor safety performance from a single centralized dashboard. As a result, they can quickly identify trends, detect performance gaps, and implement effective safety strategies.
The dashboard provides Month-to-Date (MTD) and Year-to-Date (YTD) performance tracking along with Target vs Actual comparisons and Previous Year benchmarking. Therefore, organizations gain a comprehensive understanding of road safety performance.
If you want a structured, data-driven approach to improving road safety, this dashboard provides the perfect solution.
🚦 Key Feature of Road Safety Services KPI Dashboard in Power BI
This Power BI solution includes multiple analytical pages designed to monitor safety KPIs effectively.
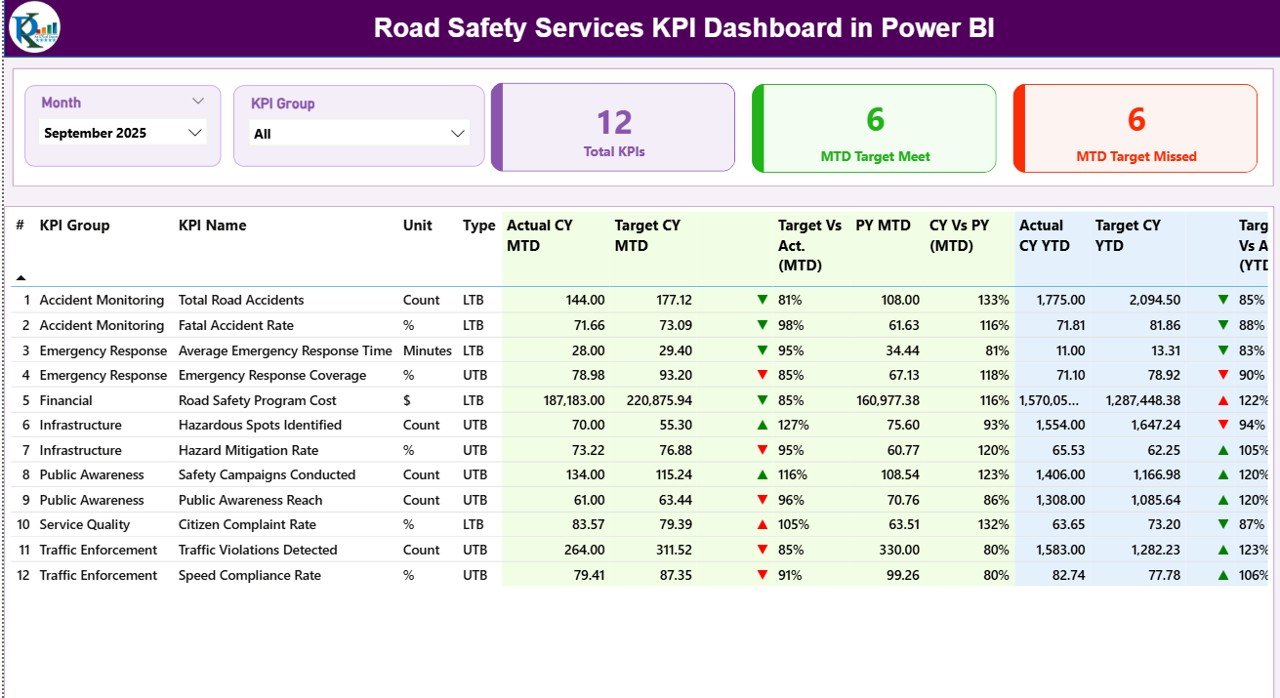
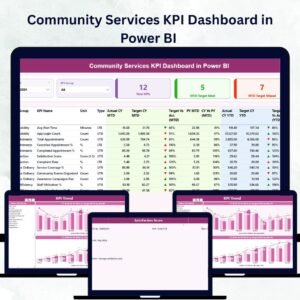
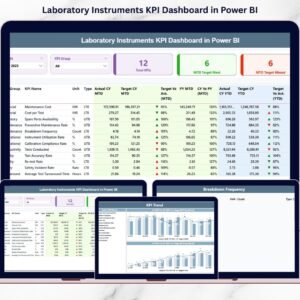
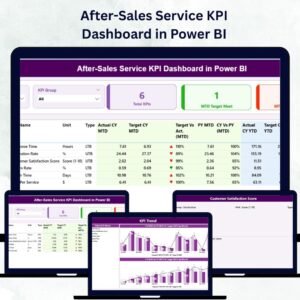
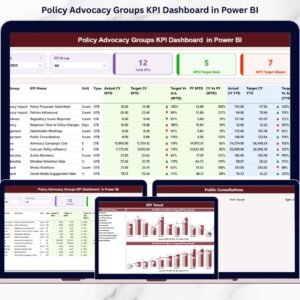
📊 Interactive Summary Page – A central dashboard displaying key safety indicators and performance status.
🎯 Smart KPI Cards – Instantly view Total KPI Count, MTD Target Meet Count, and MTD Target Missed Count.
📈 MTD & YTD KPI Monitoring – Track both short-term and long-term safety performance metrics.
📉 Target vs Actual Comparison – Automatically calculate KPI achievement levels.
🔄 Previous Year Benchmarking – Compare current safety performance with historical results.
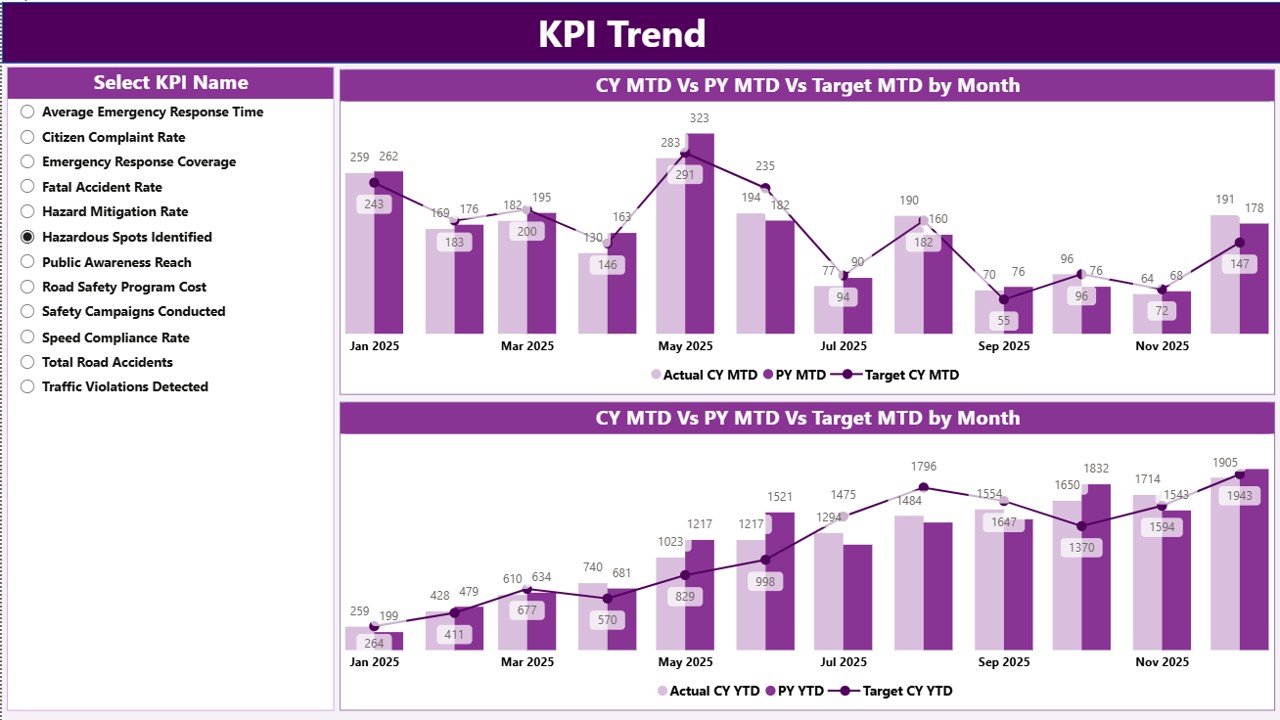
📊 KPI Trend Analysis Page – Visual charts showing performance trends over time.
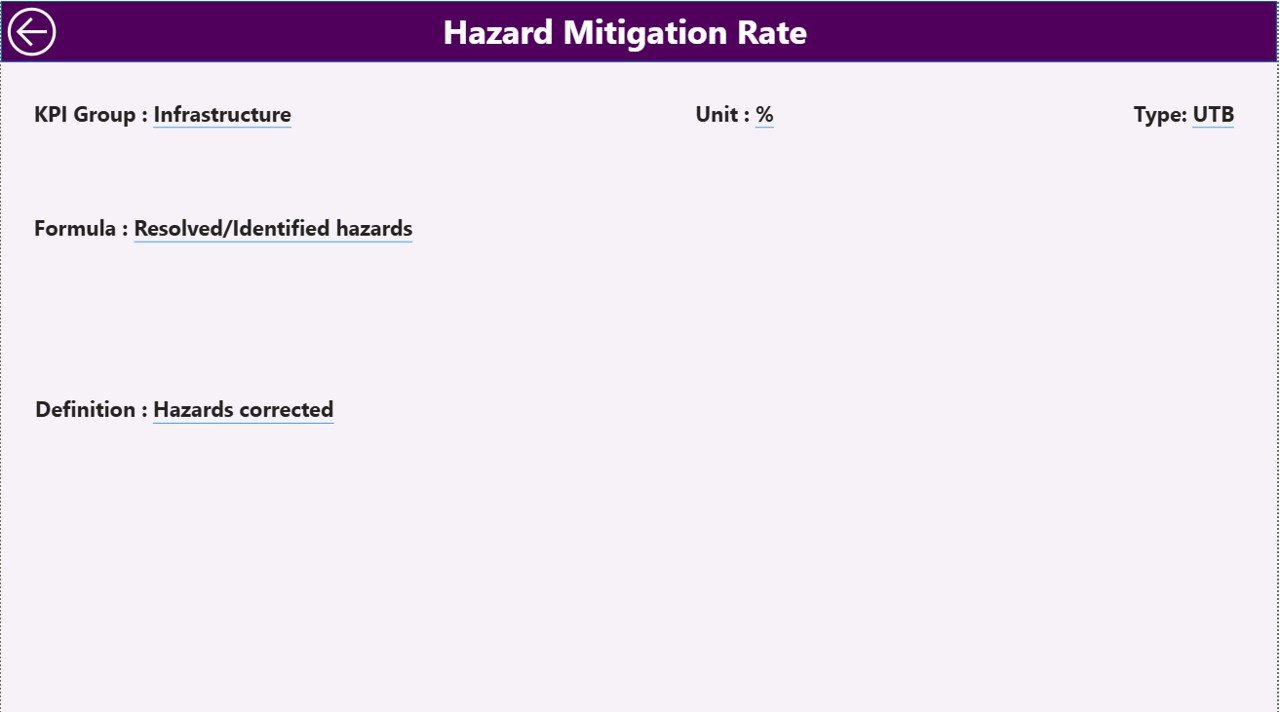
📘 KPI Definition Drill-Through Page – View KPI formulas, definitions, units, and classification.
🎛 Interactive Slicers – Filter performance by Month and KPI Group instantly.
Because Power BI updates visuals dynamically, managers can analyze safety performance quickly and accurately.
📦 What’s Inside the Road Safety Services KPI Dashboard in Power BI
The dashboard is built on a structured data model connected to Excel data sources, ensuring easy data management and scalability.
Inside the solution, you get:
✅ Summary performance dashboard
✅ KPI trend analysis page
✅ KPI definition drill-through page
✅ Dynamic slicers for interactive filtering
✅ Automated KPI comparisons
✅ Clear visual performance indicators
✅ Scalable KPI tracking structure
The dashboard connects to an Excel data file containing the following worksheets:
Input_Actual Sheet
Stores actual KPI performance values including:
KPI Name
Month
MTD Value
YTD Value
Input_Target Sheet
Stores KPI targets:
KPI Name
Month
MTD Target
YTD Target
KPI Definition Sheet
Stores KPI documentation including:
KPI Number
KPI Group
KPI Name
Unit
Formula
Definition
KPI Type (LTB or UTB)
Because this structured data model feeds the dashboard, performance updates automatically whenever data changes.
⚙️ How to Use the Road Safety Services KPI Dashboard in Power BI
Using this dashboard is simple and efficient.
1️⃣ Enter actual KPI values in the Input_Actual Sheet.
2️⃣ Enter KPI targets in the Input_Target Sheet.
3️⃣ Define KPI details in the KPI Definition Sheet.
4️⃣ Import the Excel file into Power BI.
5️⃣ Refresh the dashboard to update visuals.
6️⃣ Use slicers to filter KPIs by month or KPI group.
7️⃣ Analyze performance trends and KPI comparisons.
Within seconds, decision-makers gain powerful insights into road safety performance.
No advanced Power BI expertise is required to operate the dashboard.
👥 Who Can Benefit from This Road Safety Services KPI Dashboard in Power BI
This dashboard is useful for organizations responsible for road safety monitoring and transportation management.
It is especially valuable for:
🚦 Road Safety Authorities
🚓 Traffic Management Departments
🏛 Government Transportation Agencies
🚧 Infrastructure and Highway Authorities
📊 Public Safety Analysts
🚗 Urban Mobility and Transport Planners
Because the dashboard presents insights visually, both technical teams and senior leadership can easily understand safety performance.
💡 Why This Dashboard Improves Road Safety Monitoring
✔ Centralized safety KPI monitoring
✔ Faster identification of safety risks
✔ Real-time performance insights
✔ Clear comparison with targets and historical data
✔ Improved accountability across departments
✔ Better safety strategy planning
✔ Reduced manual reporting workload
✔ Scalable and customizable analytics system
Instead of relying on delayed reports, organizations gain real-time insights that improve safety planning and reduce accident risks.
This dashboard turns road safety data into actionable intelligence that supports smarter transportation management.
### Click here to read the Detailed blog post
Visit our YouTube channel to learn step-by-step video tutorials
Youtube.com/@PKAnExcelExpert