

A growing business needs more than just numbers — it needs clarity, control, and confidence. Revenue can rise, fall, or stay flat depending on market demand, customer trends, and strategic decisions. To succeed, leaders must know why performance changes and what actions can accelerate growth. The Revenue Growth KPI Dashboard in Google Sheets gives you a powerful, cloud-based solution for tracking real-time performance, analyzing trends, and making informed decisions instantly.
This ready-to-use dashboard transforms complex revenue data into simple visuals, monthly comparisons, and actionable insights. Whether you manage sales, finance, marketing, SaaS subscriptions, or overall business operations, this Google Sheets dashboard helps you monitor MTD (Month-to-Date), YTD (Year-to-Date), Actual vs Target, and Actual vs Previous Year — all in one place. Just enter your numbers, select your month, and the dashboard refreshes automatically with crystal-clear results.
It’s designed to save time, improve forecasting, and strengthen growth strategies. Let’s explore everything inside this powerful tool.
✨ Key Features of the Revenue Growth KPI Dashboard in Google Sheets
📊 1. Smart MTD & YTD Tracking
Instantly monitor Month-to-Date and Year-to-Date values for every KPI. No manual calculations — the dashboard updates automatically as soon as you enter your numbers.
📈 2. Actual vs Target & PY Comparison
See how your performance compares against your goals and previous year benchmarks. Up/down arrows highlight improvement or decline for quick assessment.
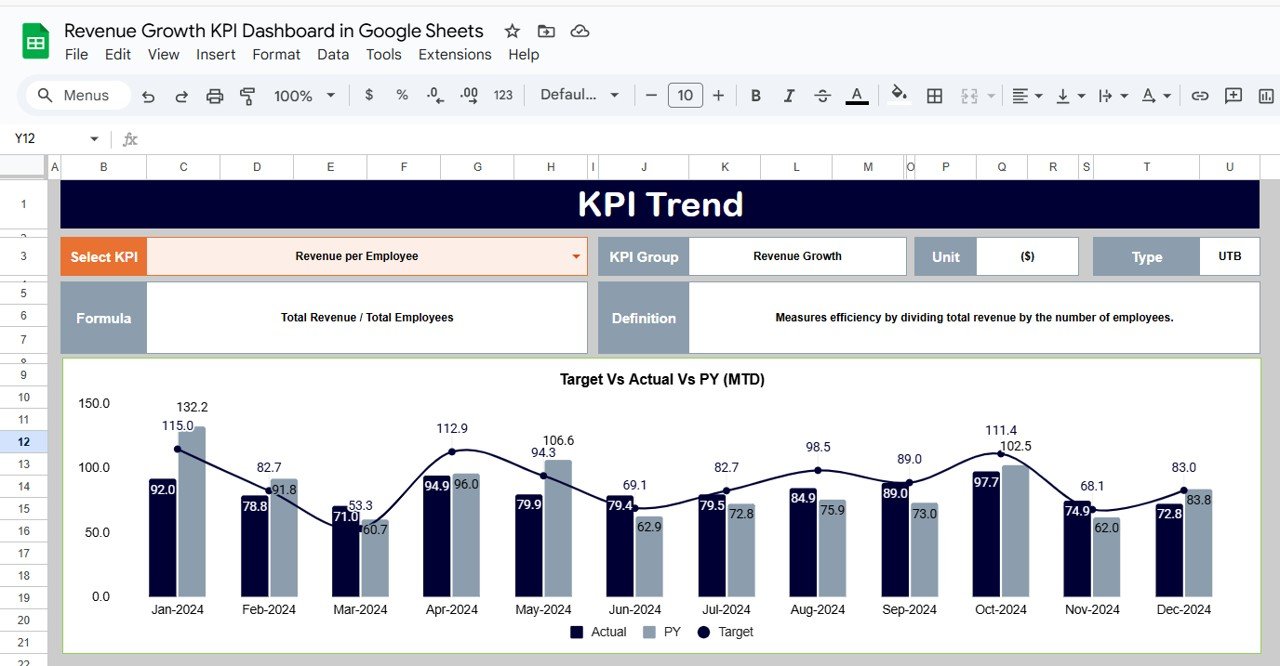
🎯 3. KPI Trend Visualization
Select any KPI from the dropdown and analyze its long-term behavior. Spot growth patterns, seasonality, and performance dips with ease.
📥 4. Seamless Data Entry Sheets
Dedicated sheets for Actuals, Targets, and Previous Year ensure clean data and fast reporting.
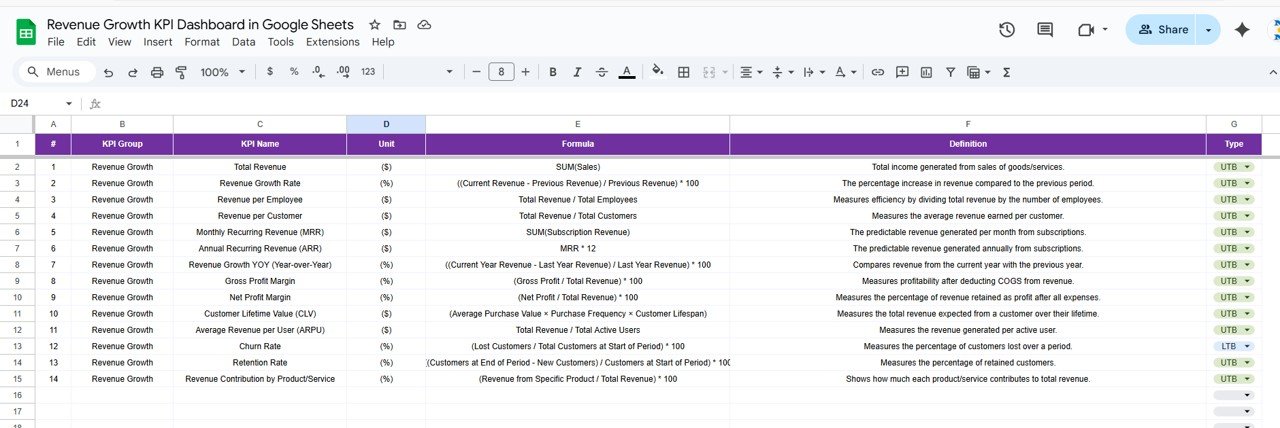
📘 5. Built-In KPI Definition Library
Keep your team aligned with a structured reference sheet containing KPI names, groups, units, formulas, and definitions.
📦 What’s Inside the Revenue Growth KPI Dashboard in Google Sheets
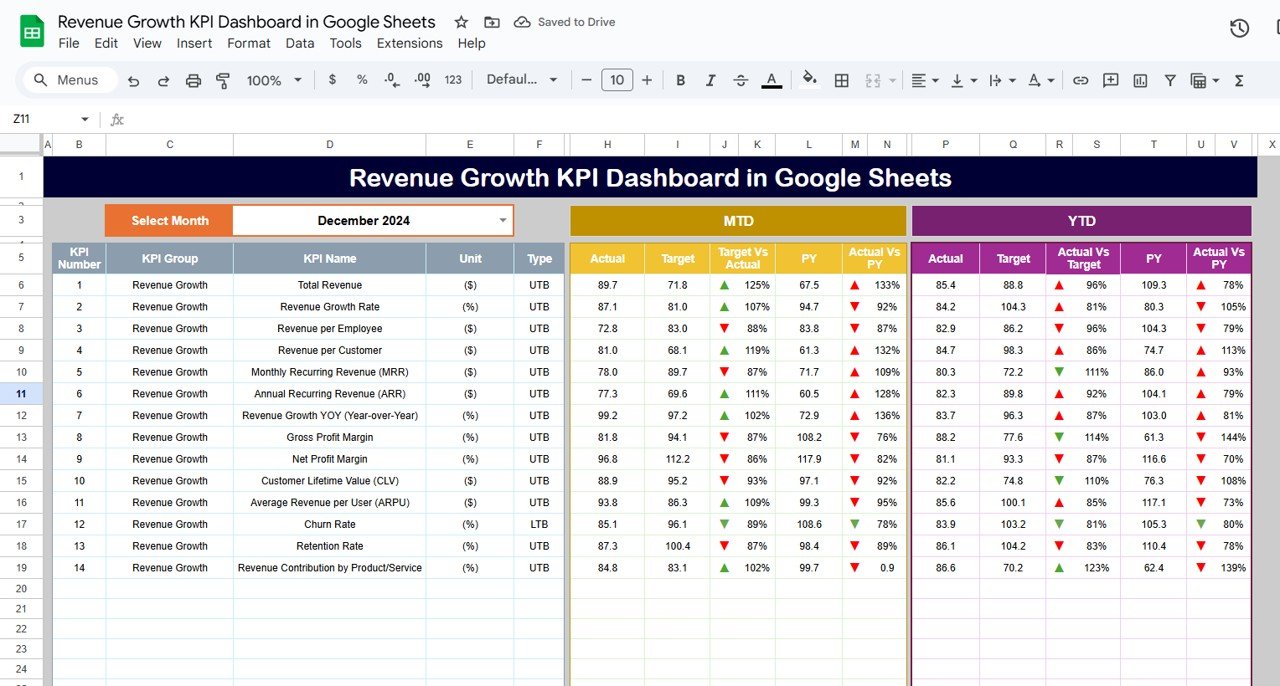
🖥️ Dashboard Sheet (Main Control Center)
This is your real-time performance hub. Select a month in cell D3, and the dashboard updates instantly. You’ll see:
-
MTD Actual, Target, and Previous Year
-
MTD Target vs Actual
-
MTD PY vs Actual
-
YTD Actual, Target, and Previous Year
-
YTD Target vs Actual
-
YTD PY vs Actual
Clear visual indicators make it easy to see what’s improving and what needs attention.
📉 KPI Trend Sheet
Select any KPI to view its group, unit, type (LTB/UTB), formula, and definition. Ideal for managers who want to understand how performance changes across months.
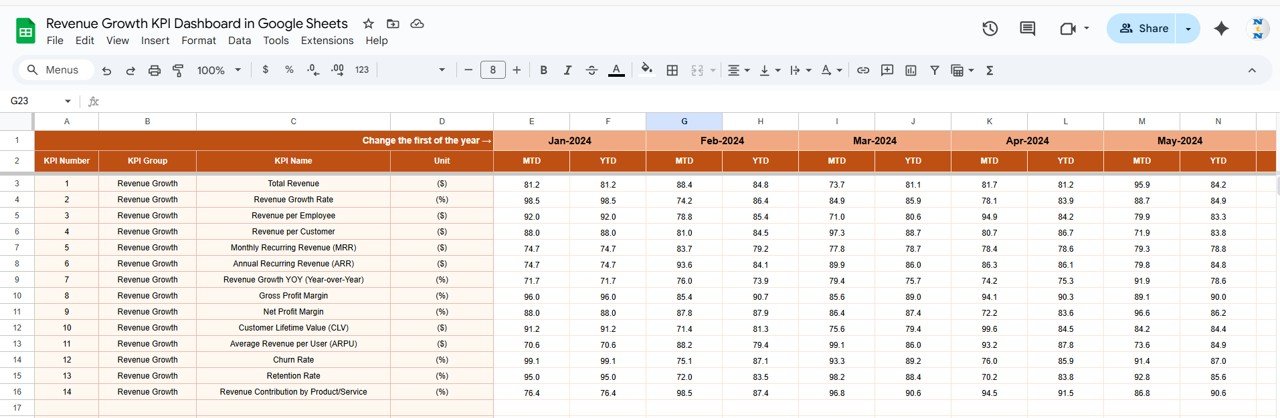
📋 Actual Number Sheet
Enter your MTD and YTD actual numbers here. Changing the year in cell E1 updates your entire dataset.
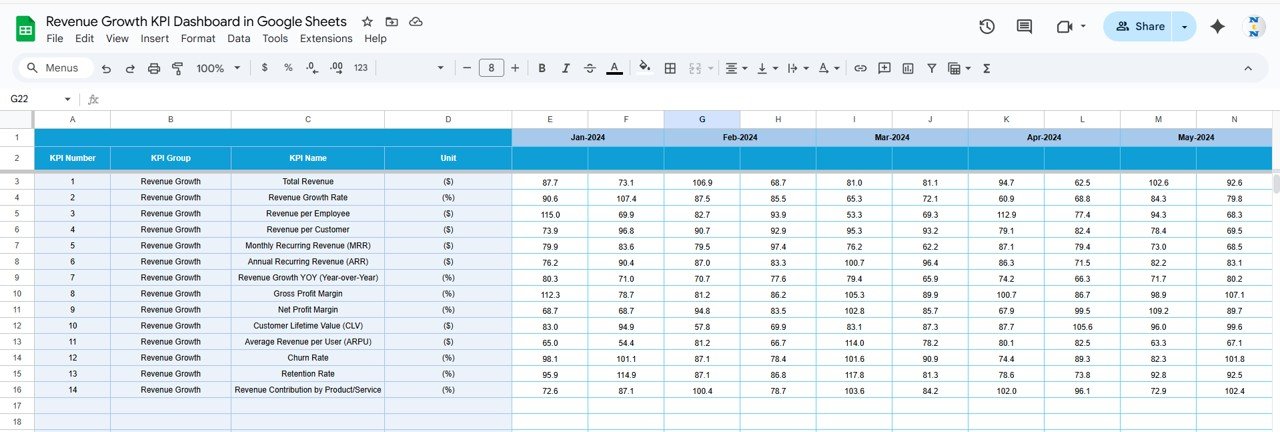
🎯 Target Sheet
Define targets for all KPIs. This helps leadership teams compare expectations vs actual performance.
📆 Previous Year Number Sheet
Enter previous-year MTD and YTD values for meaningful YOY analysis.
📘 KPI Definition Sheet
A dedicated place to maintain formulas, meaning, and purpose for each KPI.
🛠️ How to Use the Revenue Growth KPI Dashboard in Google Sheets
1️⃣ Enter Your Data
Start by adding actuals, targets, and previous-year numbers in their respective sheets.
2️⃣ Select Your Month
Use the dashboard dropdown to choose the month you want to analyze.
3️⃣ Compare Performance
Review MTD and YTD comparisons to assess whether you’re meeting goals.
4️⃣ Analyze Trends
Open the KPI Trend Sheet to understand patterns and behaviors.
5️⃣ Collaborate in Real Time
Since it’s cloud-based, team members can access and update the dashboard simultaneously.
🎯 Who Can Benefit from This Revenue Growth KPI Dashboard
💼 Business Owners & CEOs
Track financial health and revenue momentum with clarity.
📊 Finance Teams
Analyze profitability, growth %, churn, margins, and forecasting metrics.
🚀 Sales Teams
Monitor pipeline conversion, sales growth, and revenue performance.
📈 Marketing Teams
Understand how campaigns impact revenue over time.
🏢 Startups & Enterprise Teams
Make fast, data-backed decisions using real-time metrics.
Click here to read the Detailed blog post
Watch the step-by-step video tutorial:


Reviews
There are no reviews yet.