Managing a retail supply chain without real-time visibility almost always leads to delays, excess costs, and unhappy customers. Retail businesses manage procurement, inventory, logistics, warehousing, and store replenishment on a daily basis. Retail Supply Chain KPI Dashboard in Power BI However, when performance tracking depends on static reports or scattered Excel files, decision-making becomes slow and risky.
Retail Supply Chain KPI Dashboard in Power BI That is exactly why the Retail Supply Chain KPI Dashboard in Power BI becomes an essential analytics solution 📊⚡.
This ready-to-use Power BI dashboard transforms raw supply chain data into interactive, visual, and actionable insights. Instead of switching between multiple reports, retail teams can monitor Month-to-Date (MTD) and Year-to-Date (YTD) KPIs from one centralized dashboard. Because the solution uses Excel as the data source and Power BI for analytics, data entry stays simple while insights become powerful.
Designed for modern retail operations, this dashboard helps organizations move from reactive firefighting to proactive performance management.
⭐ Key Features of Retail Supply Chain KPI Dashboard in Power BI
📊 Centralized KPI Visibility
Track procurement, inventory, logistics, warehouse, and fulfillment KPIs in one interactive dashboard.
📅 MTD & YTD Performance Tracking
Monitor short-term results and long-term trends side by side for better control.
🎯 Target vs Actual Comparison
Instantly see which KPIs meet targets and which ones need attention using visual indicators.
📈 Year-over-Year Performance Analysis
Compare current performance with previous year results to measure improvement.
🎛️ Interactive Slicers
Filter KPIs by Month and KPI Group to focus on specific supply chain areas.
🔍 Drill-Through KPI Definitions
Click through to understand KPI logic, formulas, and definitions clearly.
📦 What’s Inside the Retail Supply Chain KPI Dashboard in Power BI
This professionally designed Power BI file includes three powerful analytical pages; each built for a specific purpose:
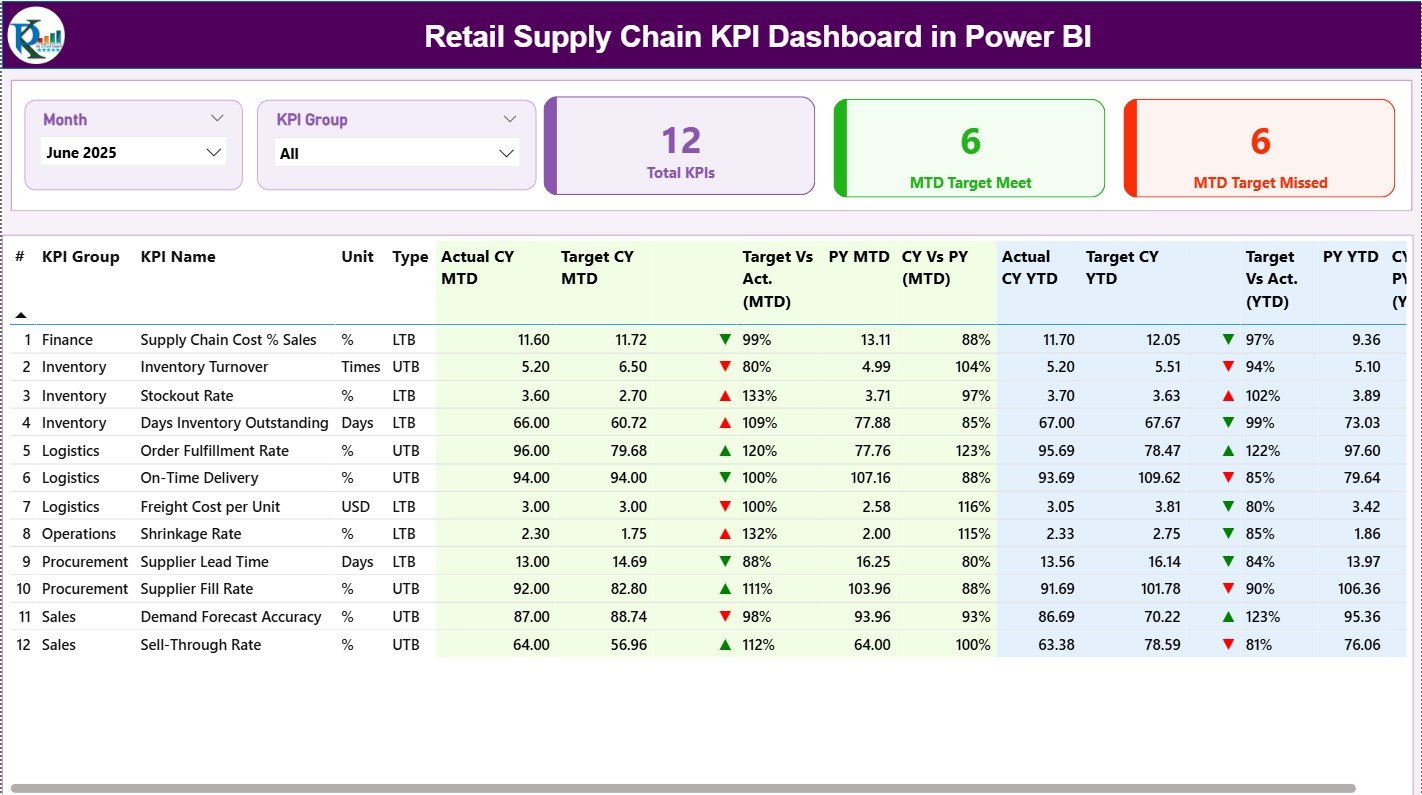
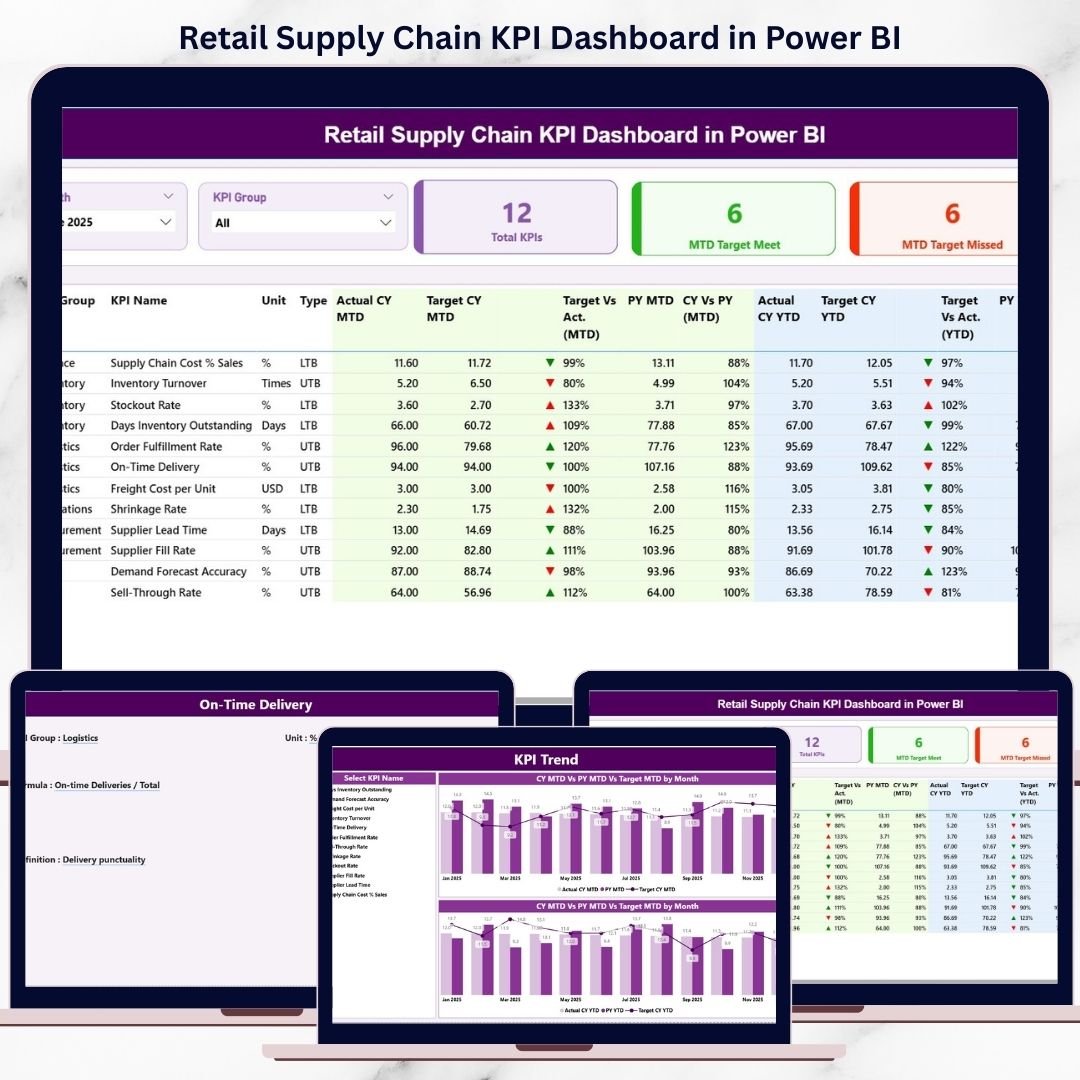
📊 Summary Page
The main overview page that displays:
-
Month slicer and KPI Group slicer
-
KPI cards showing Total KPIs, MTD Target Met, and MTD Target Missed
-
A detailed KPI table with MTD and YTD metrics
-
Actual, Target, and Previous Year comparisons
-
Green ▲ and Red ▼ icons for instant performance interpretation
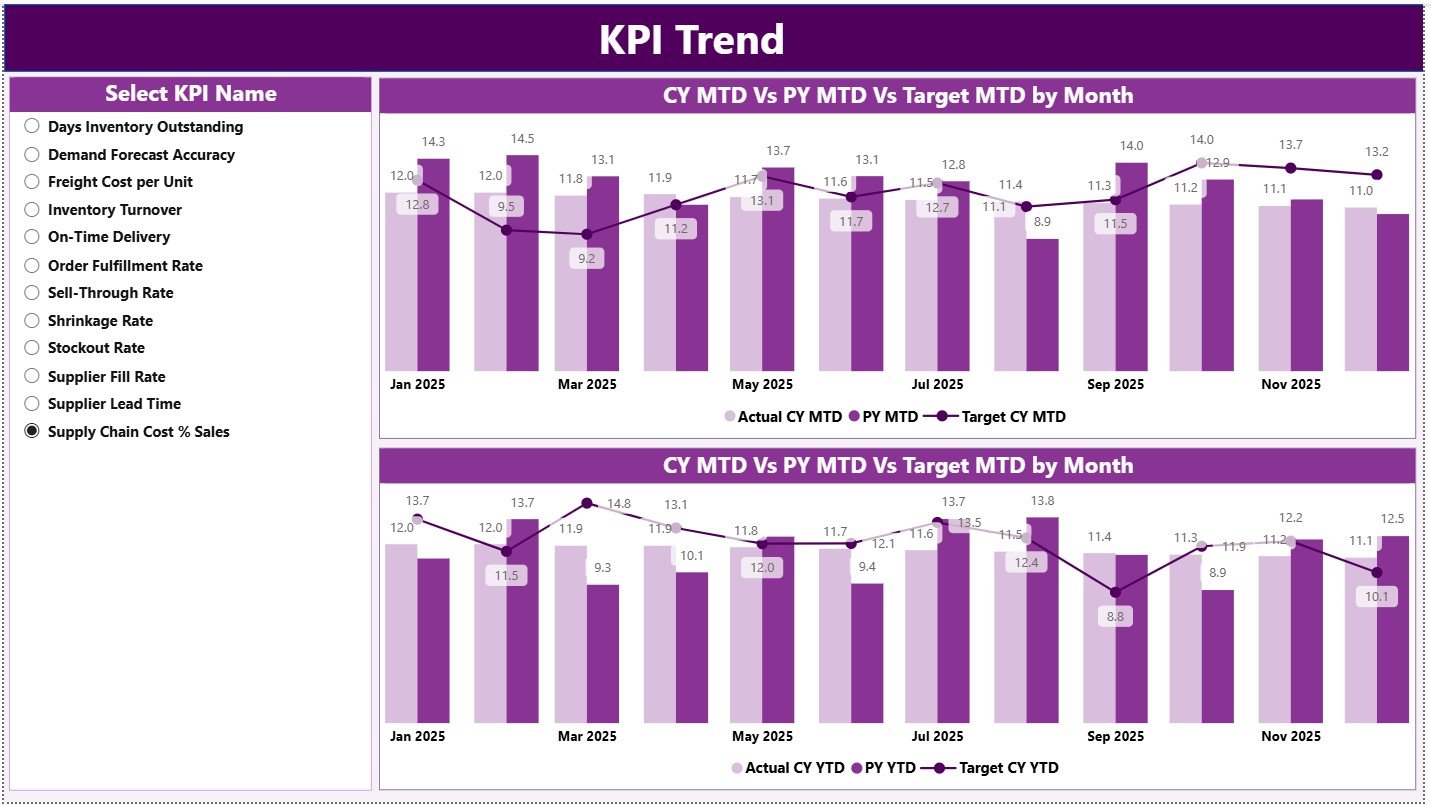
📈 KPI Trend Page
Designed for trend-based analysis with:
-
KPI Name slicer
-
MTD Trend Combo Chart (Actual, Target, PY)
-
YTD Trend Combo Chart (Actual, Target, PY)
These visuals help teams identify bottlenecks, seasonal patterns, and improvement opportunities.
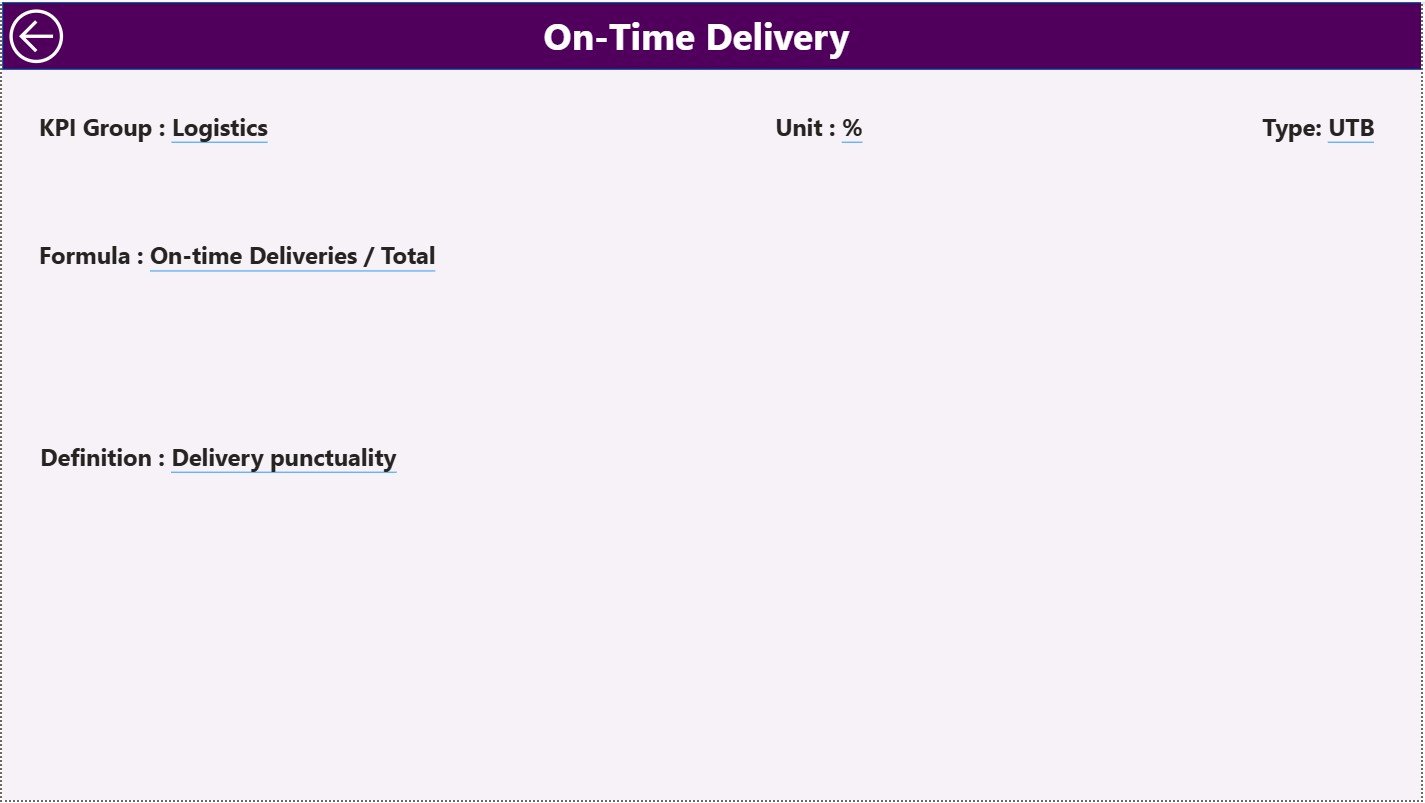
📘 KPI Definition Page (Drill-Through)
A hidden reference page that shows:
-
KPI Formula
-
KPI Definition
-
KPI Logic Explanation
Users can drill through from the Summary Page and return easily using the Back button.
🛠️ How to Use the Retail Supply Chain KPI Dashboard in Power BI
Using this dashboard is simple and efficient:
1️⃣ Enter actual MTD and YTD values in the Input_Actual Excel sheet
2️⃣ Enter target MTD and YTD values in the Input_Target sheet
3️⃣ Maintain KPI details in the KPI Definition sheet
4️⃣ Refresh the Power BI file
5️⃣ Instantly view updated KPIs, trends, and performance insights
Because calculations and visuals update automatically, teams save time and reduce manual errors.
👥 Who Can Benefit from This Retail Supply Chain KPI Dashboard in Power BI
This dashboard is ideal for:
🛒 Retail Supply Chain Managers
📦 Inventory & Demand Planners
🚚 Logistics & Warehouse Managers
📑 Procurement Teams
📊 Business Analysts
🏢 Retail Operations & Leadership Teams
Whether managing a single store or a multi-location retail network, this dashboard scales easily with your business.


Reviews
There are no reviews yet.