Running a Restaurants and Food Services Dashboard business without clear data visibility is risky. Every sale, every food item, every cost, and every customer rating directly impacts profitability. However, when this data stays scattered across multiple Excel files and manual reports, decision-making becomes slow and inaccurate.
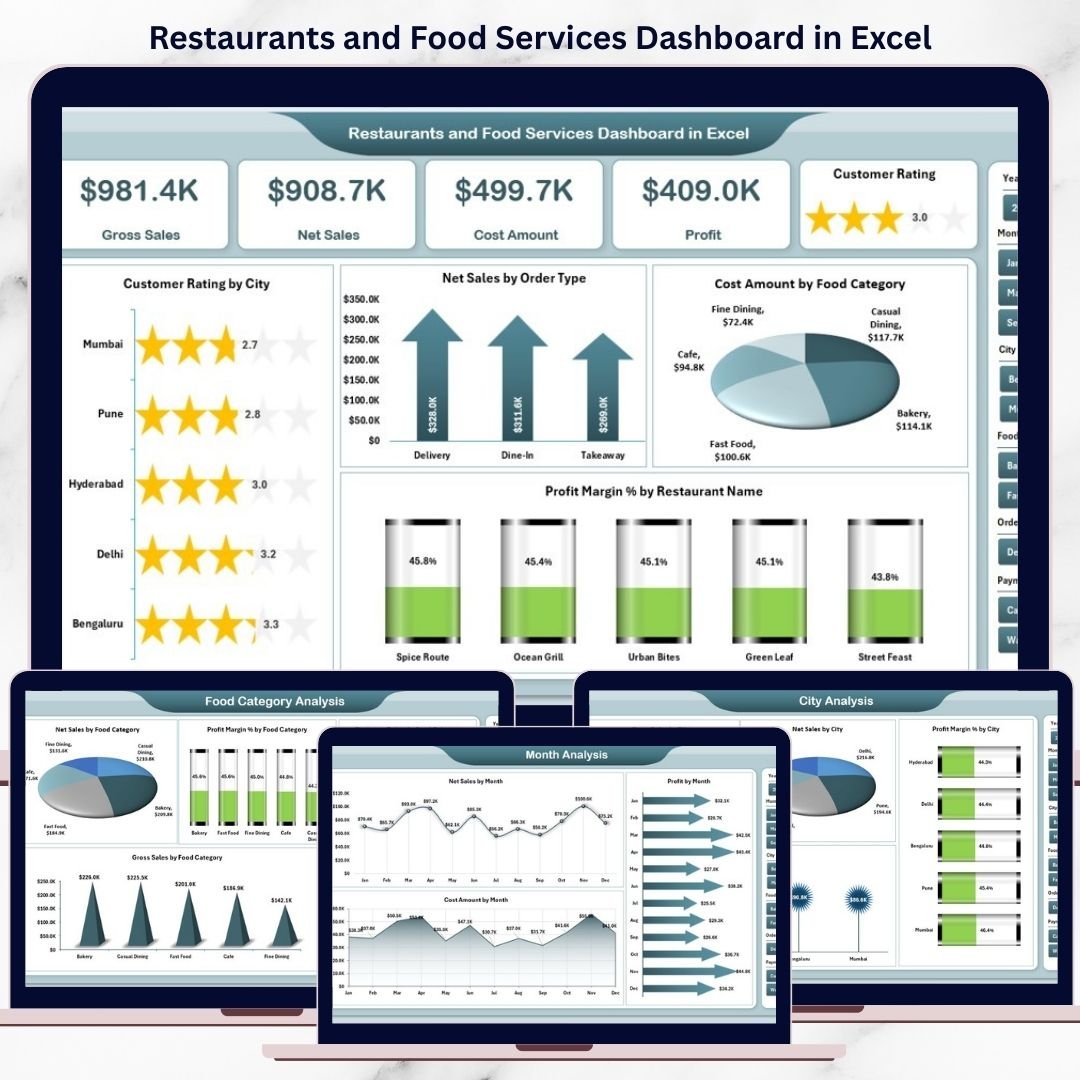
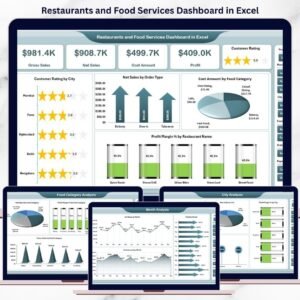
The Restaurants and Food Services Dashboard in Excel is a ready-to-use, interactive performance analytics solution that brings sales, costs, profits, customer ratings, restaurants, cities, food categories, and monthly trends into one powerful Excel dashboard. Instead of juggling reports, you gain instant, visual insights that help you control costs, improve margins, and enhance customer satisfaction.
This dashboard turns raw restaurant data into clear, actionable business intelligence—without expensive software or technical complexity.
🚀 Key Features of Restaurants and Food Services Dashboard in Excel
📊 Centralized Restaurant Performance Tracking – One dashboard for all insights
🧭 Left-Side Page Navigator – Fast and professional navigation
🎯 Right-Side Interactive Slicers – Filter data instantly
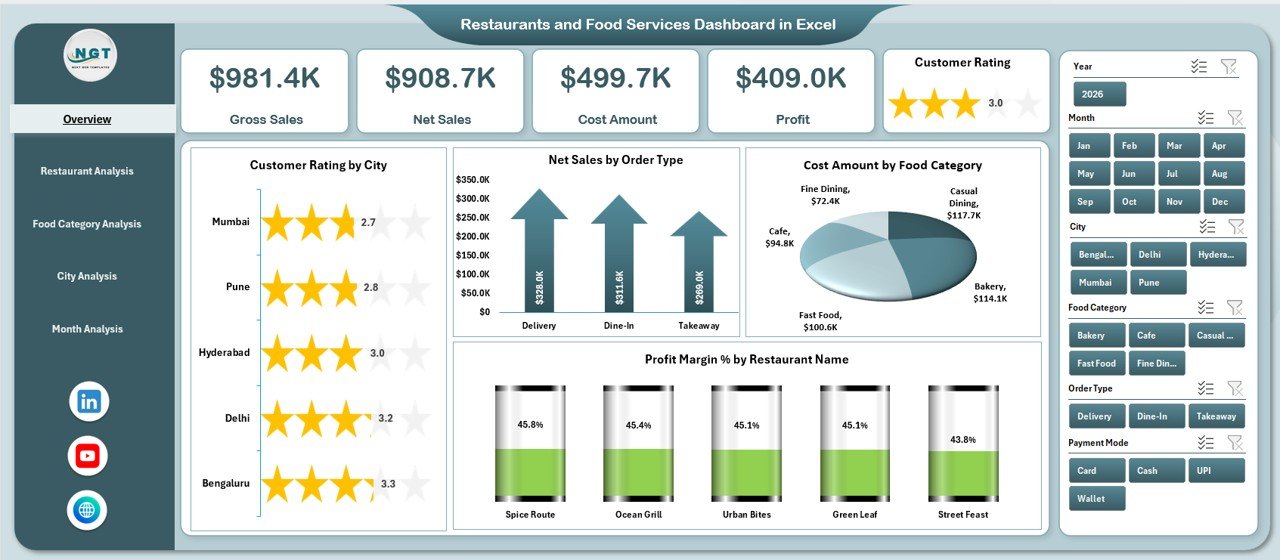
📈 KPI Cards for Quick Insights – View performance at a glance
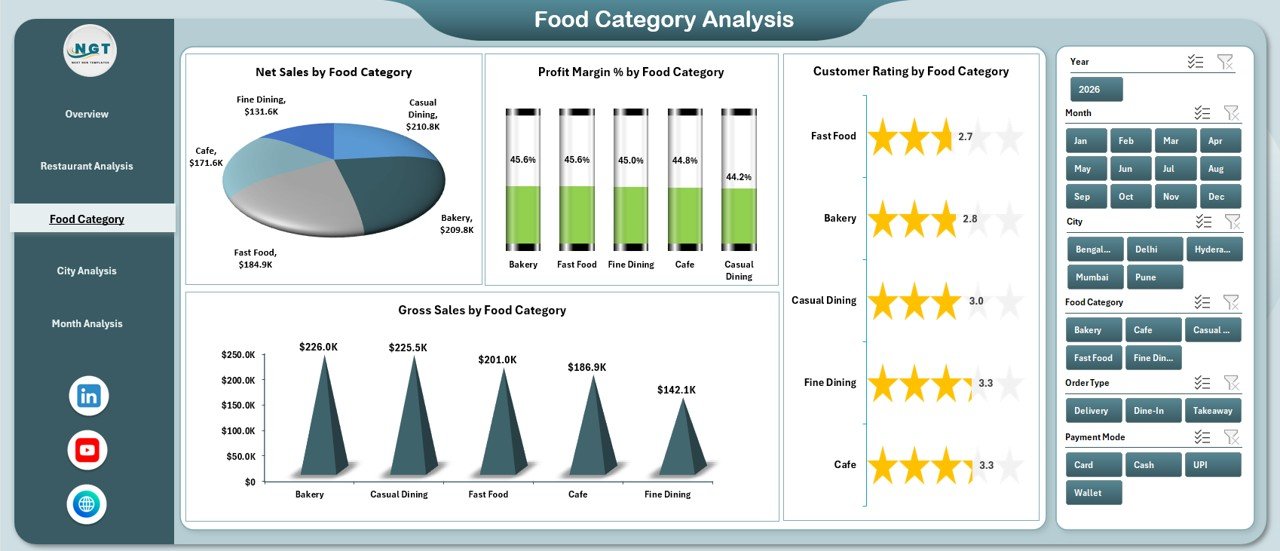
🍔 Food Category Analysis – Identify high-margin menu items
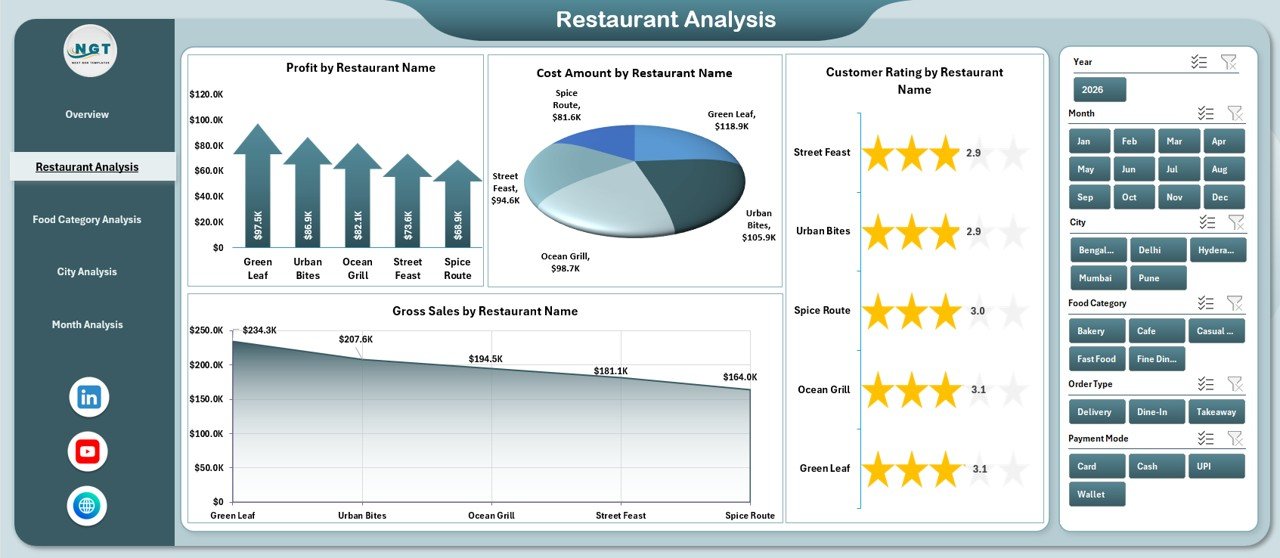
🏪 Restaurant-Wise Performance – Compare outlets easily
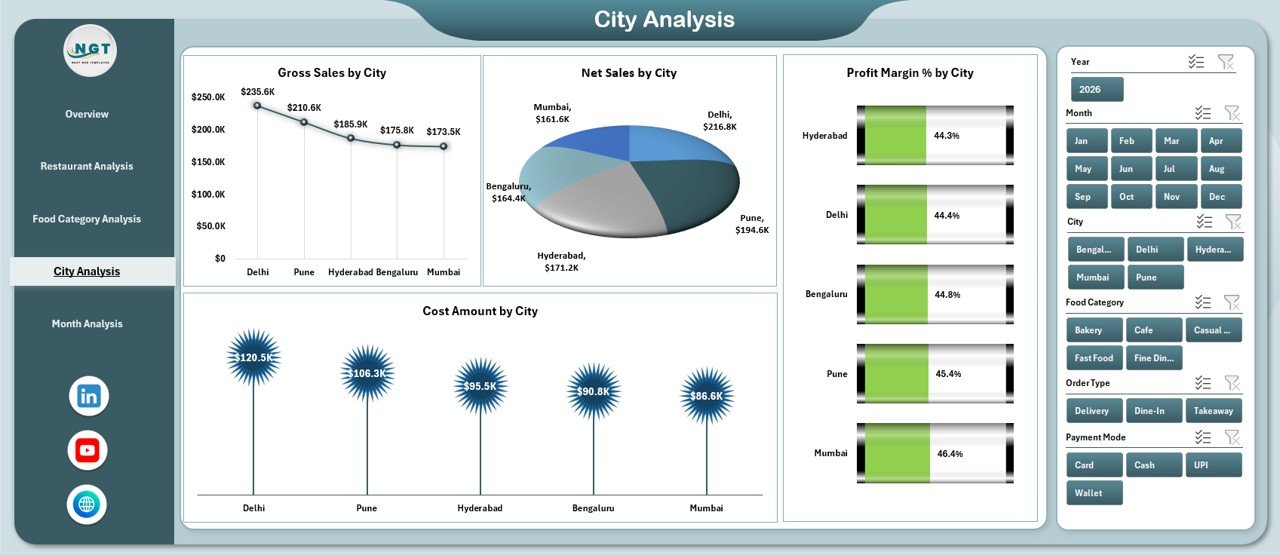
🌆 City-Level Analysis – Understand location-based trends
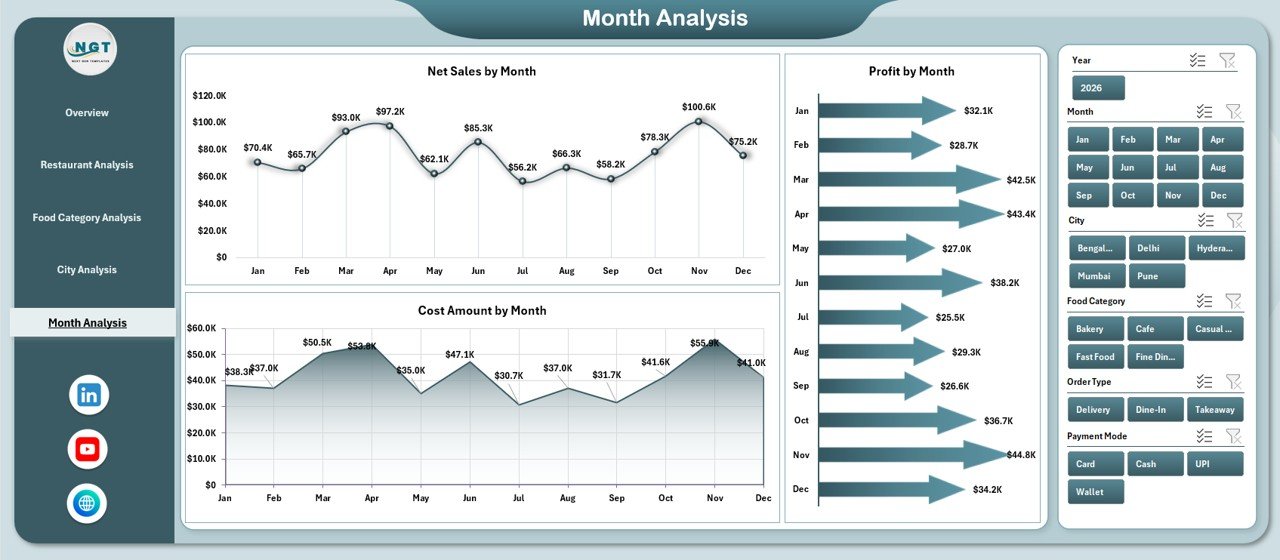
📅 Monthly Trend Analysis – Track seasonality and growth
💰 Sales, Cost & Profit Visibility – Improve margin control
🧠 100% Excel-Based Dashboard – No VBA, no external tools
📦 What’s Inside the Restaurants and Food Services Dashboard in Excel
📁 Professional Excel Dashboard File with clean, business-ready design
🏠 Overview Page – High-level snapshot of restaurant performance
🏪 Restaurant Analysis Page – Outlet-wise sales, cost, profit & ratings
🍕 Food Category Analysis Page – Menu performance insights
🌆 City Analysis Page – Location-wise profitability & costs
📆 Month Analysis Page – Time-based trends and patterns
📄 Data Sheet – Centralized raw data storage
🧮 Support Sheet – Helper calculations and mappings
Everything is structured for clarity, flexibility, and scalability.
🧠 How to Use the Restaurants and Food Services Dashboard in Excel
1️⃣ Enter or update restaurant data in the Data Sheet
2️⃣ Refresh pivot tables (if required)
3️⃣ Navigate pages using the left-side Page Navigator
4️⃣ Apply right-side slicers to filter by restaurant, city, category, or month
5️⃣ Review KPIs and charts on each analysis page
6️⃣ Use insights to optimize menu, pricing, locations, and costs
No advanced Excel knowledge is required. If you can use Excel, you can use this dashboard confidently.
👥 Who Can Benefit from This Restaurants and Food Services Dashboard in Excel
🍽️ Restaurant Owners & Managers – Monitor performance easily
🏢 Food Chain & Franchise Operators – Compare outlets & cities
📊 Finance & Operations Teams – Improve cost control
📈 Business Analysts & Consultants – Deliver quick insights
💼 Decision-Makers & Executives – Get instant business clarity
This dashboard works perfectly for single restaurants, food chains, franchises, and multi-city operations.
🔗 Click here to read the Detailed Blog Post
🎥 Visit our YouTube channel to learn step-by-step video tutorials
https://www.youtube.com/@PKAnExcelExpert


Reviews
There are no reviews yet.