Research & Development Institutes Dashboard sit at the core of innovation, scientific advancement, and long-term economic growth. Whether the focus is technology, healthcare, energy, biotechnology, or social research, R&D leaders must continuously balance projects, budgets, impact, and collaboration outcomes. However, when data remains scattered across Excel files, PDFs, and departmental reports, leadership loses clarity. That is exactly where the Research & Development Institutes Dashboard in Power BI becomes a strategic game-changer.
This ready-to-use Power BI dashboard converts complex R&D data into a single, centralized, and decision-ready analytics system. Instead of spending hours consolidating reports, institute heads, program managers, and finance teams gain instant visibility into project progress, budget utilization, research impact, departmental efficiency, and funding performance. As a result, decisions become faster, clearer, and backed by real evidence rather than assumptions.
Because this dashboard is built in Power BI and connects seamlessly with Excel or enterprise data sources, it offers both flexibility and analytical power. You can filter performance by department, research domain, funding source, collaboration type, or time period using interactive slicers. Consequently, leadership meetings become more focused, transparent, and outcome-driven.
🔑 Key Features of Research & Development Institutes Dashboard in Power BI
📊 Centralized R&D Performance Tracking – Monitor projects, budgets, impact, and variance in one dashboard
🎯 Executive KPI Cards – Instantly view total projects, ongoing %, impact ratings, and budget vs spend
🎛️ Interactive Slicers – Analyze performance by department, research domain, funding source, or month
📈 Variance & Budget Control Analysis – Identify overspending and underutilization early
🧠 Impact & Rating Visibility – Measure research quality alongside financial efficiency
⚡ Automated Power BI Visuals – Reduce manual reporting and improve data accuracy
📂 What’s Inside the Research & Development Institutes Dashboard in Power BI
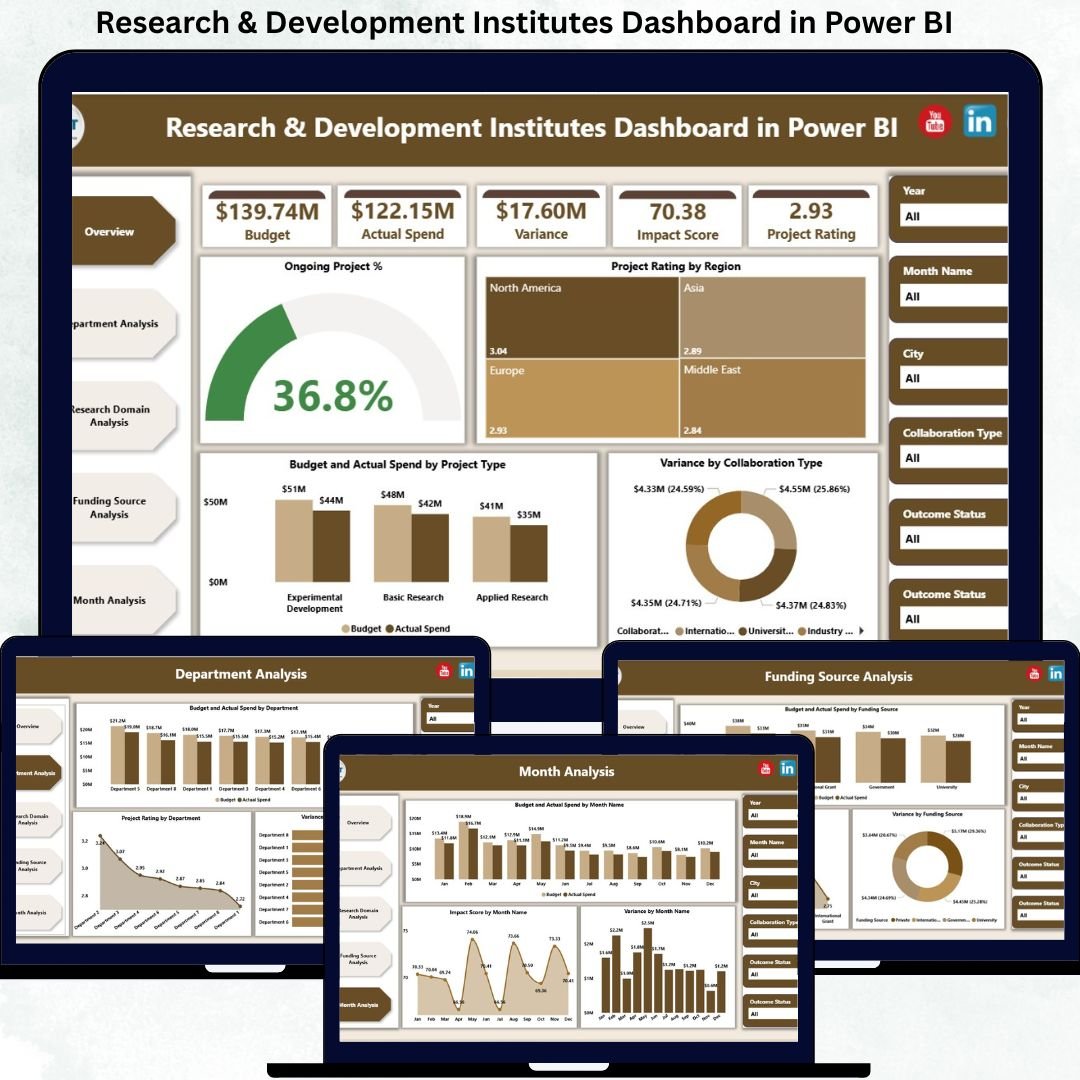
This professionally designed dashboard includes five structured analytical pages, each focused on a critical R&D decision area:
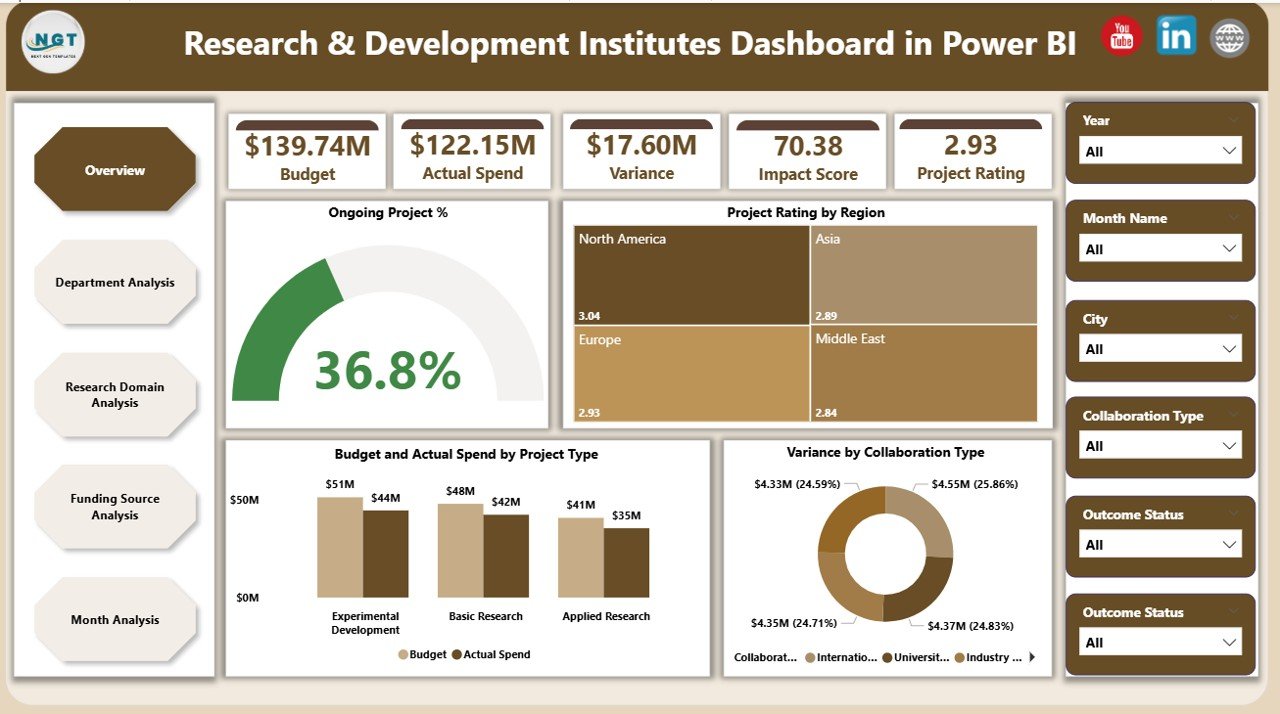
📊 Overview Page – The command center for leadership
-
KPI cards: Total Projects, Ongoing Project %, Average Project Rating, Budget vs Actual Spend
-
Charts:
-
Ongoing Project %
-
Project Rating by Region
-
Budget vs Actual Spend by Project Type
-
Variance by Collaboration Type
-
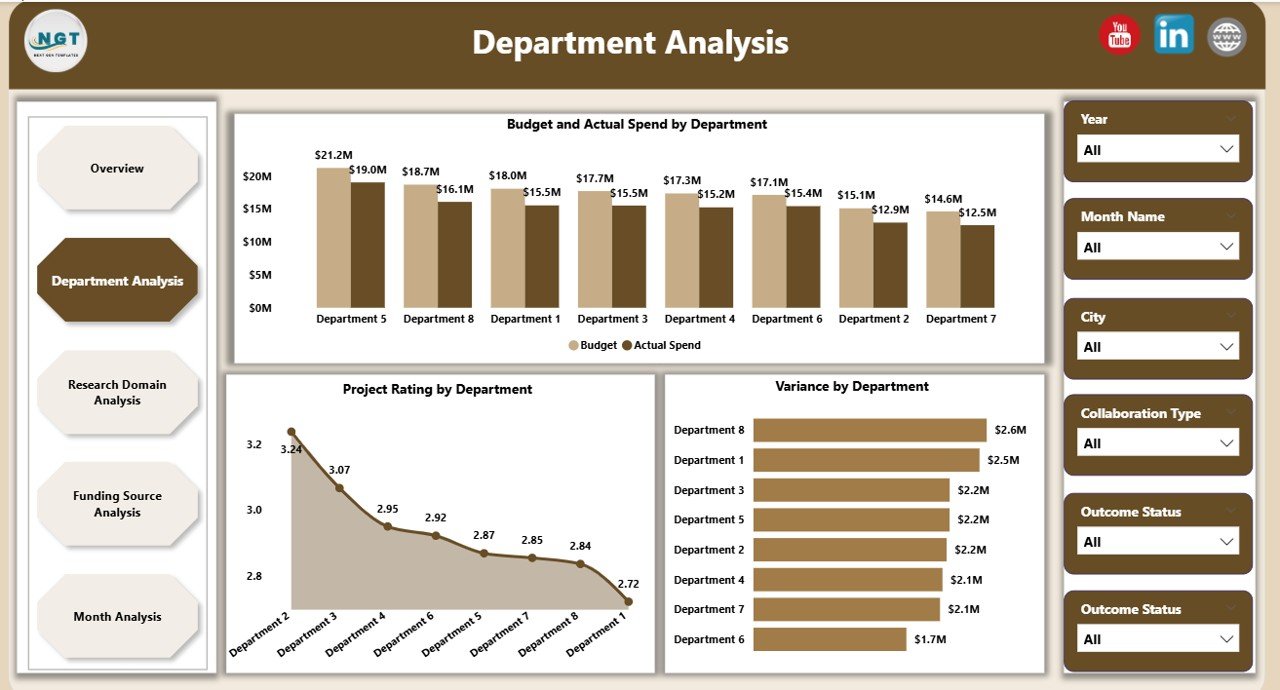
🏢 Department Analysis Page – Department-wise accountability
-
Budget vs Actual Spend by Department
-
Project Rating by Department
-
Variance by Department
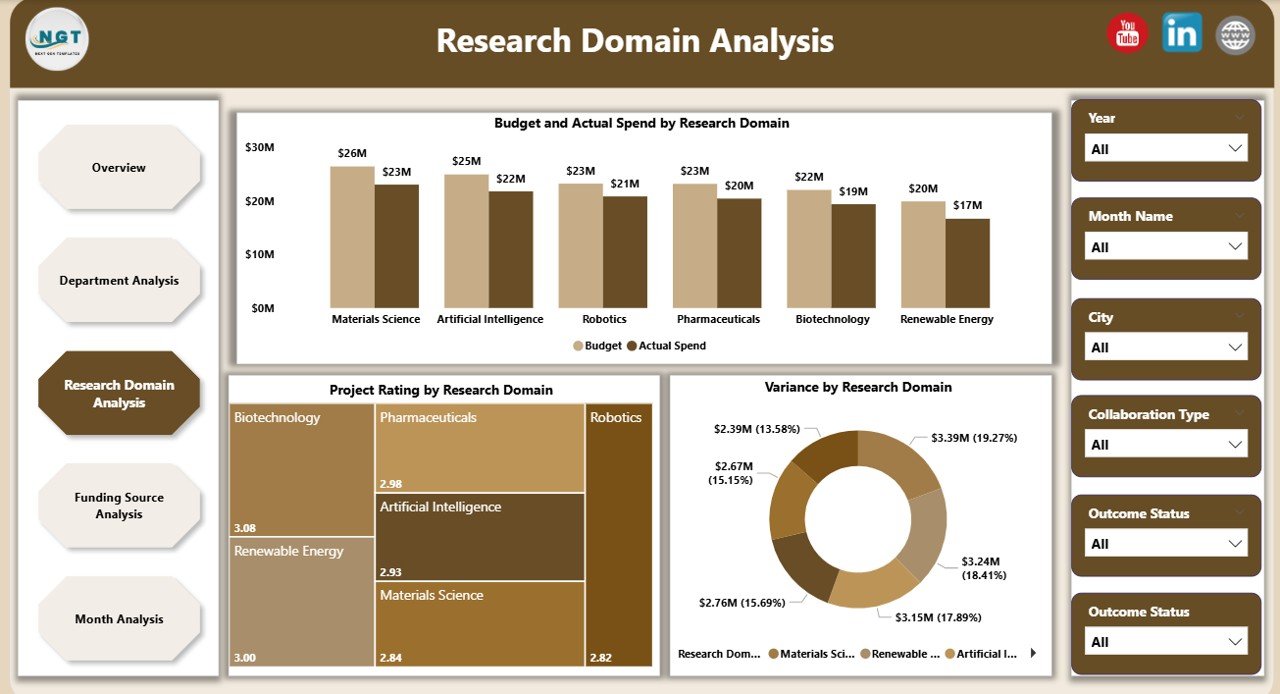
🔬 Research Domain Analysis Page – Domain-level performance comparison
-
Budget vs Actual Spend by Research Domain
-
Project Rating by Research Domain
-
Variance by Research Domain
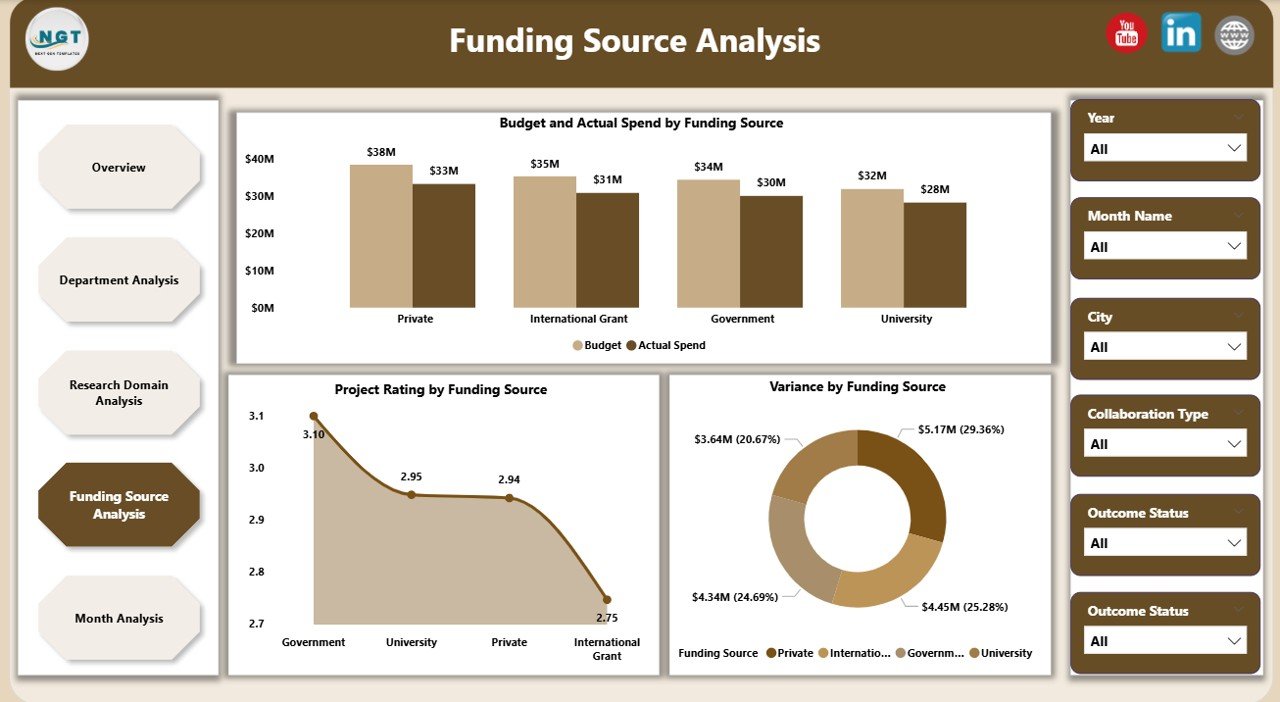
💰 Funding Source Analysis Page – Financial governance and transparency
-
Budget vs Actual Spend by Funding Source
-
Project Rating by Funding Source
-
Variance by Funding Source
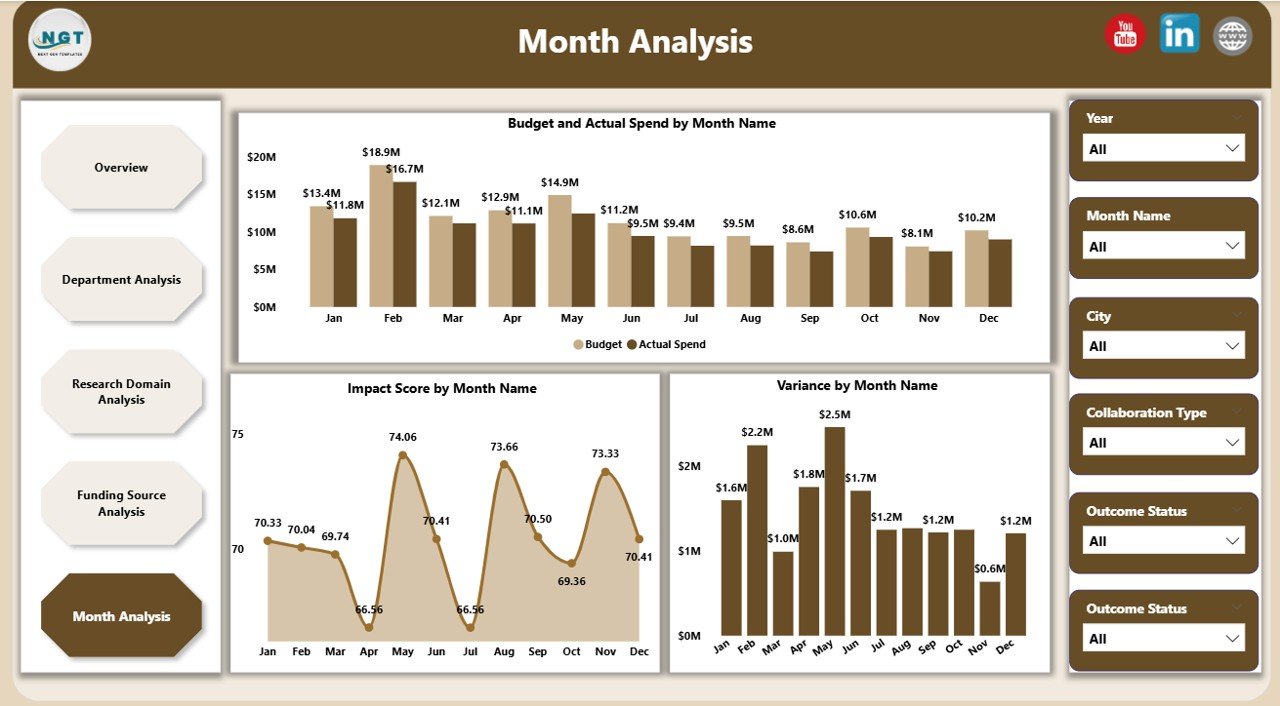
📅 Monthly Analysis Page – Time-based trends and forecasting
-
Budget vs Actual Spend by Month
-
Impact Score by Month
-
Variance by Month
All pages respond dynamically to slicers, allowing users to move seamlessly from high-level strategy to detailed insights.
▶️ How to Use the Research & Development Institutes Dashboard in Power BI
1️⃣ Connect Excel, database, or enterprise data sources
2️⃣ Refresh the Power BI file to update all visuals
3️⃣ Use slicers to filter by department, domain, funding source, or time
4️⃣ Review KPIs, variance, and impact trends
5️⃣ Use insights to optimize funding, prioritize projects, and improve outcomes
No advanced Power BI development skills are required for daily use.
👥 Who Can Benefit from This Research & Development Institutes Dashboard in Power BI
This dashboard is ideal for:
🔬 Research Directors & Institute Heads
🏢 Department & Program Managers
💰 Finance & Grants Management Teams
📊 Strategy & Planning Committees
🏛️ Government & Funding Agencies
Each stakeholder gains clarity, accountability, and confidence in decision-making.
### 👉 Click here to read the Detailed Blog Post
Visit our YouTube channel to learn step-by-step video tutorials.


Reviews
There are no reviews yet.