Research & Development (R&D) institutes handle multiple projects, diverse research domains, complex funding sources, and strict timelines. Without a proper reporting system, leaders struggle to track performance, monitor budgets, evaluate impact, and make fast decisions. This is why every modern R&D institution needs a Research & Development Institutes Dashboard in Excel—a powerful, structured, and fully interactive reporting solution built for clarity and speed.
This ready-to-use dashboard consolidates all essential project, financial, and research KPIs into one smart Excel file. With slicers, KPI cards, and clean analytical pages, R&D teams can instantly review project status, budget utilization, delays, and research outcomes—all without switching between spreadsheets. It is designed for directors, project managers, finance teams, coordinators, and analysts who want clear visibility and accurate insights at every level.
⚡ Key Features of the Research & Development Institutes Dashboard in Excel
This dashboard includes five analytical pages, a left-side Page Navigator, right-side slicers, interactive visuals, and a structured data engine. Each page is built to support fast analysis, better decision-making, and deeper research understanding.
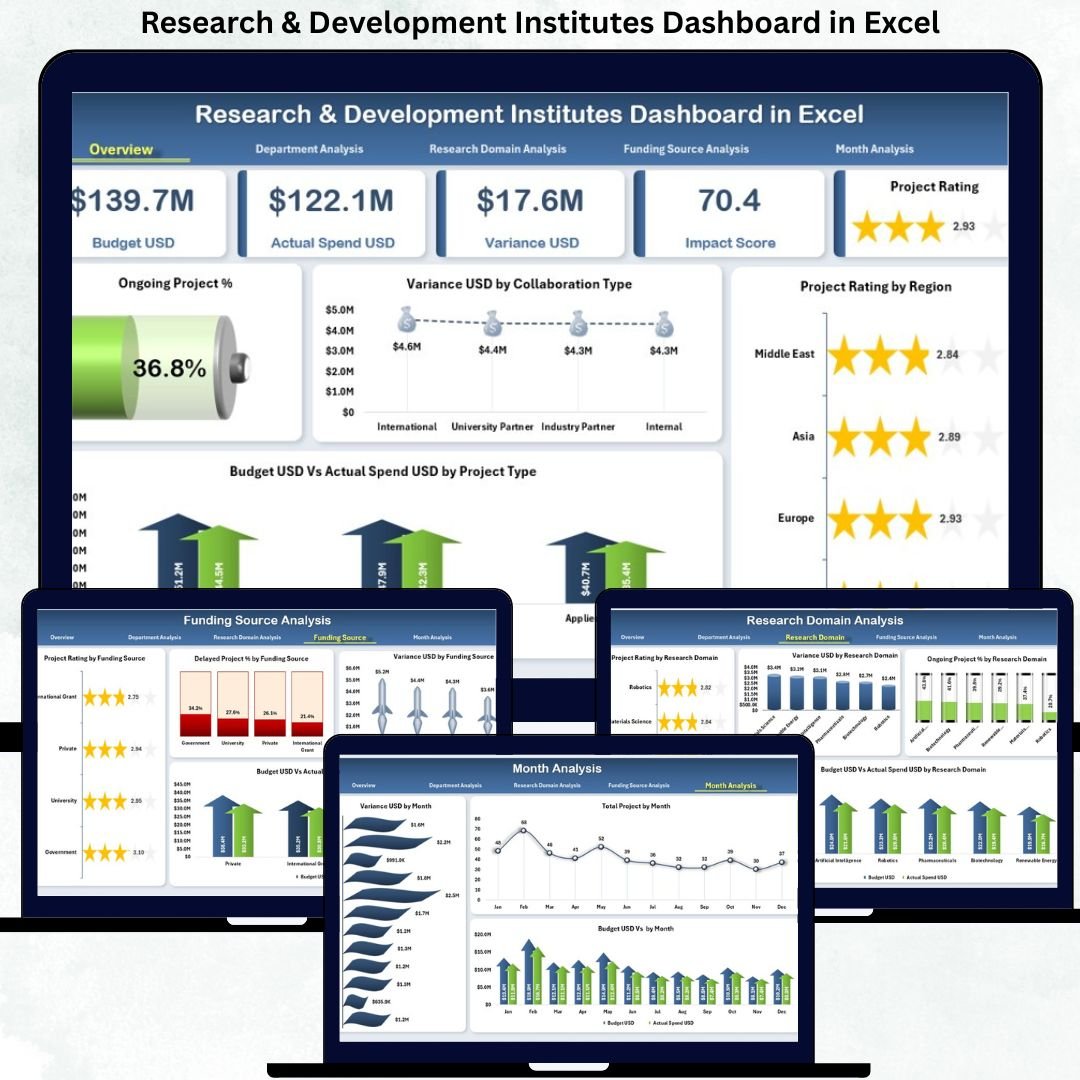
📊 Overview Page – The Complete R&D Performance Snapshot
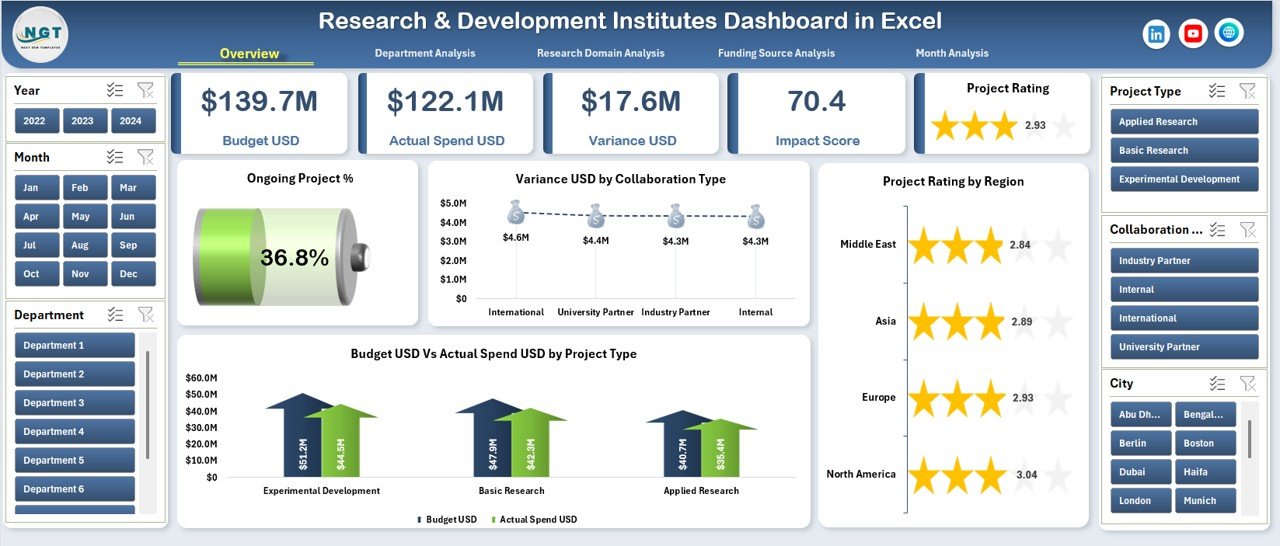
The Overview Page provides a high-level summary of institute-wide performance.
You get:
-
🎛 Right-Side Slicers for filtering by department, project type, funding source, or time period
-
🧮 Five KPI Cards showing
-
Total Projects
-
Ongoing Project %
-
Budget Utilization
-
Variance (USD)
-
Overall Project Performance
-
-
📈 Key Charts:
-
Ongoing Project % – tracks workload distribution
-
Variance USD by Collaborating Type – highlights partnership-related cost deviations
-
Project Rating by Region – compares regional performance
-
Budget USD vs Actual Spend USD by Project Type – identifies overspending or underutilization
-
This page gives a bird’s-eye view of R&D health within seconds.
🧬 What’s Inside the Research & Development Institutes Dashboard in Excel
You receive a fully structured Excel reporting system that includes:
-
📁 Complete Excel Dashboard File
-
🎛 Interactive Slicers for dynamic filtering
-
📊 KPI Cards + Analytical Charts
-
📝 Data Sheet with structured tables
-
🧩 Support Sheet for reference codes & mappings
-
⚡ Fully automated visuals—no formulas to adjust manually
-
🧭 Left navigation buttons for seamless page movement
This complete package works perfectly for both small labs and large multi-department institutes.
🔧 How to Use the Research & Development Institutes Dashboard
1️⃣ Update the Data Sheet with new project, budget, and performance information.
2️⃣ Refresh pivot tables (one click).
3️⃣ Use slicers to filter by department, domain, funding, or month.
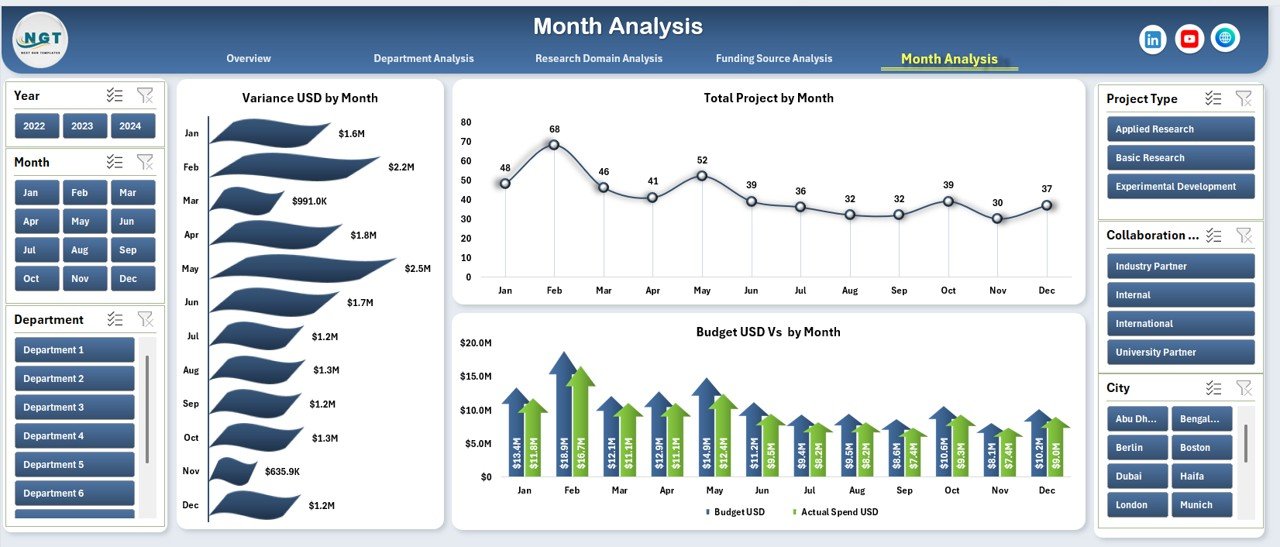
4️⃣ Analyze Overview, Department, Domain, Funding, and Monthly pages.
5️⃣ Identify variances, delays, or high-impact projects instantly.
6️⃣ Share insights with management for better planning and approvals.
No special training or additional software is required—Excel handles everything.
👥 Who Can Benefit from This Dashboard?
This dashboard is ideal for:
-
🧪 R&D Directors & Institute Leaders
-
📊 Project Managers & Coordinators
-
💰 Finance & Grant Management Teams
-
🧬 Research Domain Heads
-
🧑💼 Administrative & Compliance Teams
-
🧑🔬 Scientists managing cross-department projects
Any organization that wants transparency, accountability, and data-driven decision-making will benefit immediately.
### Click here to read the Detailed blog post
Visit our YouTube channel to learn step-by-step video tutorials
👉 Youtube.com/@PKAnExcelExpert


Reviews
There are no reviews yet.