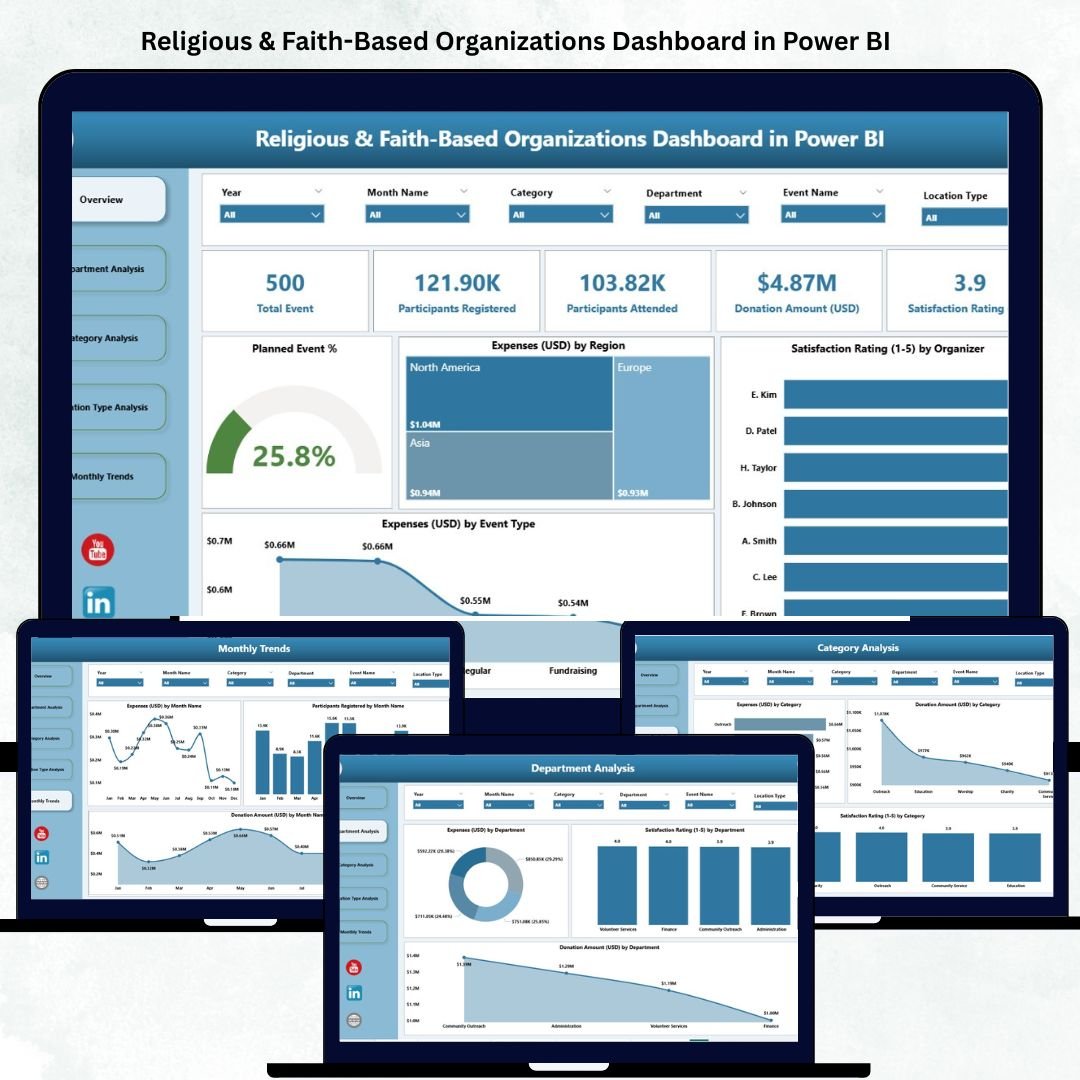
Faith-based organizations are evolving — adopting digital tools to strengthen transparency, accountability, and community engagement. From managing donations and tracking events to evaluating member satisfaction, data now plays a vital role in supporting the mission and impact of religious institutions.
That’s where the Religious & Faith-Based Organizations Dashboard in Power BI comes in — a powerful, ready-to-use business intelligence tool designed to help churches, mosques, temples, ministries, and other faith-based groups monitor their activities, finances, and engagement metrics with ease. 🌍📊
Built entirely in Microsoft Power BI, this dashboard consolidates your organization’s data — from donations and events to expenses and satisfaction scores — into one visual, interactive platform. It empowers leaders to make data-driven decisions that align with their mission, while ensuring transparency and stewardship at every level.
🌟 Key Features of the Religious & Faith-Based Organizations Dashboard in Power BI
⛪ Overview Page – The Central Hub of Insights
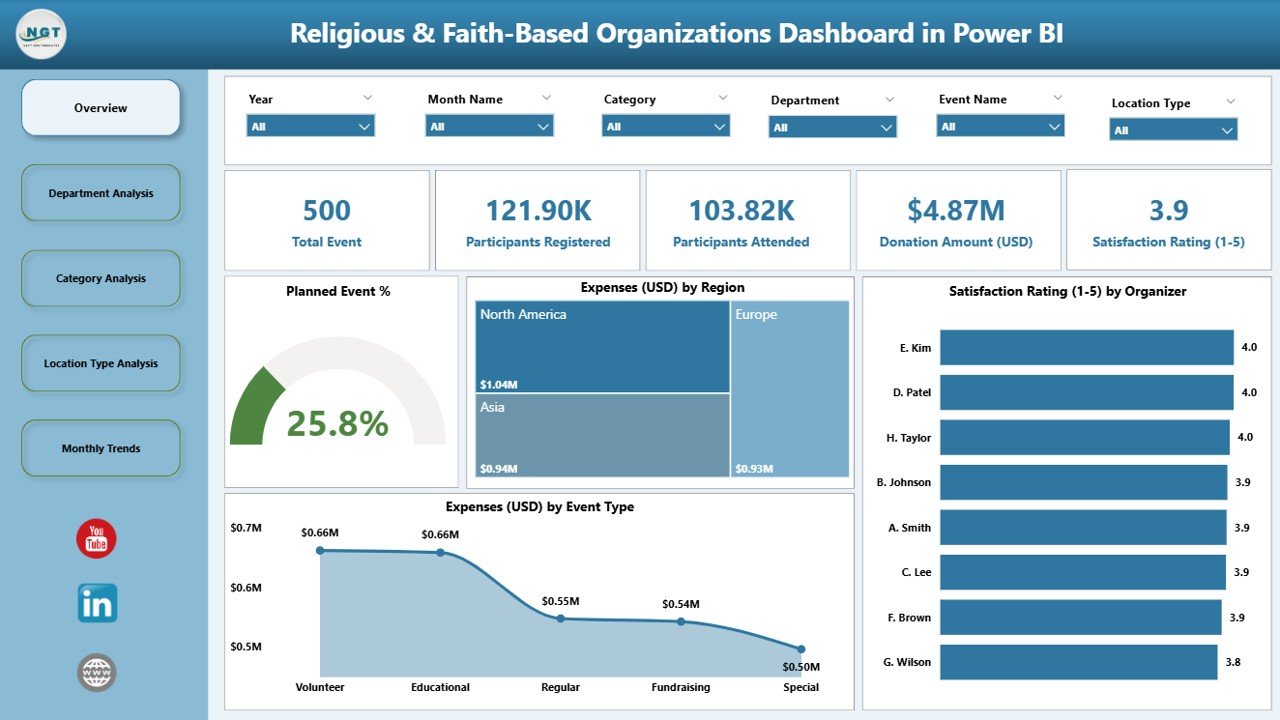
View your organization’s overall health at a glance.
-
KPI Cards: Show metrics such as Planned Event %, Total Donations, Total Expenses, and Average Satisfaction Rating.
-
Interactive Charts:
-
Planned Event % – Monitor event completion and adherence.
-
Expenses (USD) by Region – Compare spending across locations.
-
Satisfaction Rating (1–5) by Organizer – Assess event quality and participant happiness.
-
Expenses (USD) by Event Type – Analyze cost distribution across categories such as community outreach, prayer sessions, or charity drives.
-
This page provides faith leaders a clear understanding of financial and engagement performance.
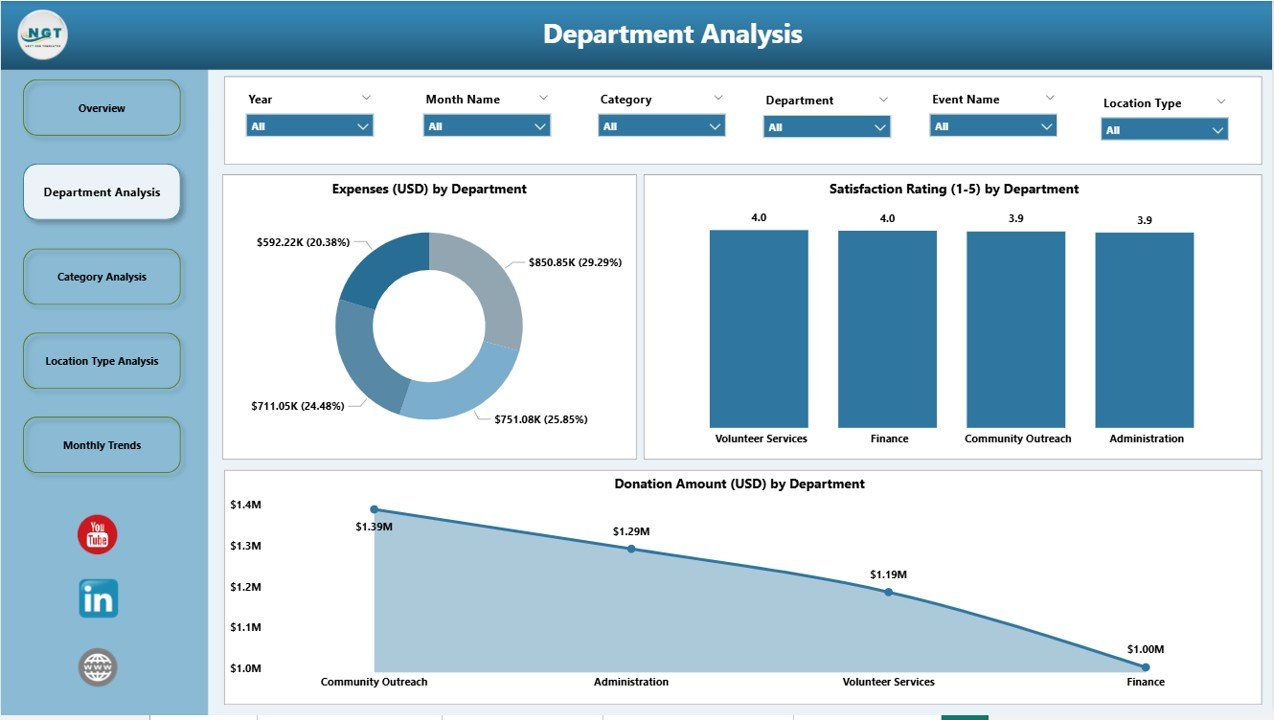
🕊️ Department Analysis Page
Evaluate how each department contributes to your mission and financial success.
-
Event (USD) by Department
-
Satisfaction Rating (1–5) by Department
-
Donation Amount (USD) by Department
Gain clarity on which ministries (e.g., youth, outreach, finance, administration) are thriving and which need more attention or support.
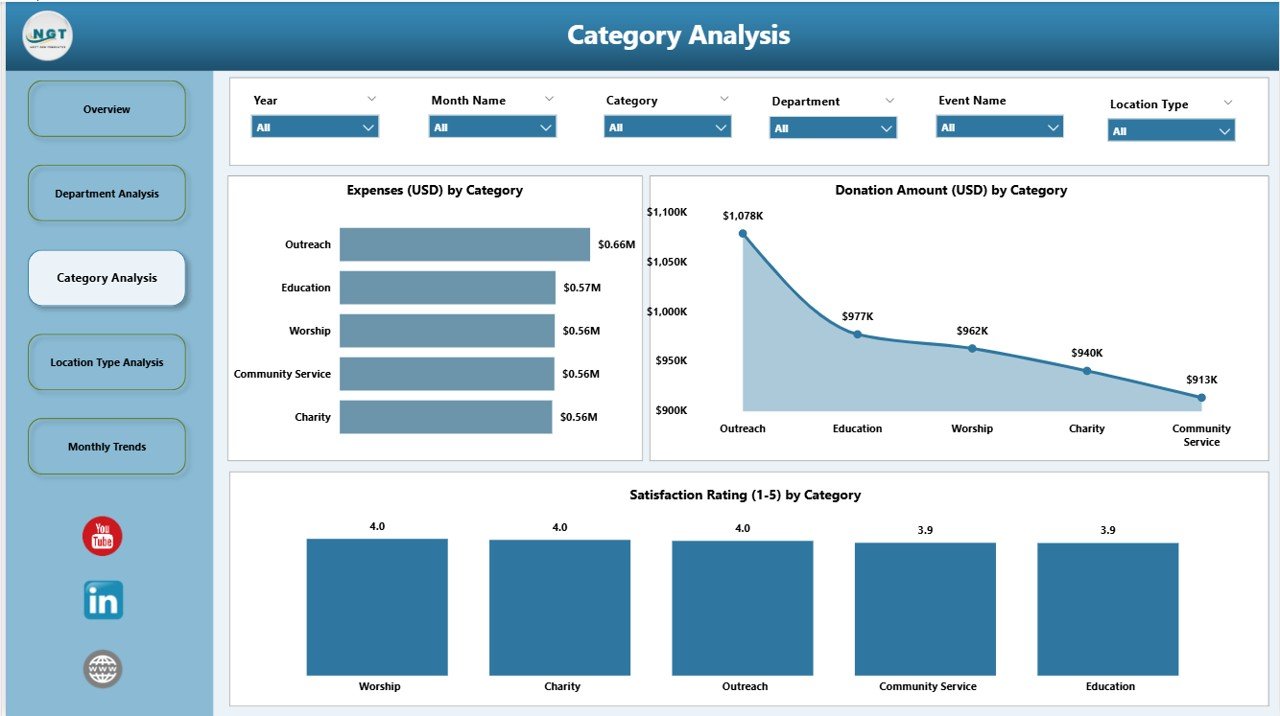
📂 Category Analysis Page
Understand program effectiveness by type — fundraising, volunteer initiatives, education, or worship.
-
Event (USD) by Category
-
Satisfaction Rating (1–5) by Category
-
Donation Amount (USD) by Category
This page helps identify which activities have the highest engagement, impact, and donation potential.
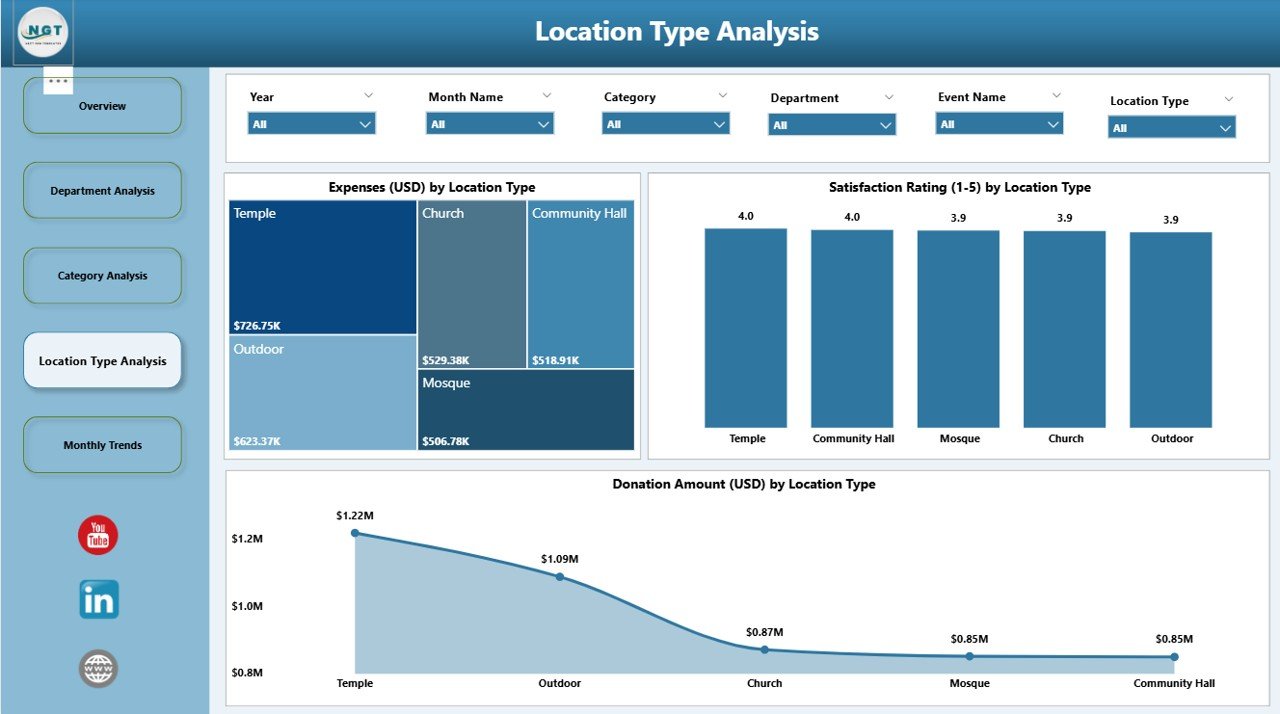
📍 Location Type Analysis Page
Track performance across different locations or branches.
-
Event (USD) by Location Type
-
Satisfaction Rating (1–5) by Location Type
-
Donation Amount (USD) by Location Type
Ideal for multi-branch ministries, regional churches, or global missions looking to understand geographic performance patterns.
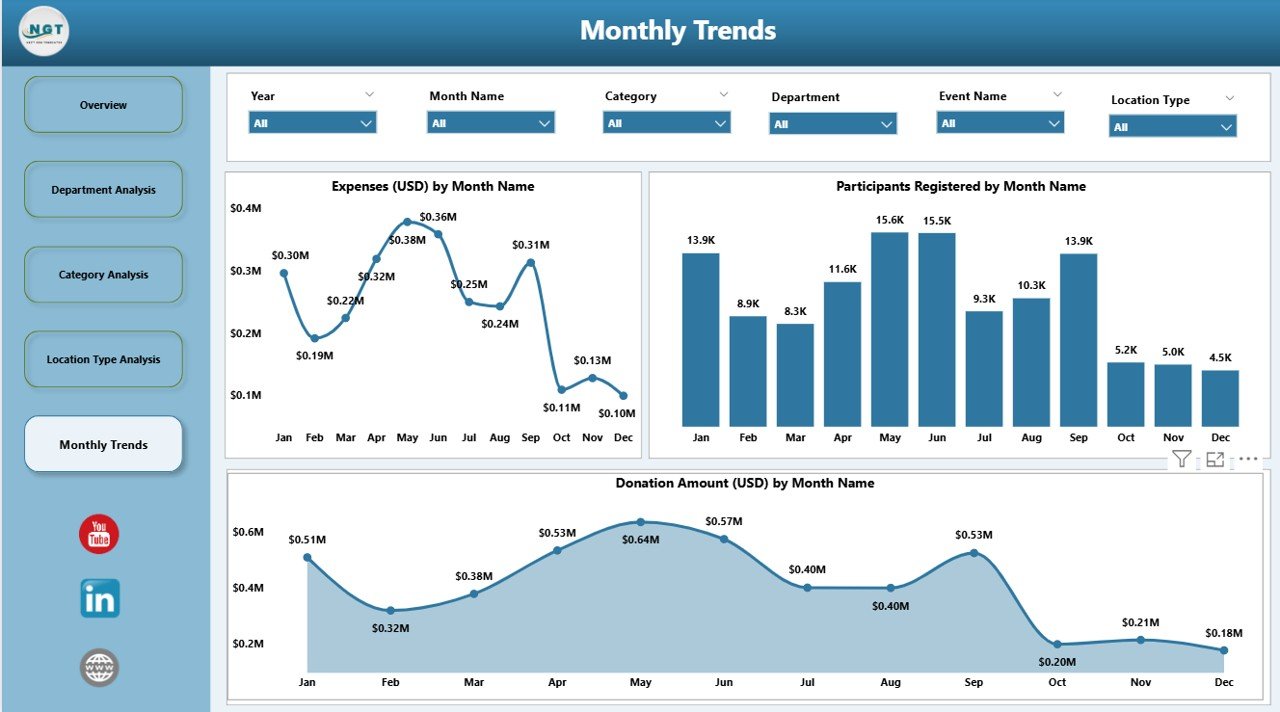
📆 Monthly Trends Page
Analyze progress and patterns over time.
-
Event (USD) by Month
-
Donation Amount (USD) by Month
-
Participants Registered by Month
Identify peak seasons for events and donations, helping you plan campaigns and community activities strategically.
📦 What’s Inside the Dashboard
✅ 5 Interactive Pages: Overview, Department, Category, Location Type, and Monthly Trends
✅ Dynamic Slicers: Filter by region, month, or department for tailored insights
✅ Auto-Updating KPIs: See real-time results with each data refresh
✅ Drill-Down Analysis: Click to explore details by location, event, or department
✅ Professional Visual Design: Built for clarity, accountability, and impact
🧭 How to Use the Dashboard
1️⃣ Connect Your Data: Import from Excel, Google Sheets, or donor management systems.
2️⃣ Refresh Automatically: Keep reports up to date with Power BI’s auto-refresh.
3️⃣ Explore with Filters: Use slicers to analyze by event, category, or location.
4️⃣ Drill Down into Details: View performance by department or monthly trend.
5️⃣ Share Securely: Publish to Power BI Service for team and board access.
No technical experience required — just open, refresh, and start analyzing! ⚡
👥 Who Can Benefit
🛕 Church or Temple Administrators: Monitor donations, expenses, and attendance.
🤝 Community Outreach Teams: Track participation and engagement.
💰 Finance Departments: Ensure transparency and accountability in fund usage.
🎯 Event Coordinators: Analyze performance and satisfaction after programs.
📈 Leadership Boards: Evaluate ministry growth and make informed strategic decisions.
This dashboard brings faith and data together — making operations more effective, transparent, and aligned with purpose.
🌍 Why Choose This Power BI Dashboard
✔️ Centralized Data Management: Combine donations, expenses, and event metrics in one place.
✔️ Financial Transparency: Show donors and stakeholders where funds are used.
✔️ Better Decision-Making: Identify trends, strengths, and improvement areas.
✔️ Enhanced Engagement: Track satisfaction and participation across programs.
✔️ Customizable Design: Add KPIs, adjust visuals, and match your organization’s branding.
✔️ Scalable Solution: Perfect for small ministries or large multi-location organizations.
The Religious & Faith-Based Organizations Dashboard in Power BI empowers communities to lead with data, ensuring every event, dollar, and volunteer hour supports the greater mission. 🙌
### Click here to read the Detailed blog post
Visit our YouTube channel to learn step-by-step video tutorials


Reviews
There are no reviews yet.