Regulatory reporting is one of the most critical and sensitive responsibilities for organizations operating in regulated industries such as banking, insurance, healthcare, utilities, telecom, and financial services. Regulators demand accurate data, timely submissions, and complete transparency. However, many organizations still rely on manual spreadsheets, email follow-ups, and disconnected systems. As a result, compliance gaps increase, deadlines are missed, and audit pressure grows.
That is exactly why the Regulatory Reporting KPI Dashboard in Google Sheets becomes an essential compliance management solution.
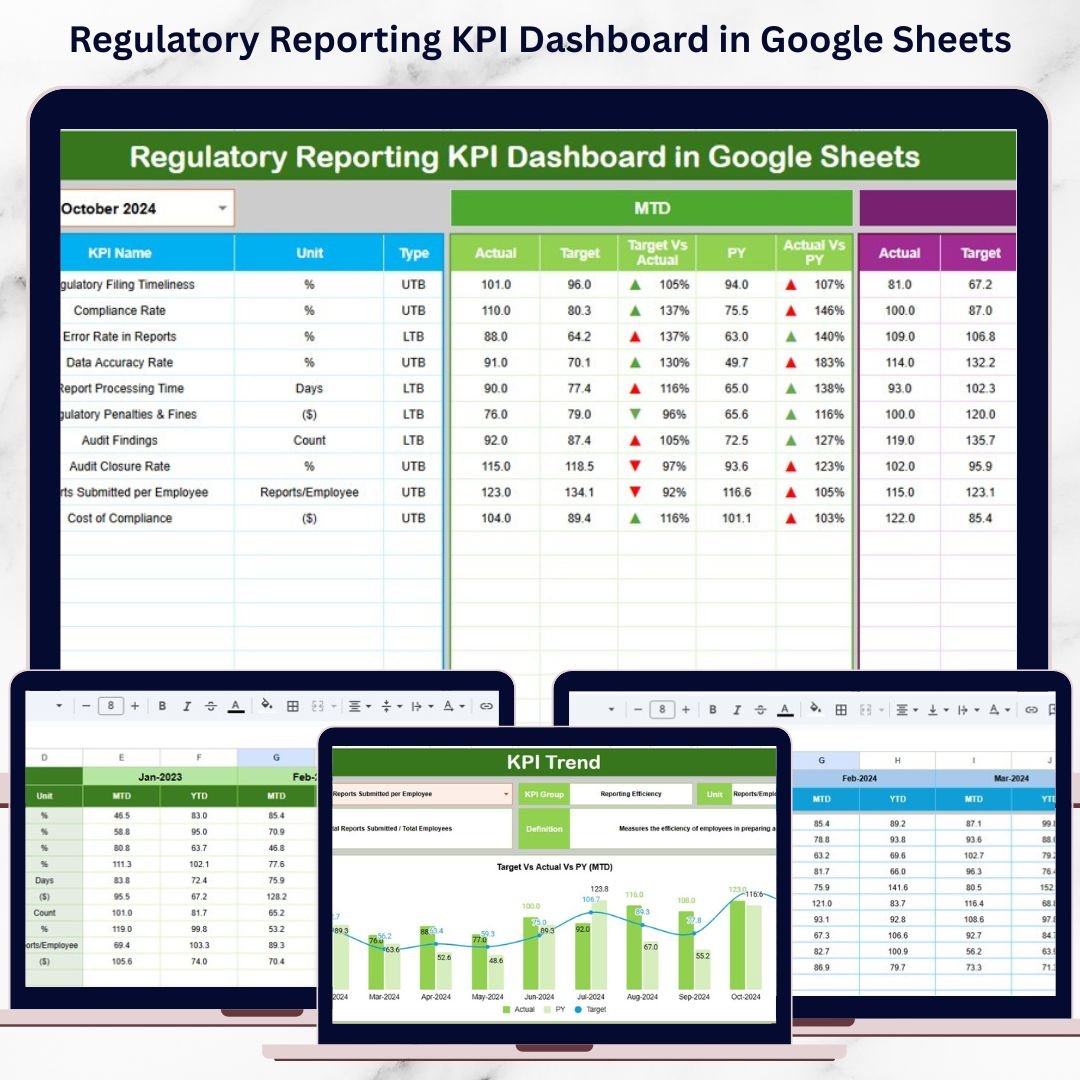
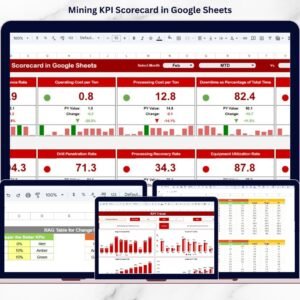
This ready-to-use dashboard converts regulatory reporting data into structured KPIs, automated calculations, and visual indicators. It enables compliance teams, risk managers, auditors, and senior leadership to track reporting timelines, submission accuracy, penalties, audit readiness, and performance trends—all in one centralized Google Sheets file. Instead of reacting to regulatory issues after they occur, teams gain proactive visibility and control.
Because the dashboard is built in Google Sheets, it supports real-time collaboration, easy updates, and zero software cost—making it ideal for organizations of all sizes.
✨ Key Features of the Regulatory Reporting KPI Dashboard in Google Sheets
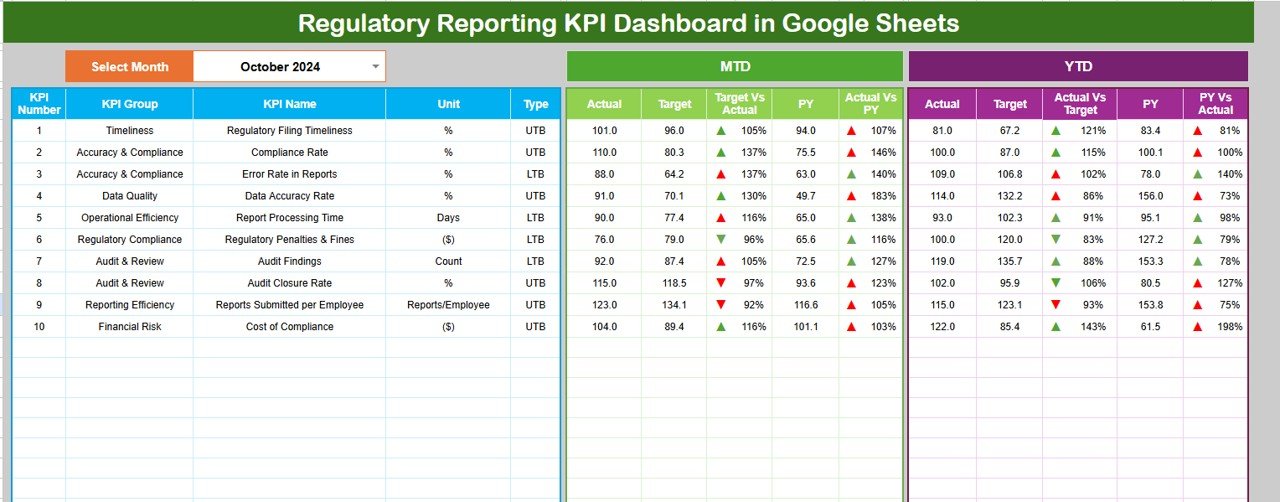
📊 1. MTD & YTD Regulatory Performance Tracking
Monitor Month-to-Date and Year-to-Date compliance performance for every KPI. Selecting a month instantly refreshes the dashboard.
🎯 2. Target vs Actual & Previous Year Comparison
Compare actual compliance performance against defined targets and last year’s benchmarks to measure improvement and maturity.
📈 3. Visual Compliance Indicators
Conditional formatting arrows provide instant clarity:
-
🟢 Green arrow → improving compliance
-
🔴 Red arrow → compliance risk or delay
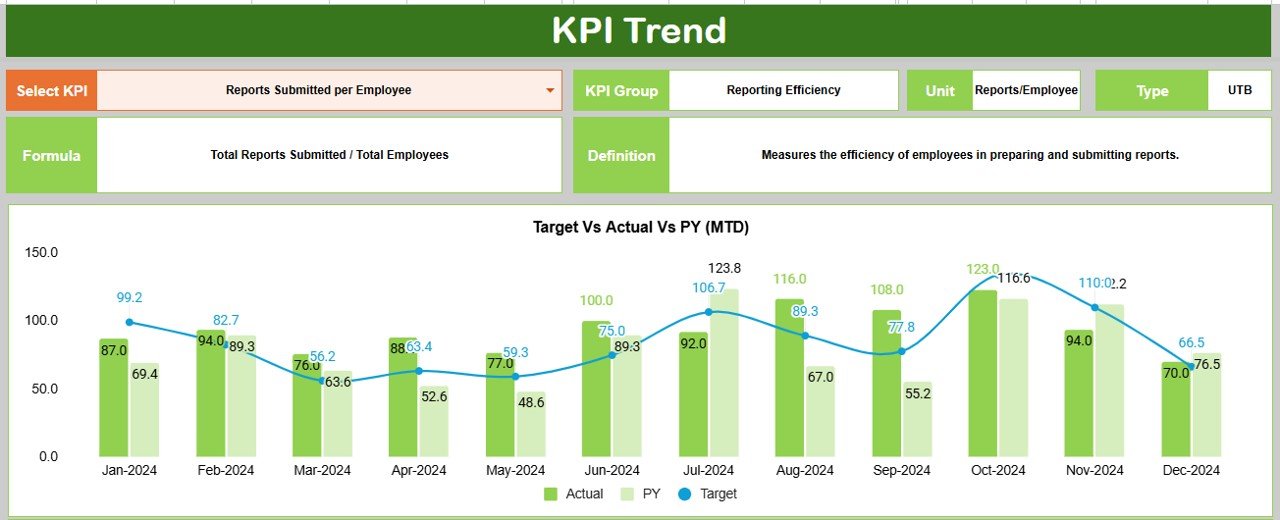
📉 4. KPI Trend Analysis
Analyze KPI behavior over time to identify recurring delays, process weaknesses, or systemic risks.
☁️ 5. Google Sheets-Based & Collaborative
Enable compliance, audit, and leadership teams to work together in real time with a single source of truth.
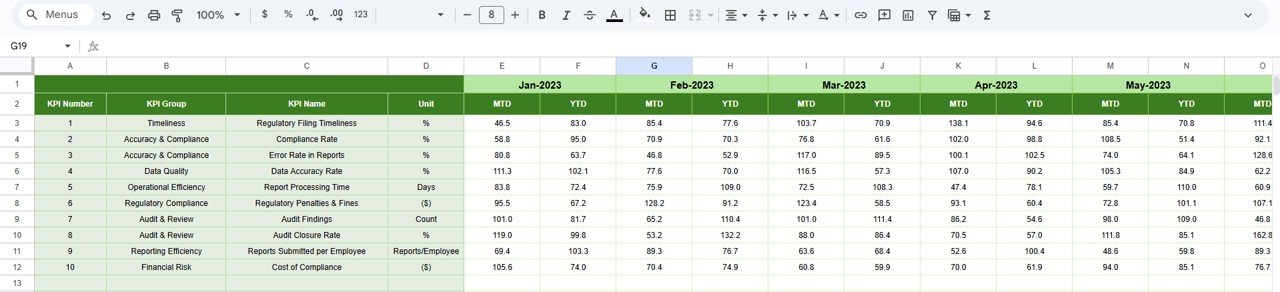
📦 What’s Inside the Regulatory Reporting KPI Dashboard in Google Sheets
🖥️ Dashboard Sheet Tab (Main Compliance View)
This is the primary page used during compliance reviews and management meetings.
Month Selector
-
Located in cell D3
-
Selecting a month updates all KPIs automatically
MTD Metrics Displayed
-
Actual
-
Target
-
Previous Year
-
Target vs Actual
-
Previous Year vs Actual
YTD Metrics Displayed
-
Actual
-
Target
-
Previous Year
-
Target vs Actual
-
Previous Year vs Actual
This structure gives leadership a quick yet complete view of regulatory performance.
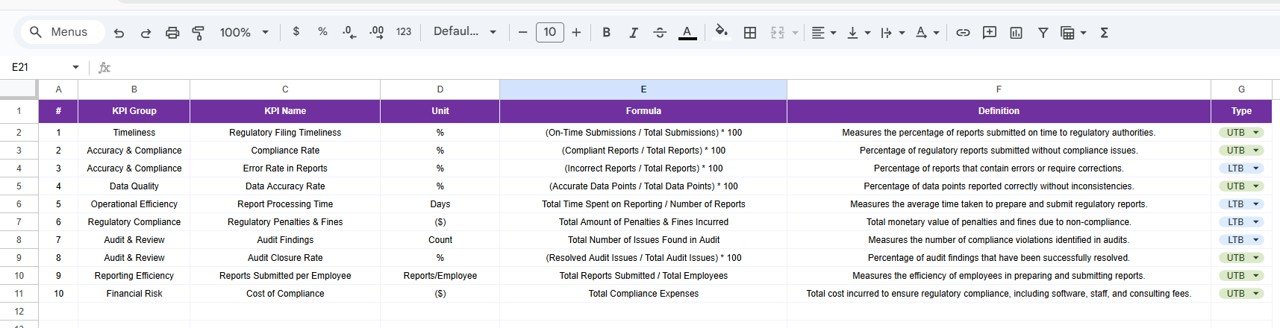
📊 KPI Trend Sheet Tab
This sheet supports deep-dive compliance analysis.
How It Works
-
Select a KPI from the dropdown in cell C3
Details Displayed
-
KPI Group
-
KPI Unit
-
KPI Type (LTB / UTB)
-
KPI Formula
-
KPI Definition
Trend Visualization
-
Month-wise KPI movement
-
Performance volatility
-
Early warning signs
This sheet is especially useful during audits and regulatory reviews.
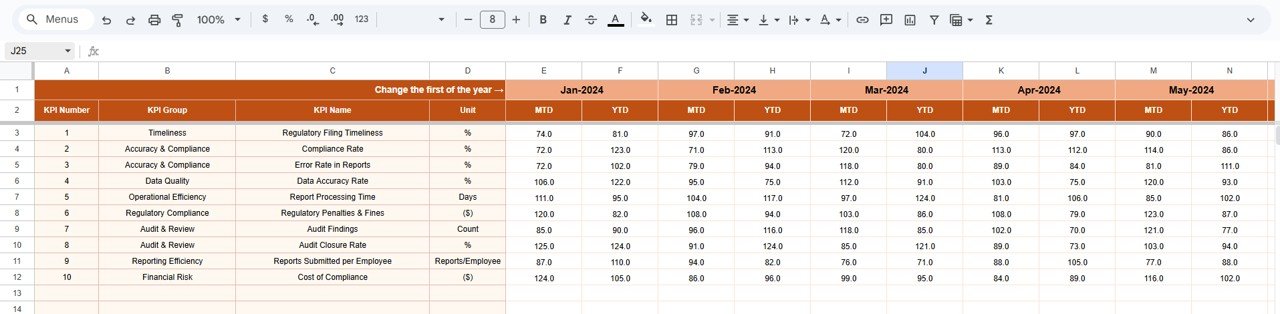
📋 Actual Number Sheet Tab
This is the data-entry sheet for compliance results.
-
Enter monthly MTD Actual values
-
Enter YTD Actual values
-
Set the first month of the year in cell E1
All dashboard metrics update automatically after data entry.
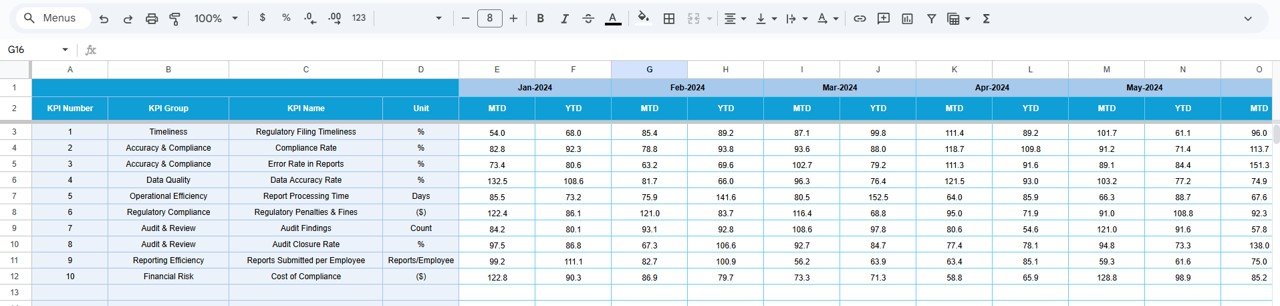
🎯 Target Sheet Tab
This sheet stores regulatory performance expectations.
-
Monthly (MTD) targets
-
Annual (YTD) targets
Targets help compliance teams measure effectiveness and accountability.
📆 Previous Year Number Sheet Tab
Stores last year’s regulatory performance data to support:
-
Year-over-year comparison
-
Trend improvement analysis
-
Compliance maturity assessment
📘 KPI Definition Sheet Tab
This is the governance and control layer of the dashboard.
It stores:
-
KPI Name
-
KPI Group
-
Unit
-
Formula
-
KPI Definition
-
KPI Type (LTB / UTB)
This ensures clarity, consistency, and audit readiness across the organization.
🎯 Who Can Benefit from This Regulatory Reporting KPI Dashboard
🛡️ Compliance Teams
Track submissions, delays, penalties, and accuracy proactively.
📊 Risk Management Teams
Identify compliance risks early using trend-based indicators.
🔍 Internal & External Auditors
Review regulatory performance with structured, documented KPIs.
🏢 Senior Management
Gain visibility into compliance health without operational complexity.
🏦 Regulated Industry Organizations
Strengthen governance and regulatory confidence.
### Click here to read the Detailed blog post
Watch the step-by-step video tutorial:


Reviews
There are no reviews yet.