Managing regulatory reporting can be complex and time-consuming. Our Regulatory Reporting KPI Dashboard in Excel simplifies the process by providing real-time insights into compliance, financial risk, audit performance, and operational efficiency. Designed for finance professionals, compliance teams, and risk managers, this dashboard ensures data accuracy, enhances reporting transparency, and helps organizations meet regulatory requirements with ease.
Key Features of the Regulatory Reporting KPI Dashboard
Our KPI Dashboard includes seven dedicated sheets, each structured for seamless navigation, easy data entry, and insightful reporting. Below is a breakdown of its features:
1. Home Sheet – Centralized Navigation
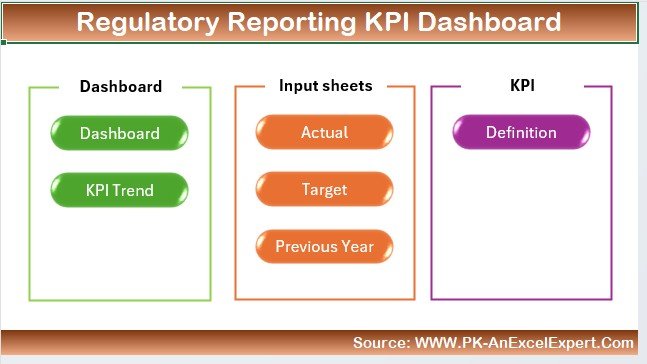
- Acts as the dashboard’s control center, allowing users to quickly navigate between different sections.
- Includes clickable buttons for easy access to key sheets like the Dashboard, KPI Trend, and Data Entry sections.
2. Dashboard Sheet – Your Performance Snapshot
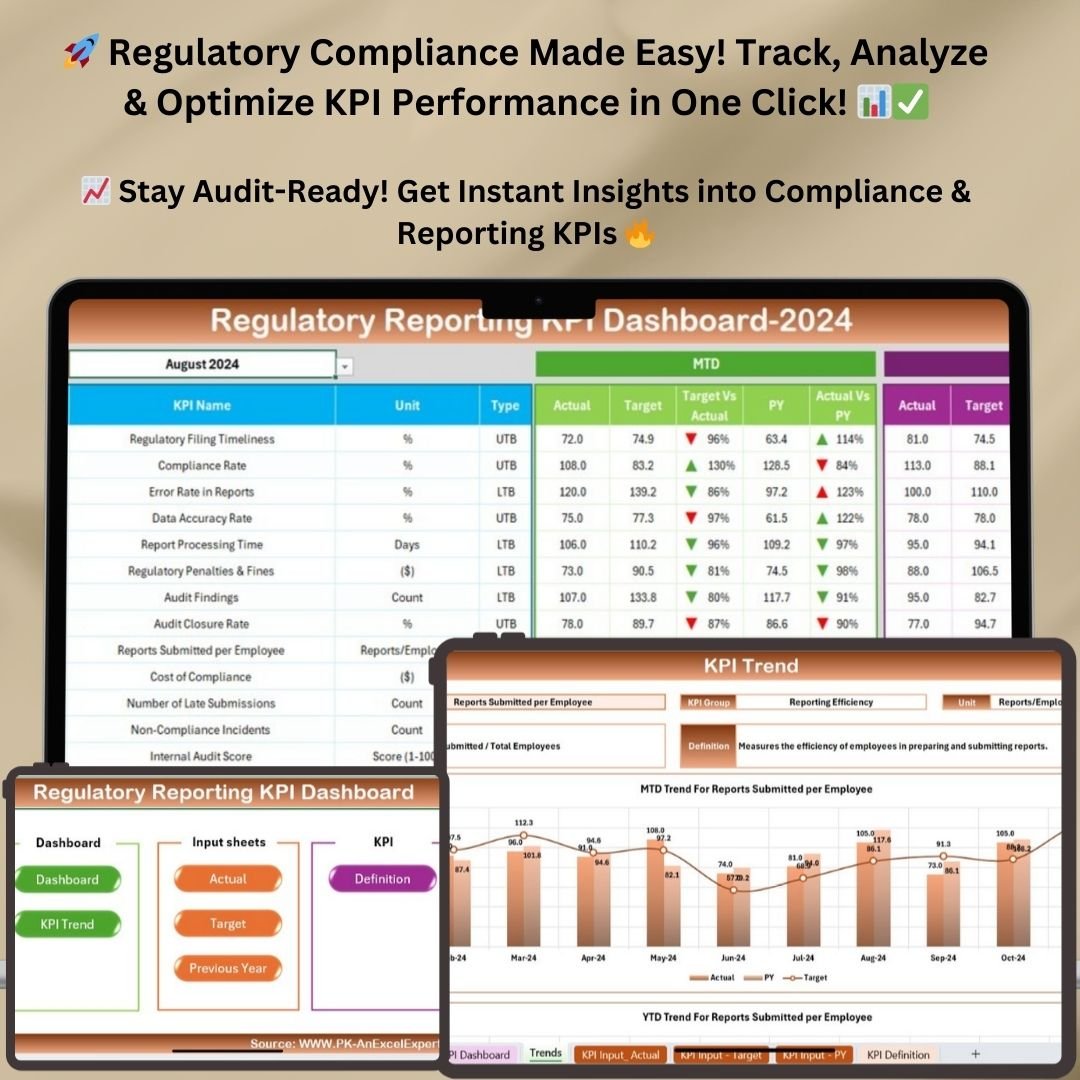
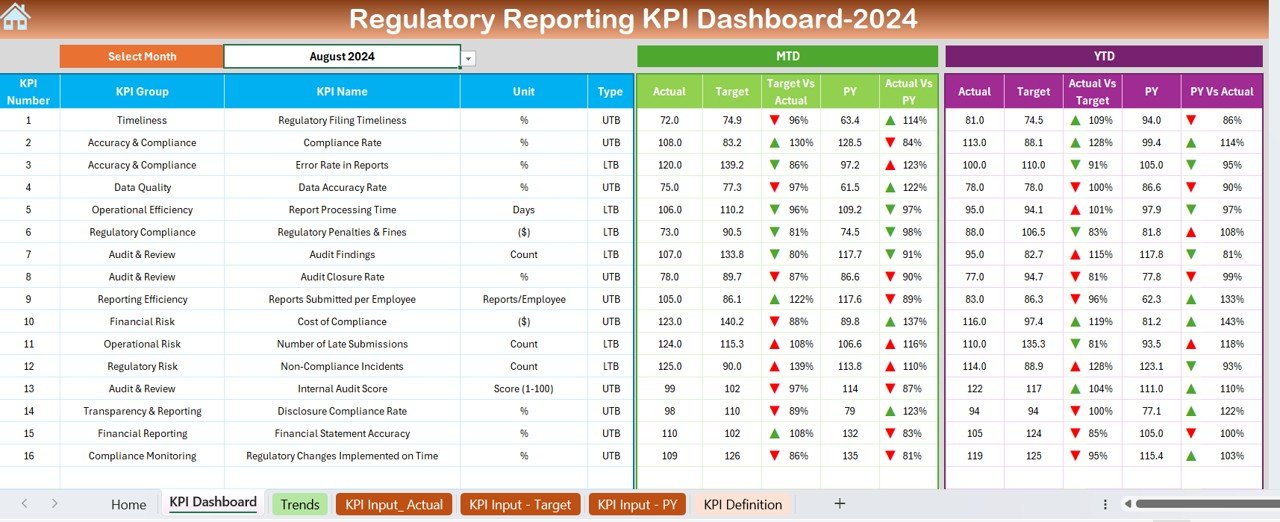
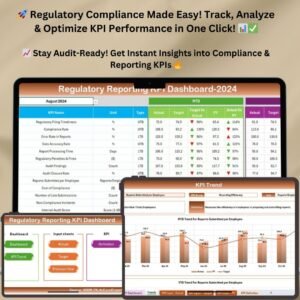
- Provides a comprehensive overview of all regulatory compliance KPIs.
- Drop-down selector to filter data by month.
- Displays MTD (Month-to-Date) and YTD (Year-to-Date) actuals, targets, and previous year comparisons.
- Variance Analysis highlights performance gaps with color-coded arrows (green for improvement, red for decline).
- Helps compliance teams track key regulatory metrics, penalties, audits, and financial reporting accuracy.
3. KPI Trend Sheet – In-Depth Analysis of KPI Performance
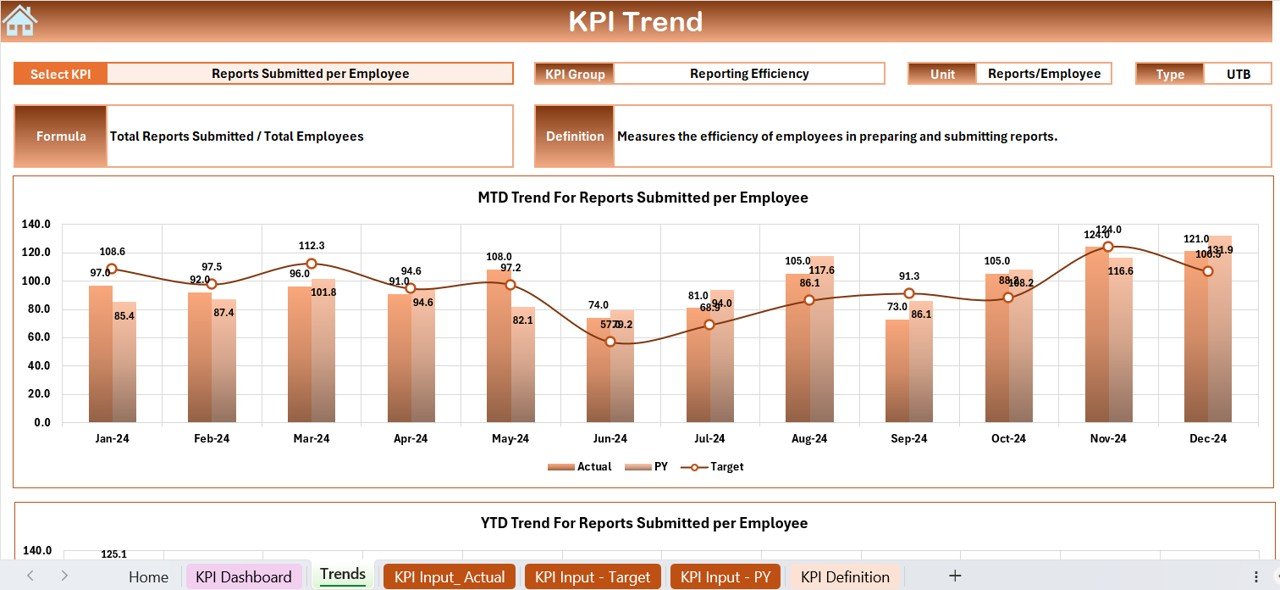
- Enables detailed tracking of individual KPIs over time.
- Drop-down selector to choose a KPI and view trends dynamically.
- Includes MTD and YTD trend charts to visualize KPI movements and identify patterns.
- Displays KPI formula and definition, ensuring clear understanding across teams.
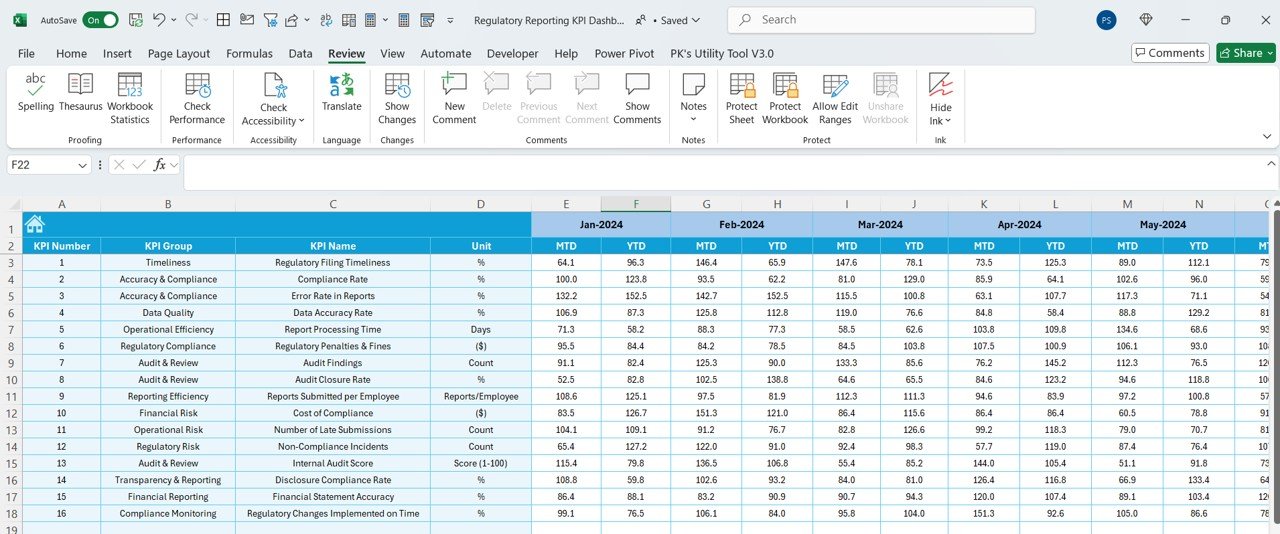
4. Actual Numbers Input Sheet – Data Entry for KPI Tracking
- User-friendly input fields for entering actual KPI values per month.
- Auto-updating formulas to calculate MTD and YTD figures dynamically.
- Ensures accurate reporting for decision-making.
5. Target Sheet – Define Your Compliance Goals
- Allows users to set target values for each KPI.
- Enables comparison between actual performance and predefined goals.
- Essential for regulatory compliance teams to monitor whether performance aligns with expectations.
6. Previous Year Data Sheet – Comparative Analysis for Continuous Improvement
- Stores previous year’s KPI data for side-by-side comparison.
- Helps assess year-over-year progress and detect regulatory risks before they escalate.
- Enhances reporting accuracy by ensuring consistency in KPI evaluation.
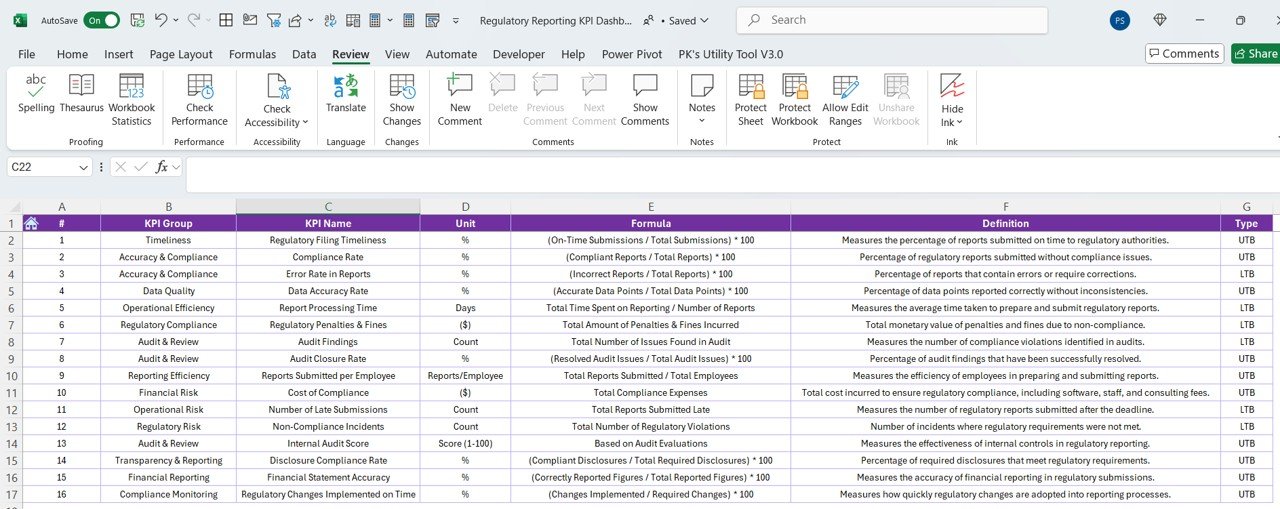
7. KPI Definition Sheet – Comprehensive KPI Glossary
- Lists all KPIs along with their group, unit, formula, and detailed definition.
- Helps teams maintain standardized reporting metrics and reduces confusion.
- Serves as a reference guide to ensure consistent interpretation of KPI data across departments.
Benefits of Using This KPI Dashboard
✅ Enhances Compliance Monitoring – Easily track regulatory penalties, audit findings, and financial reporting accuracy.
✅ Saves Time on Data Entry – Automated calculations and structured input sheets simplify the reporting process.
✅ Clear Visuals & Trend Analysis – Charts, variance indicators, and conditional formatting provide a quick view of KPI performance.
✅ Data-Driven Decision Making – Compare actual performance against targets and previous year values to identify improvement areas.
✅ Customizable & Scalable – Modify KPIs, targets, and reporting parameters to fit your organization’s specific needs.
Who Can Benefit from This Template?
This Regulatory Reporting KPI Dashboard in Excel is ideal for:
- Regulatory Compliance Teams – Monitor adherence to compliance and reporting standards.
- Finance Professionals – Track financial reporting accuracy, cost of compliance, and audit performance.
- Risk Managers – Identify and mitigate regulatory risks using real-time data insights.
- Operations Teams – Improve efficiency by tracking report processing time and audit closure rates.
- Internal Audit & Governance Teams – Evaluate findings and ensure continuous improvement in compliance efforts.
How to Use the Dashboard?
- Input Data – Enter actual KPI values in the Actual Numbers Input Sheet.
- Set Targets – Define compliance goals in the Target Sheet.
- Monitor Performance – Use the Dashboard Sheet to view real-time KPI tracking.
- Analyze Trends – Check the KPI Trend Sheet for a detailed breakdown of KPI progress.
- Compare Year-over-Year Data – Utilize the Previous Year Data Sheet for performance benchmarking.
- Standardize KPI Definitions – Refer to the KPI Definition Sheet for metric explanations.
Why Choose This Dashboard?
📌 Designed by Experts – Built with industry-leading best practices for regulatory reporting.
📌 Fully Editable – Customize KPIs, formulas, and reporting structure based on your needs.
📌 Time-Saving Automation – Pre-built formulas and conditional formatting automate performance tracking.
Click hare to read the Detailed blog post
Visit our YouTube channel to learn step-by-step video tutorials









Reviews
There are no reviews yet.