Managing refinery contracts is complex, high-risk, and data-intensive. Because refinery contracts involve large financial values, long timelines, compliance requirements, and multiple stakeholders, even small inefficiencies can cause serious losses. That is exactly why the Refinery Contract KPI Dashboard in Excel is designed—to give you clarity, control, and confidence in every contract decision.
This ready-to-use Excel dashboard converts raw contract data into clear KPIs, powerful visuals, and actionable insights—without expensive BI tools or complicated software.
🚀 Key Features of the Refinery Contract KPI Dashboard in Excel
📊 Centralized KPI Monitoring
Track all refinery contract KPIs in one interactive Excel dashboard instead of scattered spreadsheets.
📅 Dynamic Month Selector
Select any month from the dropdown, and the entire dashboard updates instantly.
📈 MTD & YTD Performance Tracking
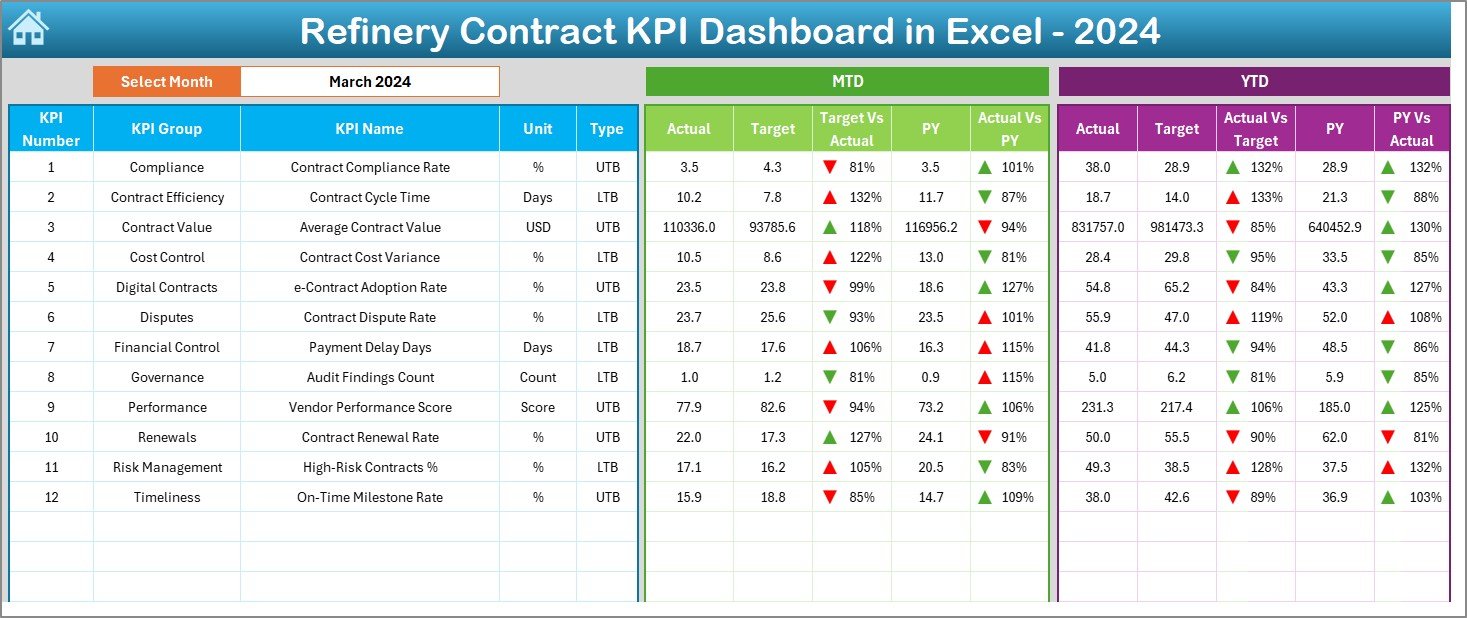
Monitor Month-to-Date and Year-to-Date Actual, Target, and Previous Year performance in one view.
🔄 Automatic Variance Analysis
Instantly compare Target vs Actual and Previous Year vs Actual with clear variance calculations.
🚦 Visual Performance Indicators
Conditional formatting with up and down arrows highlights risks and achievements at a glance.
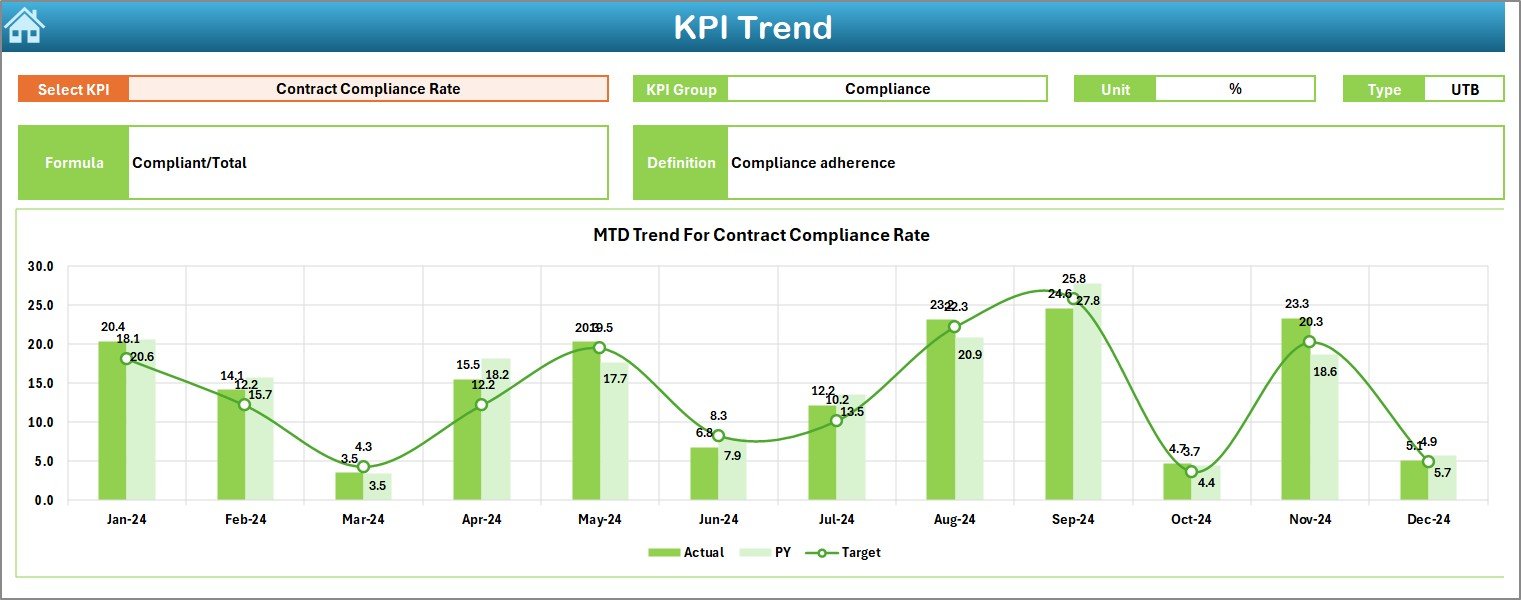
📉 Advanced KPI Trend Analysis
Analyze KPI trends over time to identify patterns, risks, and improvement opportunities.
🧭 Easy Navigation with Summary Page
Jump between dashboard sections using smart navigation buttons—no scrolling required.
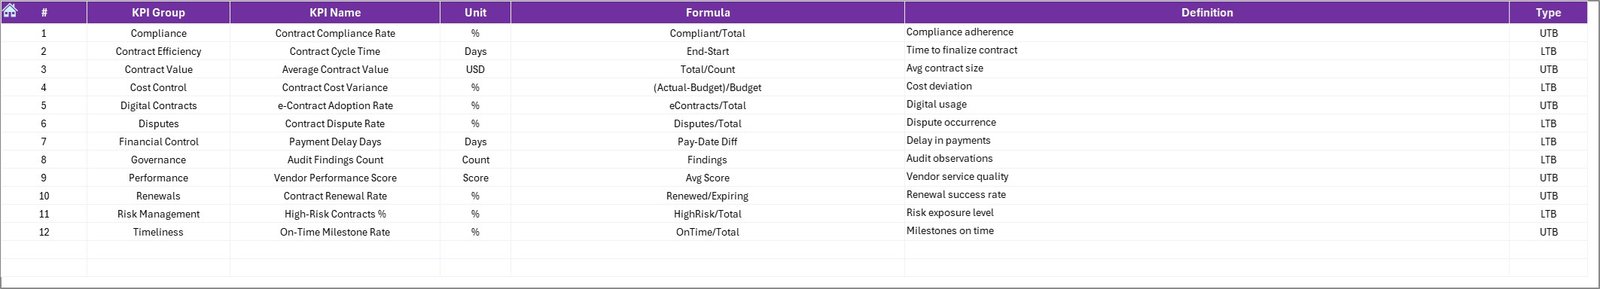
📘 Built-in KPI Definition Sheet
Ensure reporting clarity with standardized KPI names, formulas, units, and definitions.
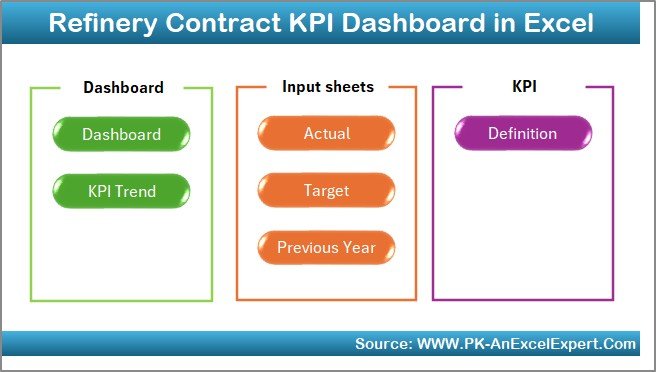
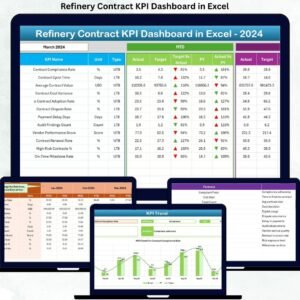
📂 What’s Inside the Refinery Contract KPI Dashboard in Excel
This dashboard includes 7 professionally structured worksheets, each designed for a specific role:
📌 Summary Page – Quick navigation hub with one-click access to all sheets
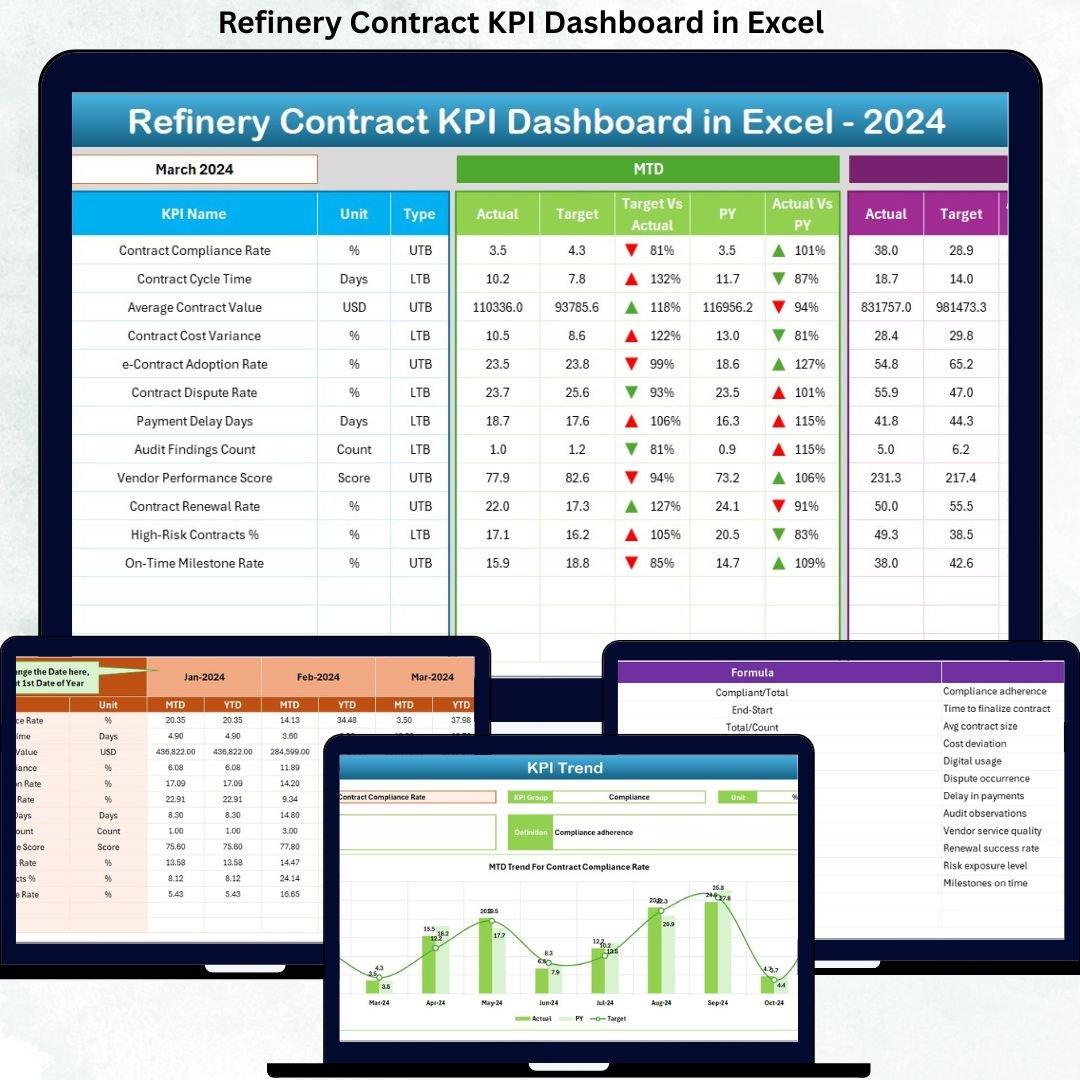
📊 Dashboard Sheet – Central KPI view with MTD, YTD, Target, and PY comparisons
📈 Trend Sheet – Detailed KPI trend charts and performance breakdowns
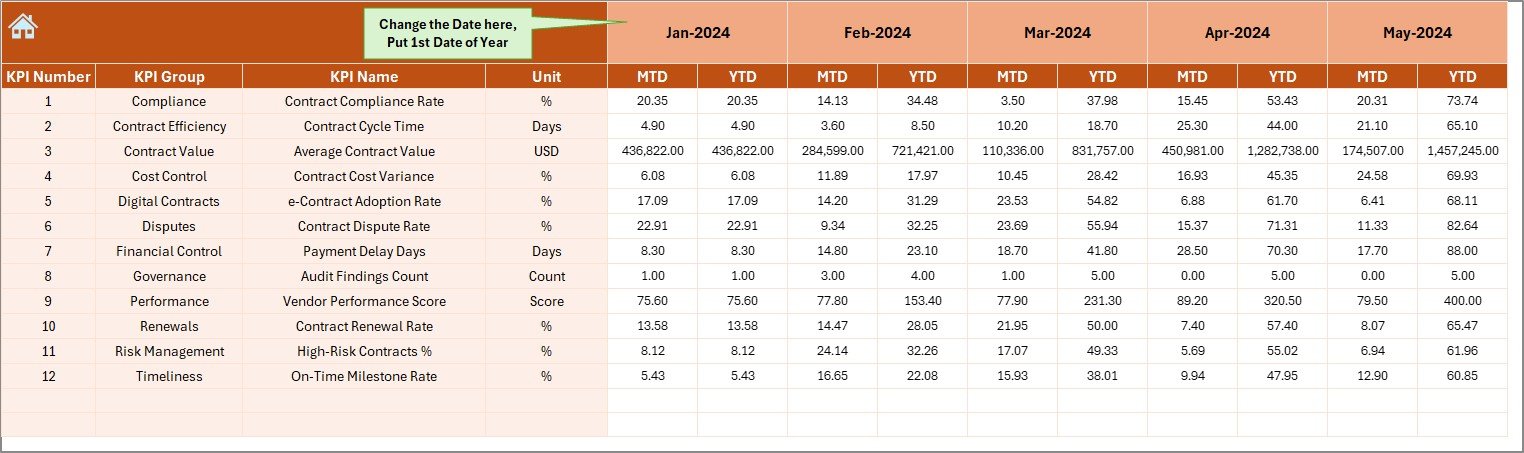
📝 Actual Numbers Input Sheet – Simple data entry for actual values
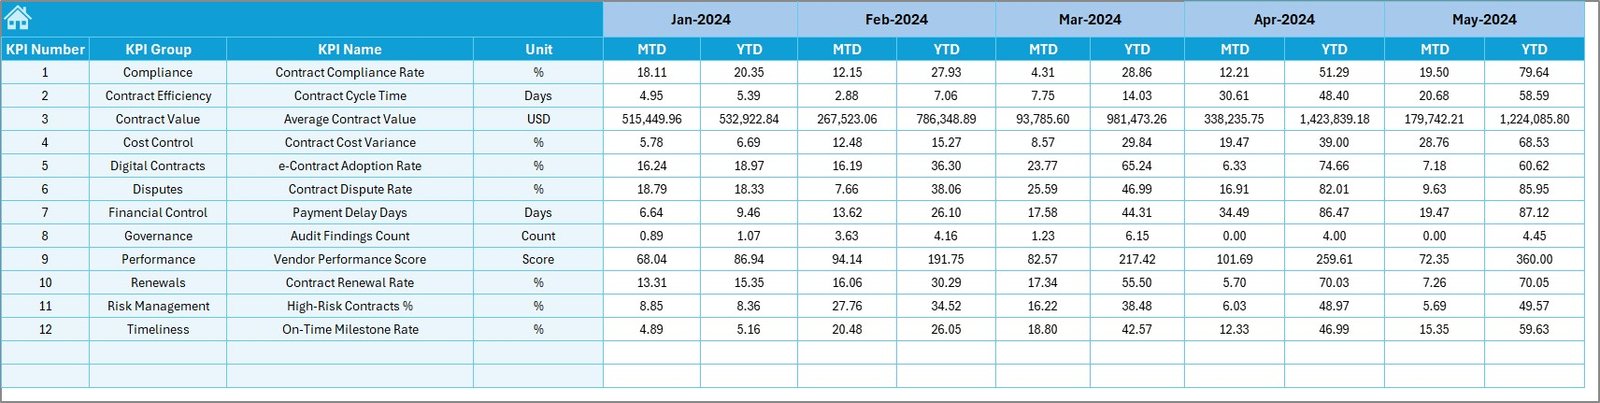
🎯 Target Sheet – Define monthly and yearly performance goals
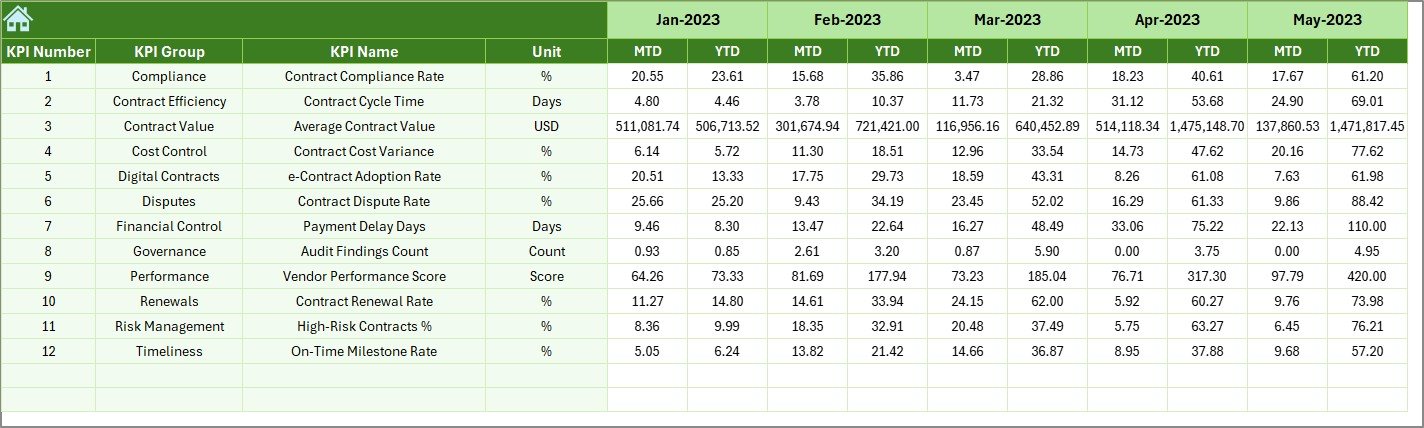
📅 Previous Year Data Sheet – Historical benchmarking for smarter decisions
📚 KPI Definition Sheet – Standardized KPI documentation for clarity and consistency
Together, these sheets form a complete refinery contract performance management system.
🧠 How to Use the Refinery Contract KPI Dashboard in Excel
Using the dashboard is simple and efficient:
1️⃣ Enter actual contract data in the Actual Numbers Input Sheet
2️⃣ Define targets in the Target Sheet
3️⃣ Add historical data in the Previous Year Sheet
4️⃣ Select the reporting month from the dropdown
5️⃣ Instantly analyze KPIs, variances, and trends on the dashboard
No advanced Excel skills required—basic Excel knowledge is enough.
👥 Who Can Benefit from This Refinery Contract KPI Dashboard
This dashboard is ideal for:
🏭 Refinery Contract Managers – Monitor contract compliance and performance
💰 Finance Teams – Track cost variance and contract value utilization
🧾 Procurement Teams – Evaluate vendor and contract efficiency
📋 Project Managers – Identify delays and performance gaps
⚙️ Operations Teams – Improve execution control
🏢 Senior Leadership – Make data-driven strategic decisions
Whether operational or strategic, this dashboard fits all decision-makers.
Click here to read the Detailed Blog Post
Watch the step-by-step video tutorial:


Reviews
There are no reviews yet.