Recruitment is one of the most important functions in any organization. Hiring the right talent helps businesses grow, innovate, and stay competitive in today’s fast-paced market. However, managing recruitment data efficiently can be challenging. HR teams often deal with large volumes of candidate data, multiple hiring stages, and performance metrics that are difficult to track manually.Recruitment Funnel KPI Dashboard in Google Sheets
Many organizations still rely on scattered spreadsheets and manual reports, which makes it difficult to monitor hiring performance and analyze the recruitment funnel effectively. As a result, recruitment managers struggle to identify bottlenecks in the hiring process, measure recruitment efficiency, and track hiring performance against targets.Recruitment Funnel KPI Dashboard in Google Sheets
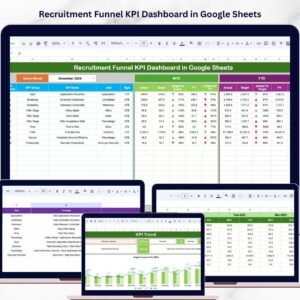
To solve these challenges, we created the Recruitment Funnel KPI Dashboard in Google Sheets — a powerful and ready-to-use HR analytics tool designed to track recruitment performance and monitor the hiring funnel in a structured and visual way.
This dashboard enables HR professionals to analyze recruitment KPIs, monitor hiring performance, and compare results against targets and previous year data. Because the dashboard is built in Google Sheets, teams can collaborate in real time and access recruitment insights from anywhere.
Instead of reviewing complex spreadsheets and manual reports, HR managers can quickly understand recruitment performance through interactive KPI indicators, trend analysis, and performance comparisons.
📊 Key Features of the Recruitment Funnel KPI Dashboard
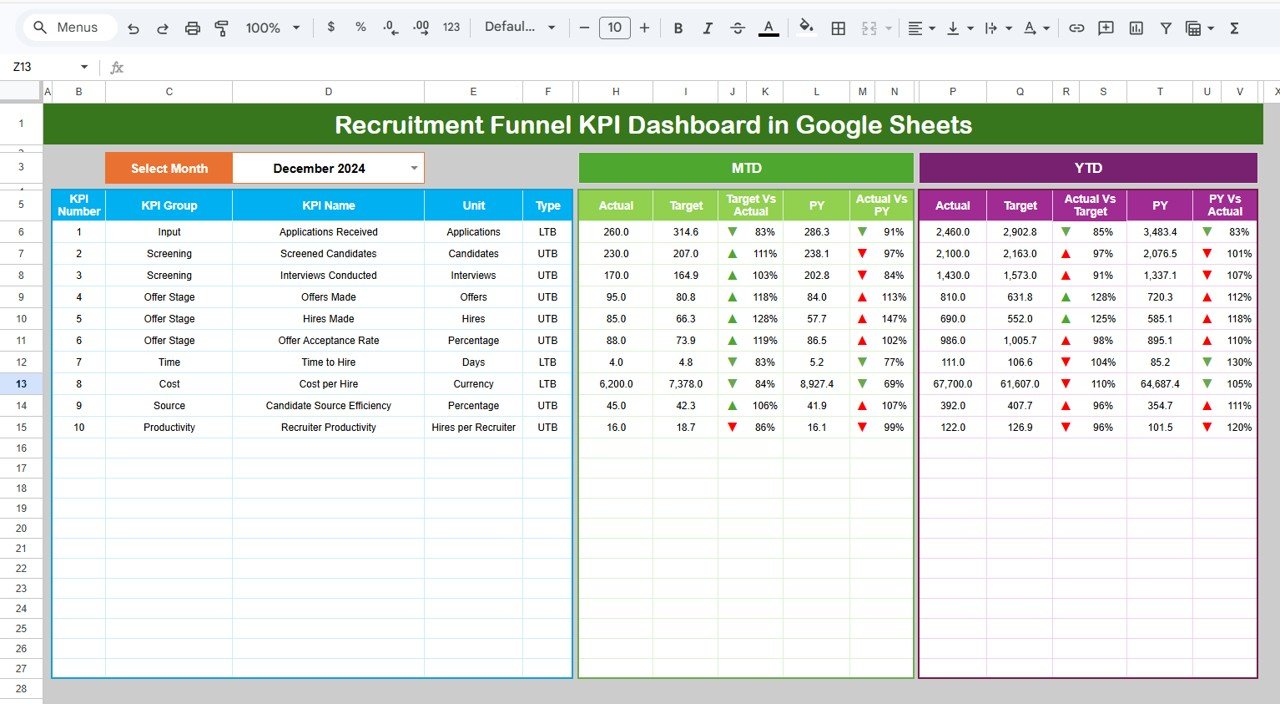
📈 Interactive Recruitment KPI Dashboard
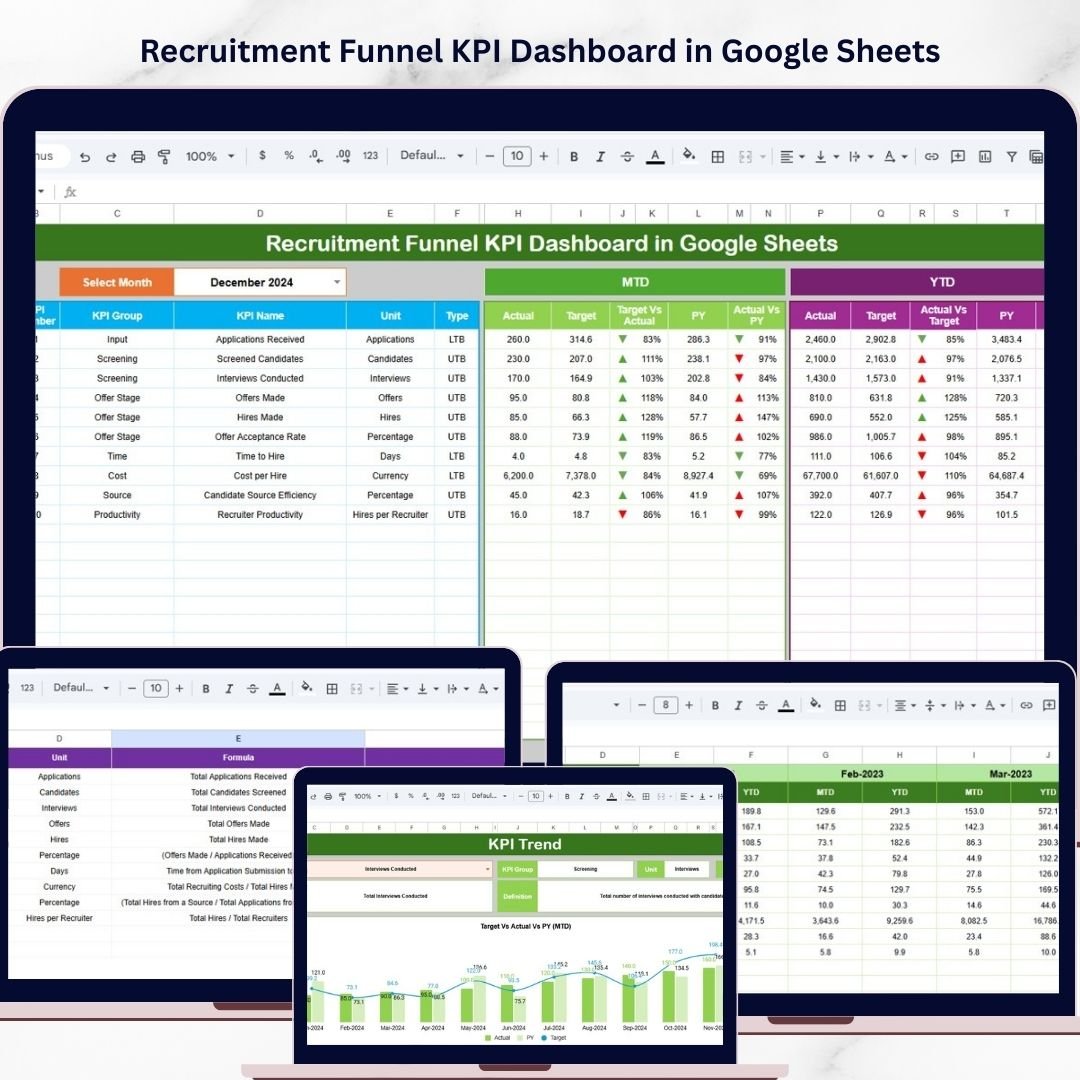
The main dashboard sheet provides a comprehensive overview of recruitment performance.
HR teams can view key performance indicators such as:
• Actual recruitment results
• Target performance
• Previous year performance
These metrics are displayed for both Month-to-Date (MTD) and Year-to-Date (YTD) periods.
Additionally, the dashboard automatically calculates:
• Target vs Actual comparison
• Previous Year vs Actual comparison
Visual indicators such as up and down arrows make it easy to identify performance trends.
📅 Dynamic Month Selection
Users can select the month from a dropdown menu located in cell D3.
Once the month changes, the entire dashboard updates automatically, allowing HR teams to analyze recruitment performance for any specific month.
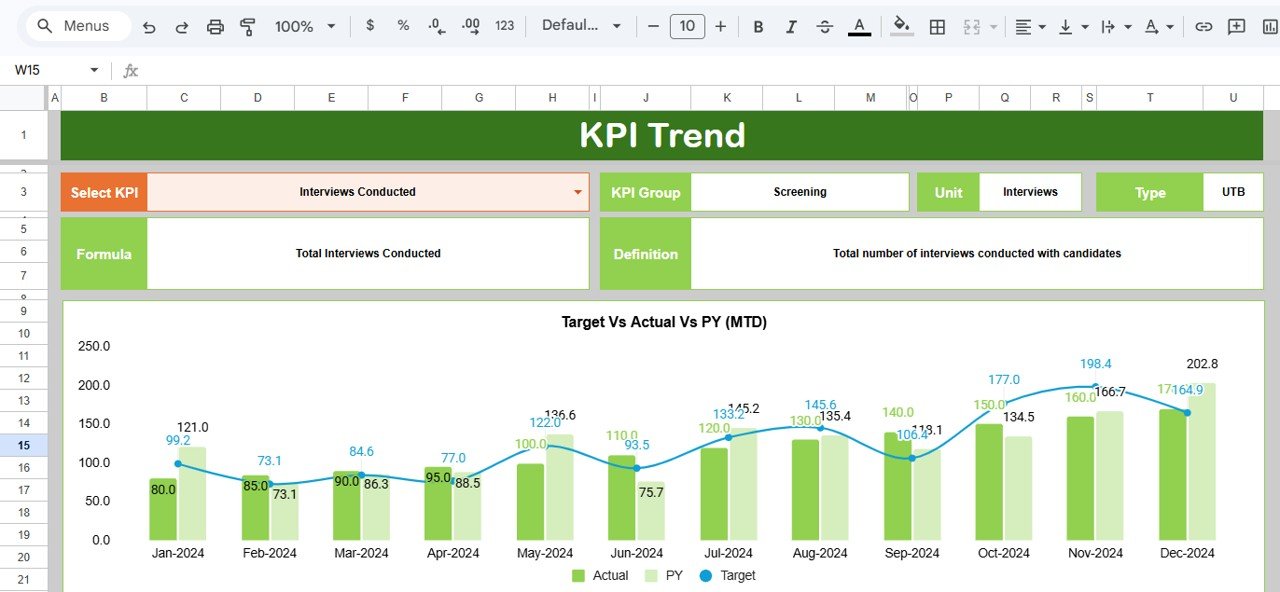
📉 KPI Trend Analysis
The KPI Trend sheet helps HR professionals analyze recruitment performance over time.
Users can select a KPI from the dropdown menu in cell C3, and the sheet automatically displays detailed KPI information including:
• KPI group
• Unit of measurement
• KPI type (Lower the Better or Upper the Better)
• KPI formula
• KPI definition
The sheet also displays trend charts comparing Actual, Target, and Previous Year values for both MTD and YTD periods.
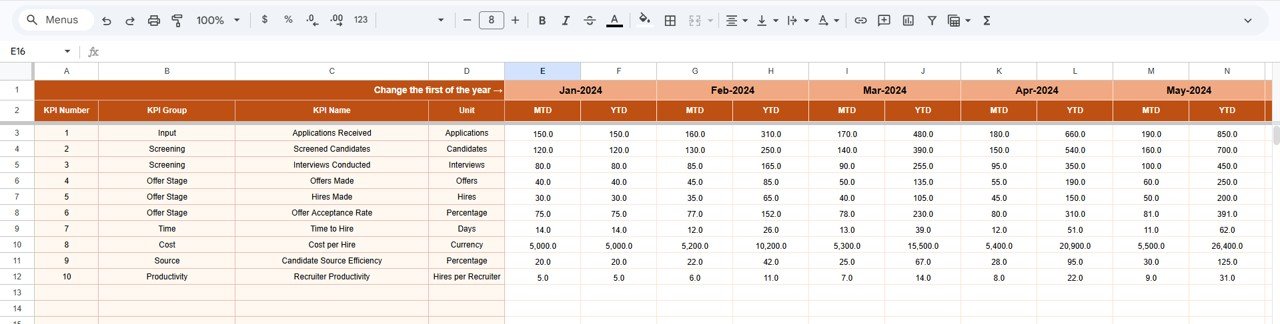
📊 Recruitment Data Entry Sheet
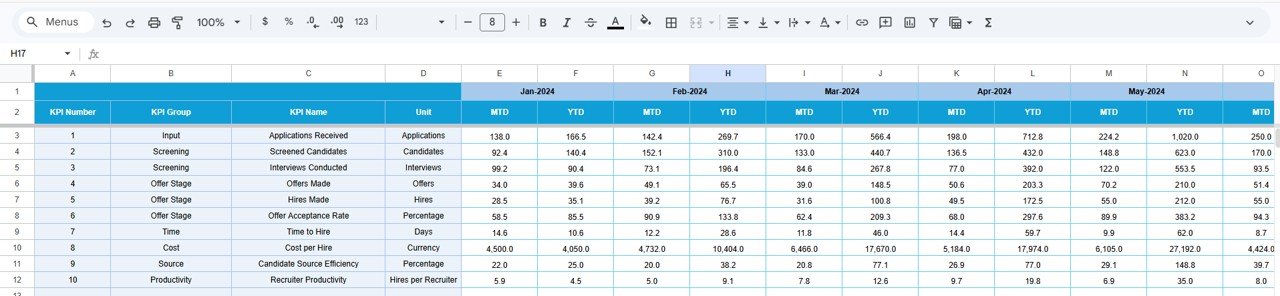
The Actual Numbers sheet acts as the primary data entry section.
HR teams enter recruitment results for each KPI, including:
• MTD actual values
• YTD actual values
Once data is entered, the dashboard automatically updates all charts and KPIs.
The sheet also includes a month control cell (E1) that defines the starting month for calculations.
🎯 Recruitment KPI Target Management
The Target sheet stores the target values for each recruitment KPI.
These targets allow HR managers to measure recruitment performance against predefined goals.
The sheet includes:
• Monthly targets (MTD)
• Yearly targets (YTD)
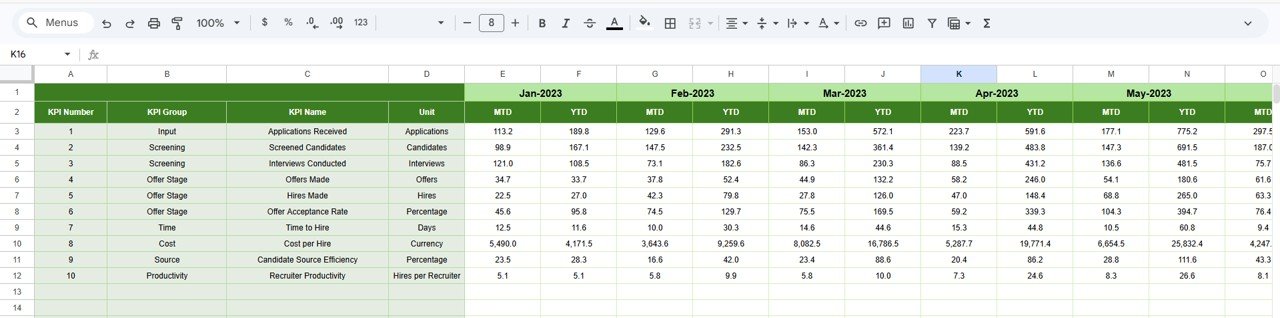
📊 Previous Year Performance Analysis
The Previous Year Numbers sheet contains historical recruitment data.
This allows HR teams to compare current recruitment performance with past results and identify trends.
By analyzing previous year data, organizations can:
• Identify long-term hiring trends
• Evaluate recruitment improvements
• Understand seasonal hiring patterns
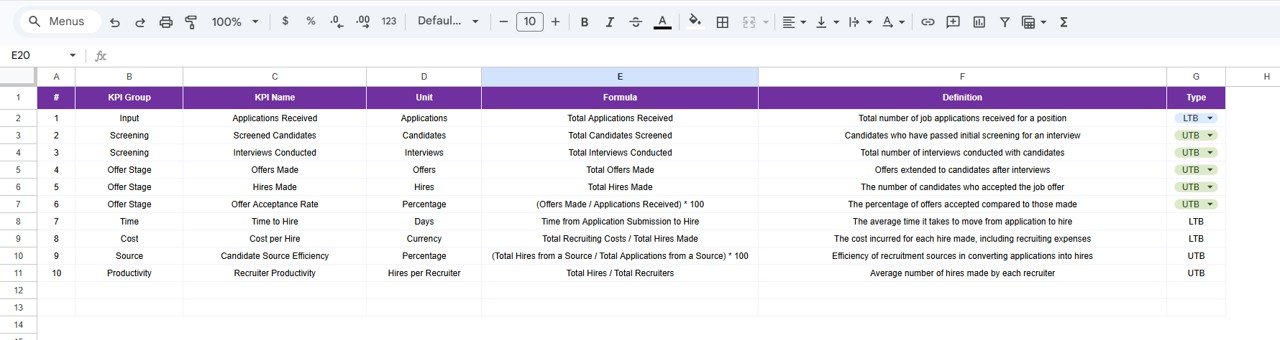
📚 KPI Definition Reference Sheet
The KPI Definition sheet serves as the documentation section of the dashboard.
It includes detailed information about each KPI such as:
• KPI Name
• KPI Group
• Unit of Measurement
• KPI Formula
• KPI Definition
This ensures that all users clearly understand how each recruitment KPI is calculated.
📁 What’s Inside the Recruitment Funnel KPI Dashboard
When you download this template, you receive a Google Sheets dashboard file with six worksheets:
✔ Dashboard Sheet – Main recruitment KPI overview
✔ KPI Trend Sheet – Recruitment KPI trend analysis
✔ Actual Numbers Sheet – Data entry for recruitment metrics
✔ Target Sheet – KPI target values
✔ Previous Year Numbers Sheet – Historical recruitment performance
✔ KPI Definition Sheet – Documentation of KPI formulas and definitions
Each worksheet is fully connected and automated, ensuring that the dashboard updates instantly when data changes.
👥 Who Can Benefit from This Dashboard
This dashboard is ideal for:
✔ HR Managers
✔ Talent Acquisition Teams
✔ Recruitment Consultants
✔ HR Analysts
✔ Business Owners
✔ Recruitment Agencies
✔ Human Resource Departments
Any organization that manages hiring processes can use this dashboard to improve recruitment performance and hiring efficiency.
🚀 Improve Your Recruitment Strategy with Data
The Recruitment Funnel KPI Dashboard in Google Sheets helps organizations track hiring performance, analyze recruitment funnel stages, and monitor recruitment KPIs effectively.
With interactive dashboards, trend analysis, and automated performance comparisons, HR teams can easily identify hiring bottlenecks and make data-driven talent acquisition decisions.
Because the dashboard is cloud-based and fully customizable, it becomes a powerful tool for modern HR analytics
Click here to Read detailed blog post
Watch the step-by-step video tutorial:
Visit our YouTube channel to learn step-by-step video tutorials