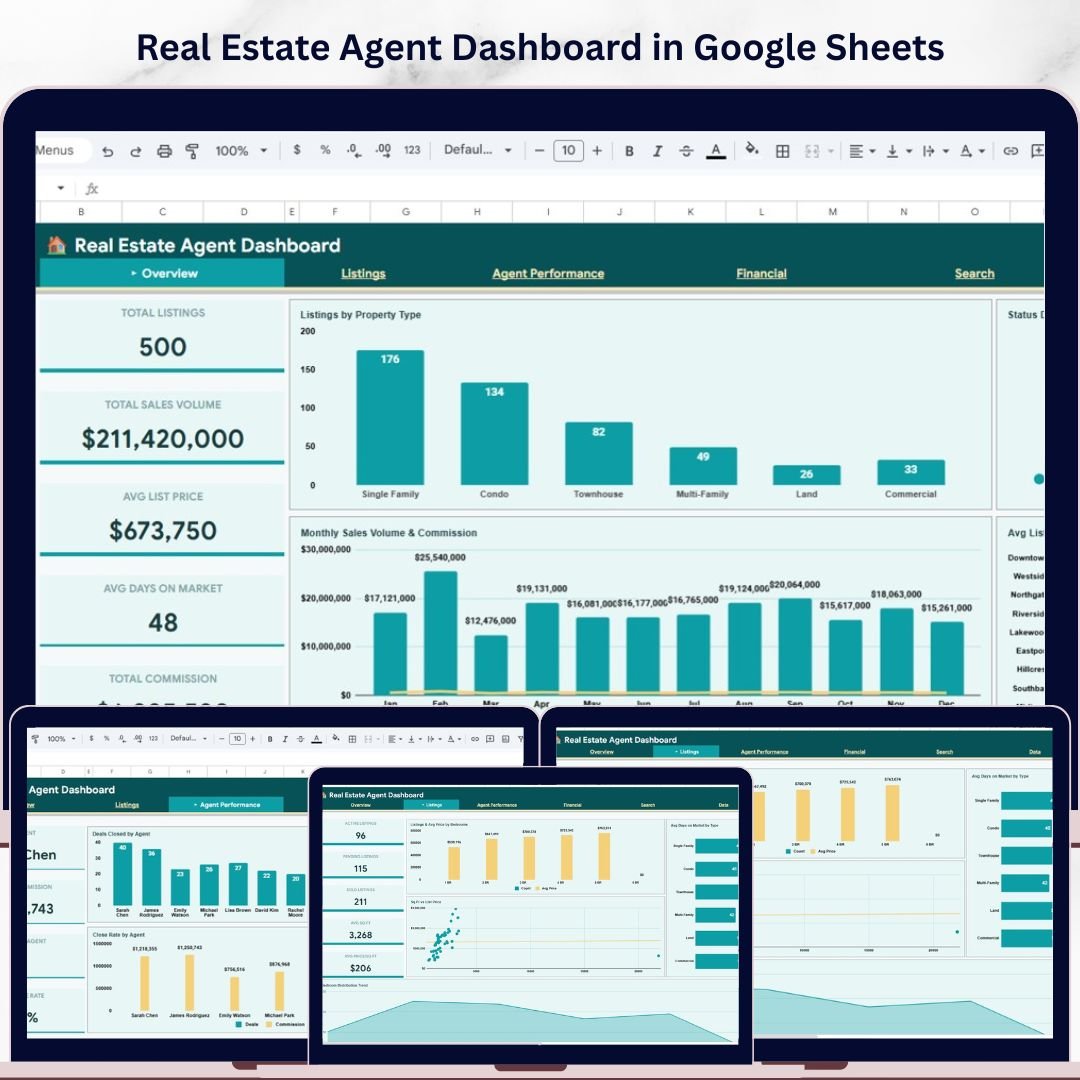

🔑 Key Features of Real Estate Agent Dashboard in Google Sheets
Real Estate Agent Dashboard in Google Sheets is a powerful, ready-to-use analytics template designed for real estate professionals who want to track listings, monitor agent performance, and analyze financial outcomes — all in one place. This dashboard includes 6 interactive pages covering everything from a high-level overview of your portfolio to granular listing searches. Whether you are a solo agent, team lead, or brokerage manager, this template gives you instant visibility into your sales pipeline, commission earnings, and property analytics without any coding or complex setup.
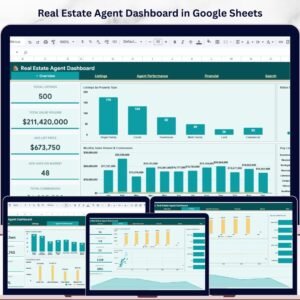
This template includes 5 KPI cards on the Overview page — Total Listings, Total Sales Volume, Avg List Price, Avg Days on Market, and Total Commission — giving you a snapshot of your entire business at a glance. The dashboard tracks property listings by type, status distribution, monthly sales volume and commission trends, and average list price by neighborhood. It is built entirely in Google Sheets with automated formulas and charts, so you simply replace the sample data with your own and everything updates instantly.
If you are looking for more Google Sheets Dashboard Templates, explore our full collection of professionally designed templates for every business need.
📦 What’s Inside the Real Estate Agent Dashboard in Google Sheets
This dashboard is organized into 6 sheet tabs, each serving a specific analytical purpose:
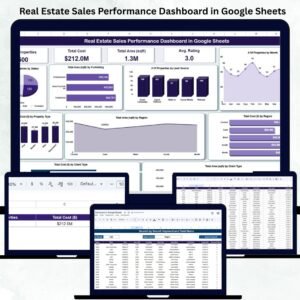
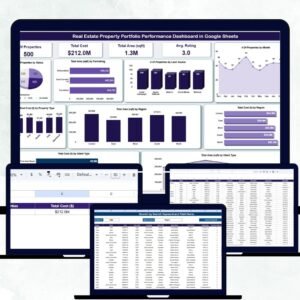
📊 Overview Page — Features 5 KPI cards (Total Listings, Total Sales Volume, Avg List Price, Avg Days on Market, Total Commission) along with charts showing Listings by Property Type, Status Distribution by Listing Status, Monthly Sales Volume and Commission by Month, and Avg List Price by Neighborhood. Multiple slicers let you filter the entire dashboard instantly.
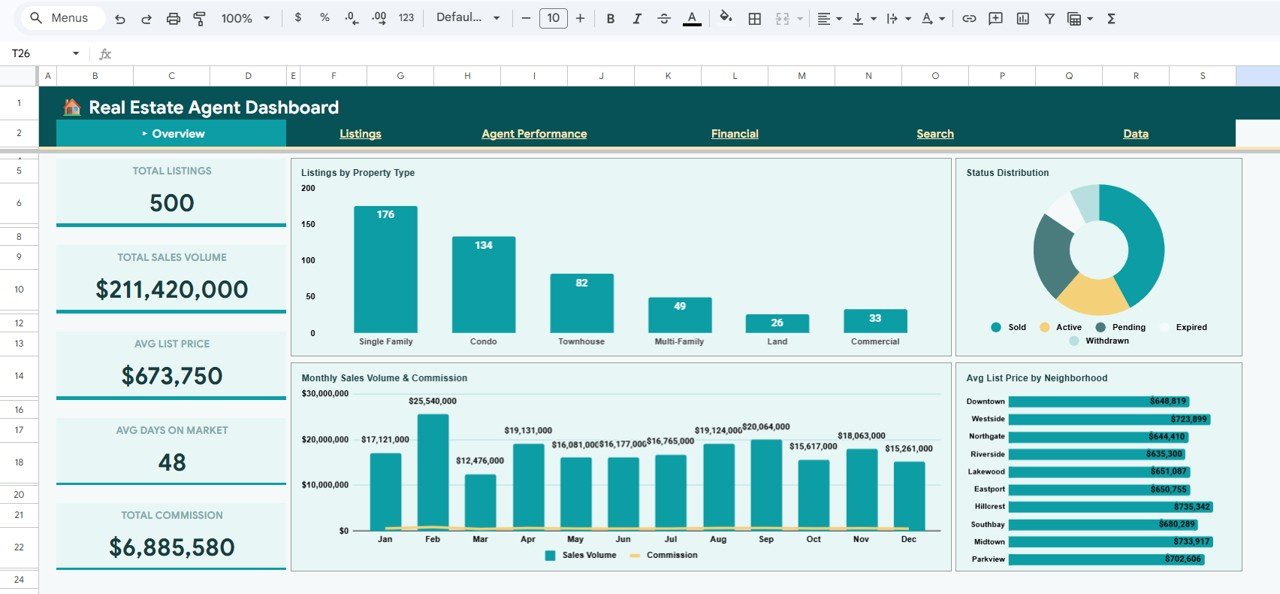 Overview Page
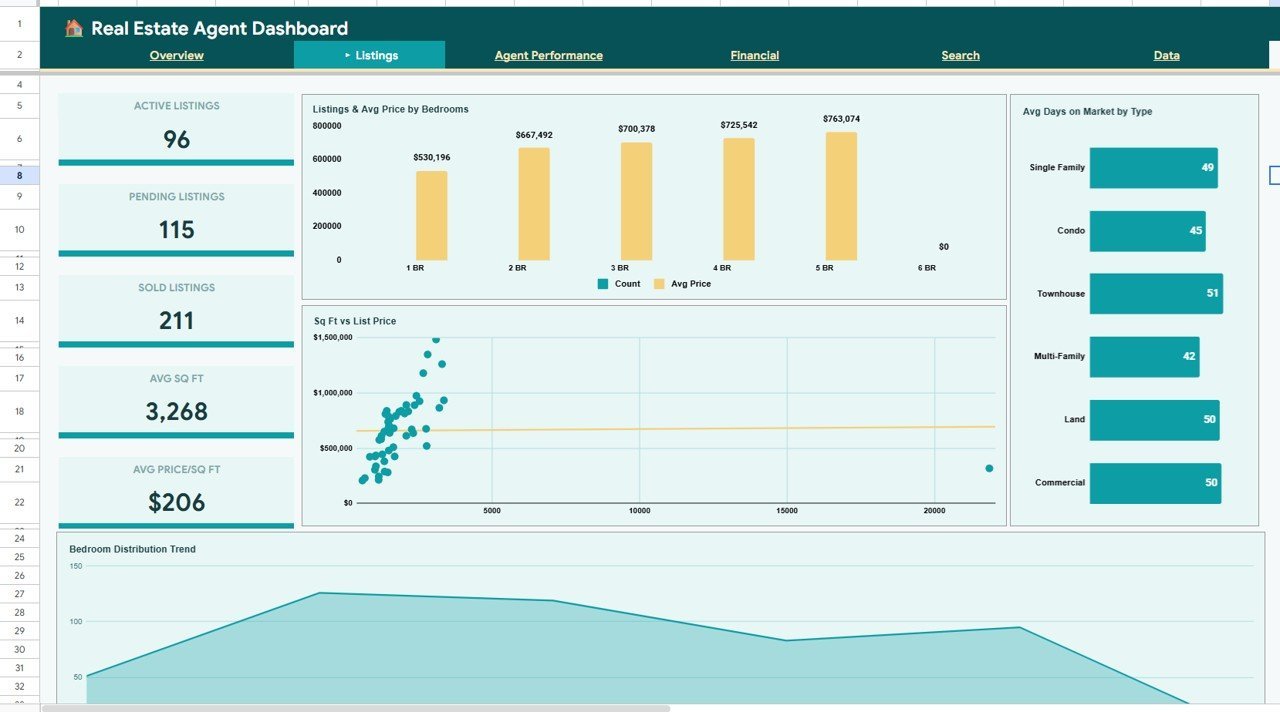
📋 Listings Page — Displays Active Listings, Pending Listings, Sold Listings, Avg Sq Ft, and Avg Price per Sq Ft as KPI cards. Charts include Listings and Avg Price by Bedrooms, Avg Days on Market by Property Type, Sq Ft vs List Price by Listing, and Bedroom Distribution Trend by Month.
 Listings Page
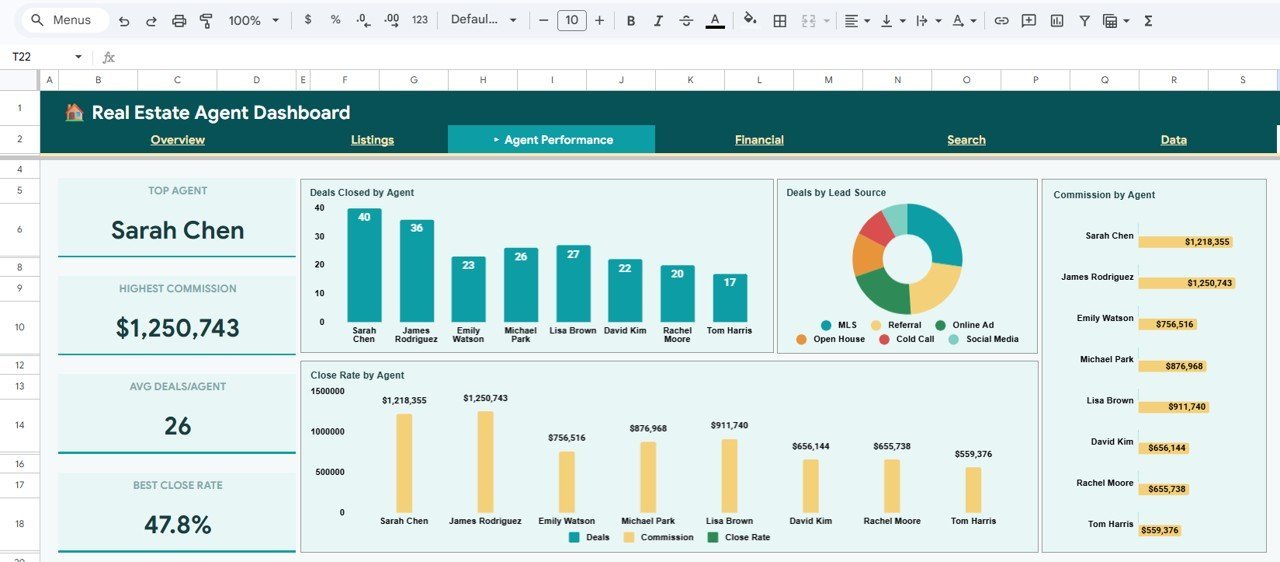
👤 Agent Performance Page — Highlights Top Agent, Highest Commission, Avg Deals per Agent, and Best Close Rate. Analysis includes Deals Closed by Agent, Deals by Lead Source, Commission by Agent, and Close Rate by Agent.
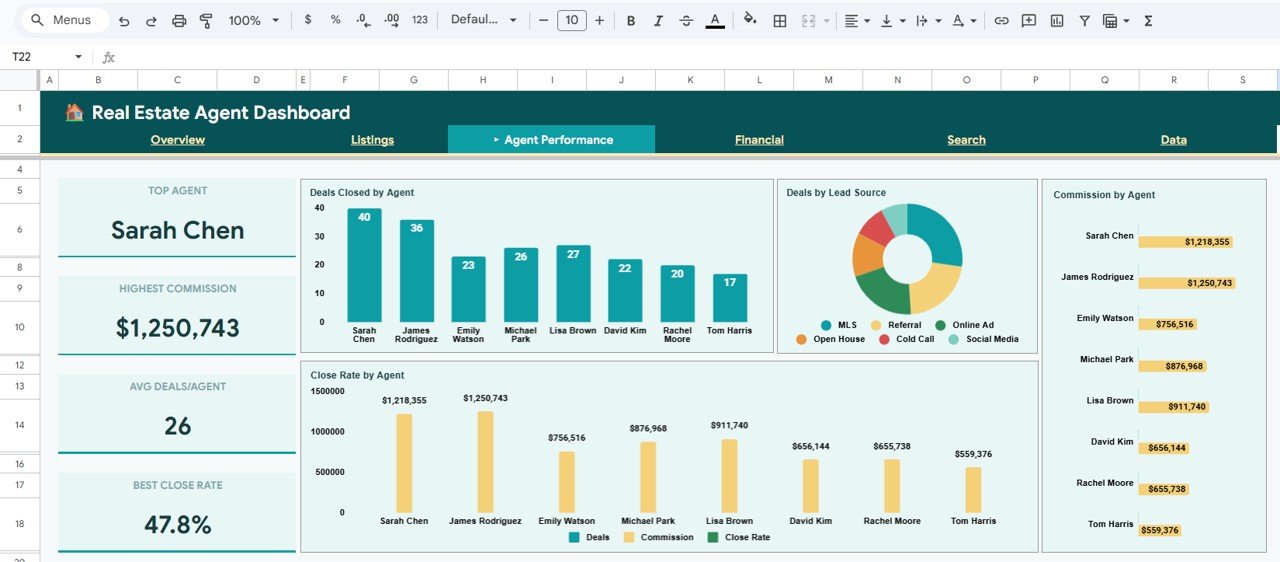 Agent Performance Page
💰 Financial Page — Tracks Total Revenue (Commission), Avg Commission per Deal, Total Sale Volume, Avg Sale Price, and Sale to List Ratio. Charts show Monthly Commission and Sales Volume by Month, Commission Revenue by Neighborhood, Cumulative Commission Trend by Month, and Sales Volume vs Commission by Month.
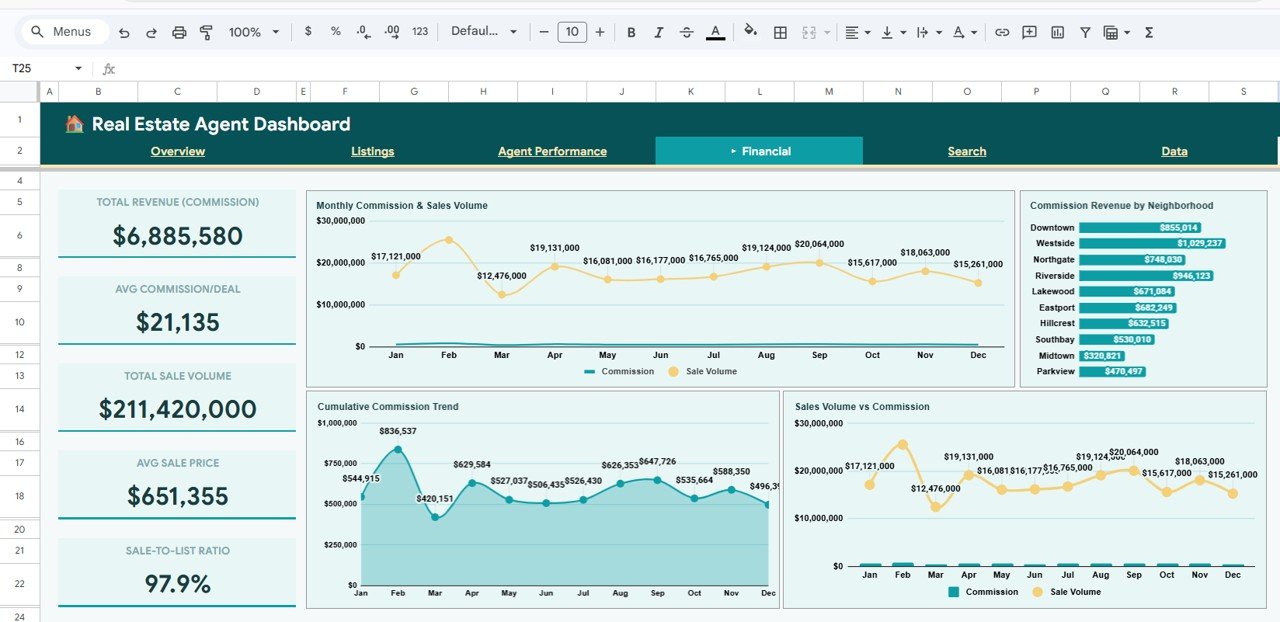 Financial Page
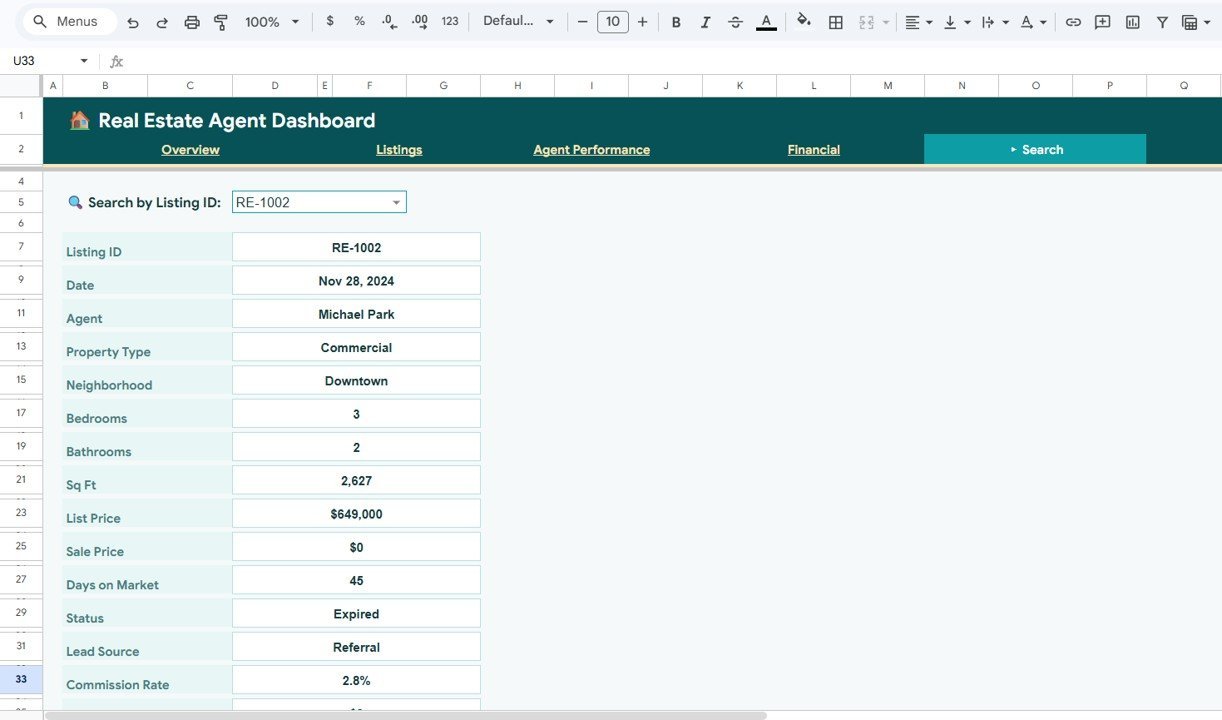
🔍 Search Sheet — Pick a Listing ID from the dropdown and instantly view all details including Date, Agent, Property Type, Neighborhood, Bedrooms, Bathrooms, Sq Ft, List Price, Sale Price, Days on Market, Status, Lead Source, and Commission Rate.
 Search Sheet
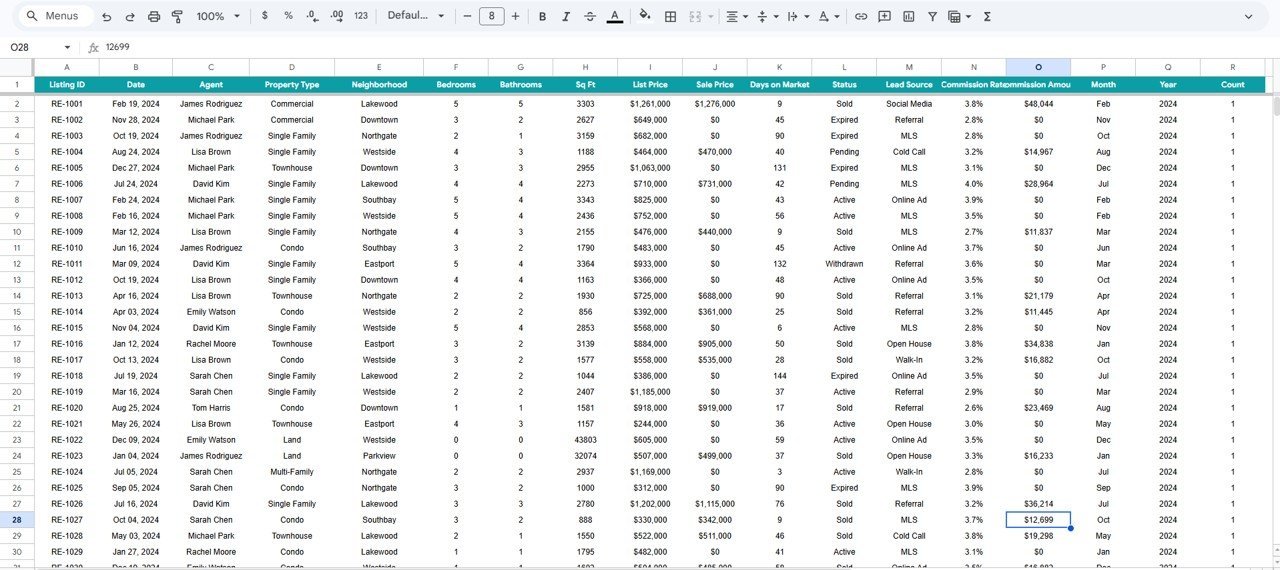
📝 Data Sheet — This is where you enter all your listing data. Simply add your records in the same format as the sample data and the entire dashboard updates automatically.
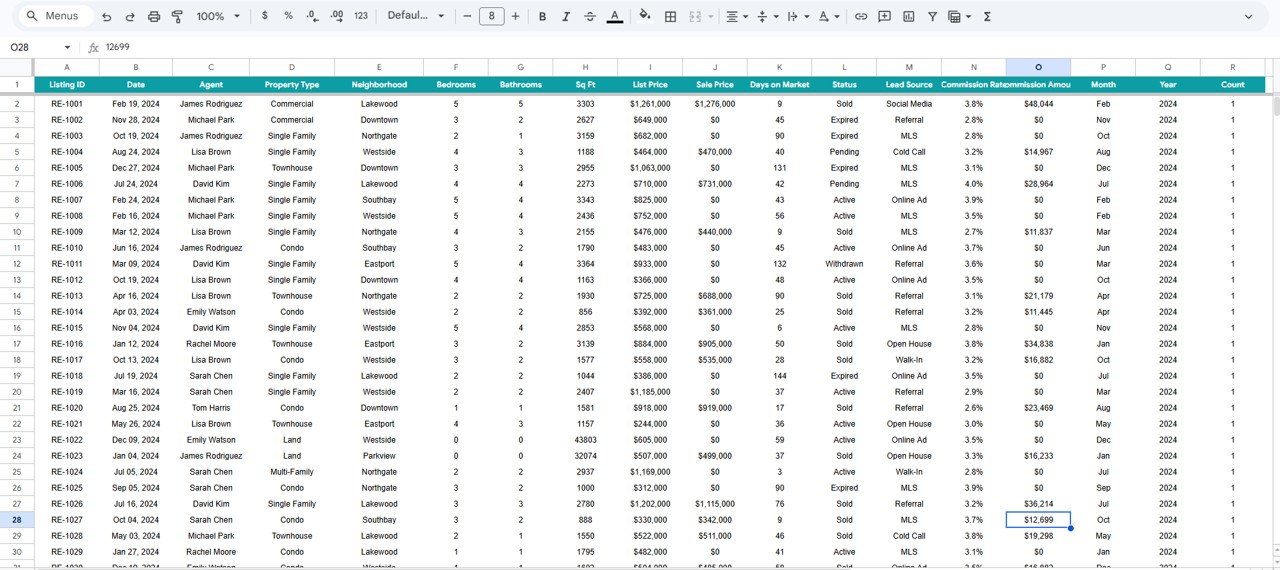 Data Sheet
You might also like the Real Estate Agent Dashboard in Power BI for advanced analytics, or the Rental Property Investment Dashboard in Google Sheets for property investment tracking.
⚙️ How to Use the Real Estate Agent Dashboard in Google Sheets
1️⃣ Purchase and download the template, then open the PDF guide to find your Google Sheets copy link
2️⃣ Click the link to create your own editable copy in Google Drive
3️⃣ Navigate to the Data Sheet tab and replace the sample data with your own listing records
4️⃣ All dashboard pages — Overview, Listings, Agent Performance, and Financial — update automatically
5️⃣ Use slicers and filters on the Overview page to drill into specific property types, neighborhoods, or time periods
6️⃣ Use the Search Sheet to look up any individual listing by ID
👥 Who Can Benefit from This Real Estate Agent Dashboard
🏠 Real estate agents tracking personal listings and commission performance
🏢 Brokerage managers monitoring team-wide agent performance and revenue
📊 Real estate analysts studying market trends across neighborhoods
💼 Team leads comparing agent close rates and deal volumes
🏘️ Property managers overseeing portfolio performance across multiple properties
❓ Frequently Asked Questions
What KPIs does the Real Estate Agent Dashboard in Google Sheets track?
The Real Estate Agent Dashboard in Google Sheets tracks 15+ key metrics across 4 analysis pages, including Total Listings, Total Sales Volume, Avg List Price, Avg Days on Market, Total Commission, Active/Pending/Sold Listings, Agent Close Rate, Commission per Deal, Sale to List Ratio, and Cumulative Commission Trends.
Can I use this dashboard without advanced Google Sheets skills?
Absolutely. Simply replace the sample data in the Data Sheet tab with your own records and all charts, KPI cards, and analysis pages update automatically. No formulas to write, no coding required.
How many dashboard pages does this template include?
This template includes 6 sheet tabs: Overview, Listings, Agent Performance, Financial, Search Sheet, and Data Sheet — giving you a complete real estate analytics solution in one file.
What is the best Google Sheets template for real estate agents?
The Real Estate Agent Dashboard in Google Sheets from NextGenTemplates is one of the most comprehensive real estate analytics templates available. It covers listings analysis, agent performance tracking, financial summaries, and individual listing search — all in a single Google Sheets file.
Does this template work on mobile devices?
Yes. Since it is built in Google Sheets, you can access the dashboard from any device with a browser, including smartphones and tablets via the Google Sheets app.
🔗 Explore Related Templates
🔹 Real Estate Agent Dashboard in Power BI — Advanced interactive real estate analytics with Power BI visuals
🔹 Real Estate Agent Dashboard in Excel — The same powerful dashboard built for Microsoft Excel users
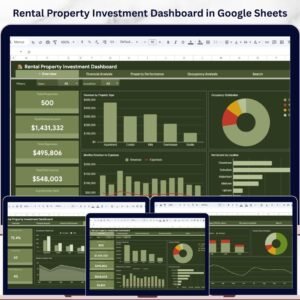
🔹 Rental Property Investment Dashboard in Google Sheets — Track rental income, expenses, and ROI for investment properties
🔹 Real Estate Agent Dashboard in HTML — A browser-based SaaS-style real estate analytics dashboard
📖 Click here to read the Detailed Blog Post
Watch the step-by-step video tutorial:


Reviews
There are no reviews yet.