

Real Estate Agent Dashboard in Excel is a comprehensive, pivot-powered analytics template designed for real estate professionals, brokerages, and sales managers who want to track agent performance, monitor commissions, analyze market trends, and evaluate property insights — all from a single powerful Excel dashboard. This template includes 5 interactive dashboard pages, a structured data sheet, and a support sheet with pivot tables that drive the entire dashboard dynamically 🚀.
If you have been looking for a ready-to-use Excel solution to manage your real estate sales data without building complex reports from scratch, the Real Estate Agent Dashboard in Excel is exactly what you need. This dashboard tracks 5 key performance indicators including Total Sales Value, Total Commission, Total Records, Avg. Days On Market, and Avg. Client Satisfaction. With interactive slicers and filters, you can instantly drill down into specific regions, property types, months, and agent names. Whether you are an individual real estate agent or managing a team, this dashboard delivers the insights you need to close more deals and maximize commissions.
Explore our complete range of Excel Dashboard Templates for every industry and department.
🔑 Key Features of Real Estate Agent Dashboard in Excel
📊 5 Interactive Dashboard Pages – Explore real estate data across Overview, Agent Performance, Market Analysis, Sales Trend, and Property Insights — each purpose-built for a unique analytical perspective.
📈 Dynamic KPI Cards – Instantly track high-level metrics including Total Sales Value, Total Commission, Total Records, Avg. Days On Market, and Avg. Client Satisfaction at a glance on the Overview page.
🔍 Advanced Slicers and Filters – Filter the entire dashboard by Region, Property Type, Agent Name, Transaction Type, Listing Status, and more with a single click for targeted real estate analytics.
💰 Commission and Sales Tracking – Compare Total Sales Value and Total Commission across regions, property types, months, and years to identify your most profitable segments.
👥 Agent Performance Analysis – Evaluate individual agent metrics with charts for Total Commission by Agent, Total Sold by Agent, and Avg. Days On Market by Agent to identify top performers and coaching opportunities.
🏘️ Market Analysis Insights – Analyze Total Sales Value and Total Listing Value by Neighborhood, Avg. Days On Market by Property Type, and Total Records by Lead Source to understand market dynamics.
📅 Sales Trend Monitoring – Track Total Sales Value and Total Commission by Year, Total Commission by Month, Total Sales Value by Transaction Type, and Total Records by Listing Status for time-based trend analysis.
🏠 Property Insights Module – Evaluate Total Sales Value by Bedrooms, Avg. Square Foot by Property Type, and Avg. Commission Per Sale by Region to optimize property strategies.
📋 Pivot-Powered Dynamic Updates – All charts and KPIs are powered by pivot tables in the Support sheet. Simply refresh the data to see your entire dashboard update automatically.
Also check out our Real Estate Agent Dashboard in HTML and Rental Property Investment Dashboard in Excel for related analytics solutions.
📦 What’s Inside the Real Estate Agent Dashboard in Excel
This dashboard contains 7 sheets — 5 interactive dashboard pages, 1 data entry sheet, and 1 support sheet with pivot tables.
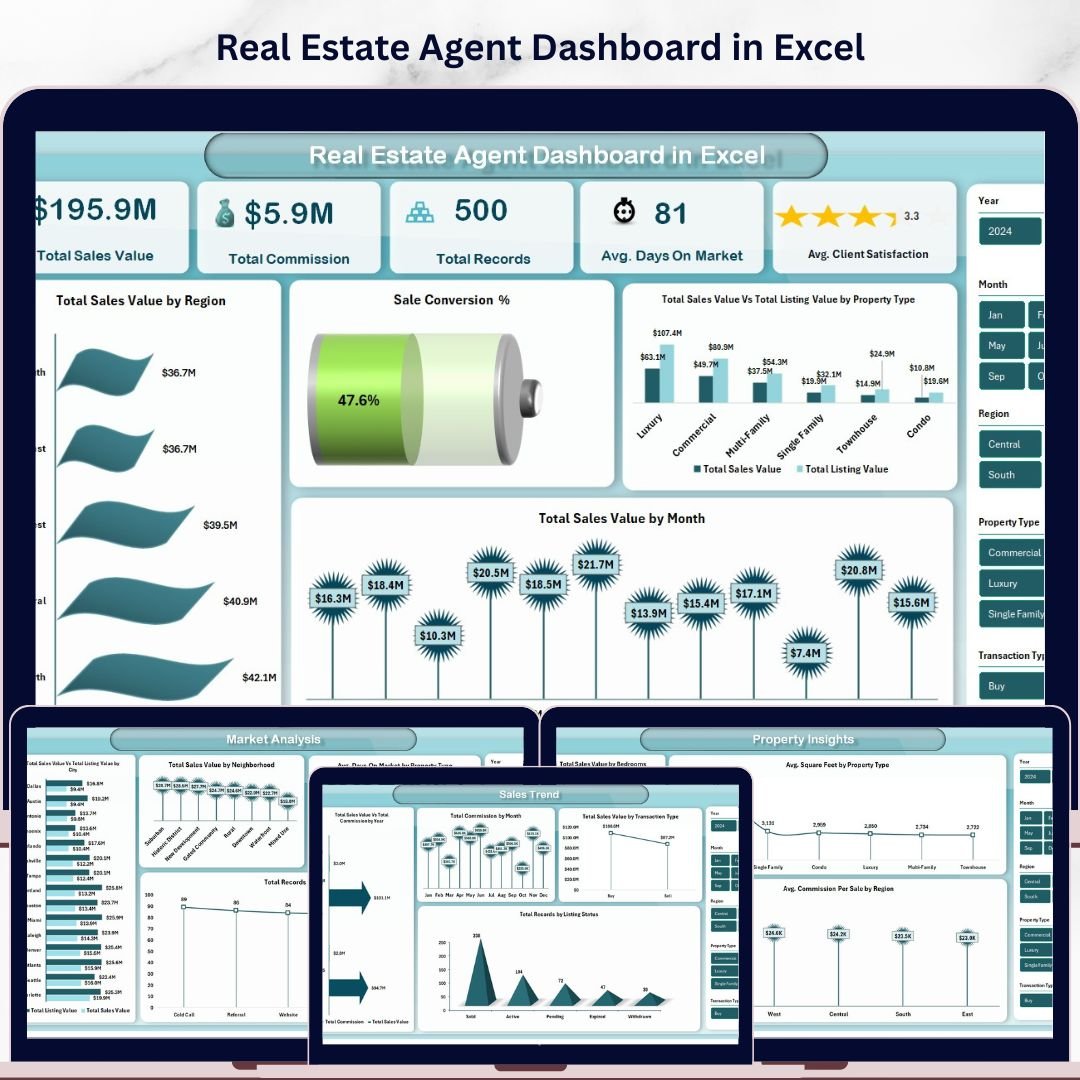
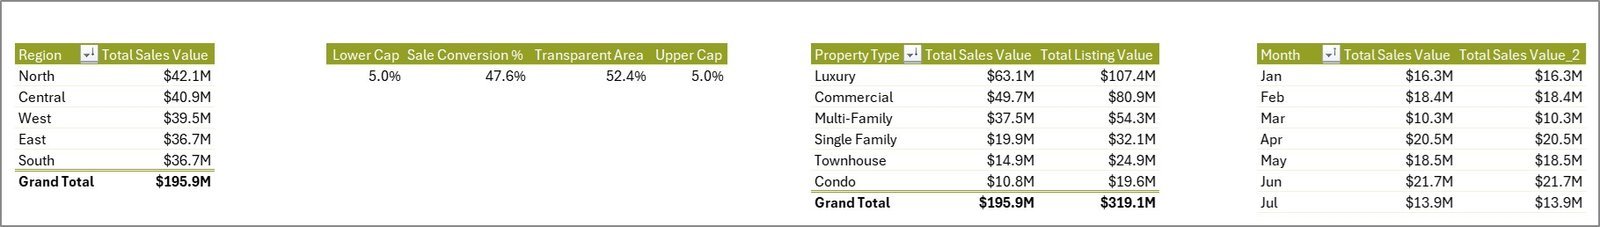
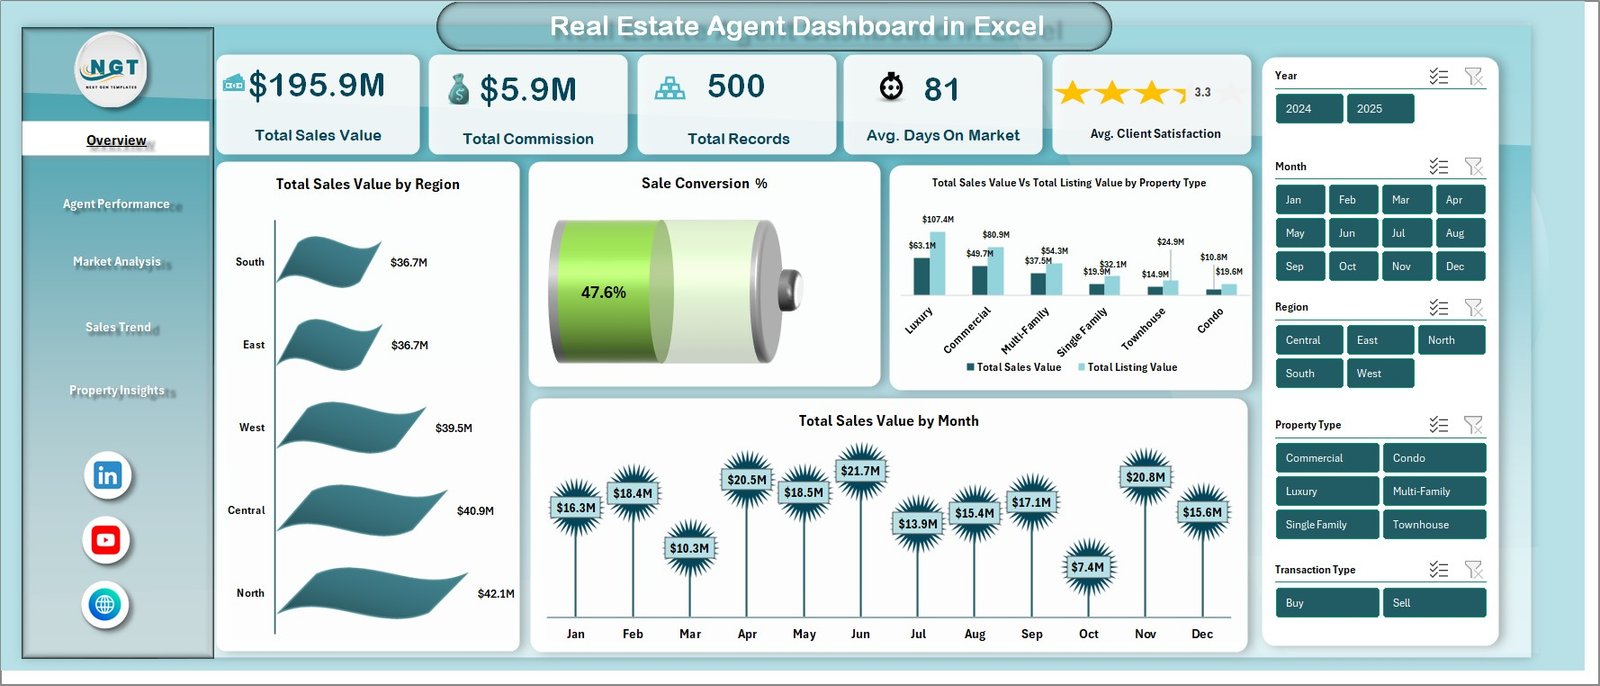
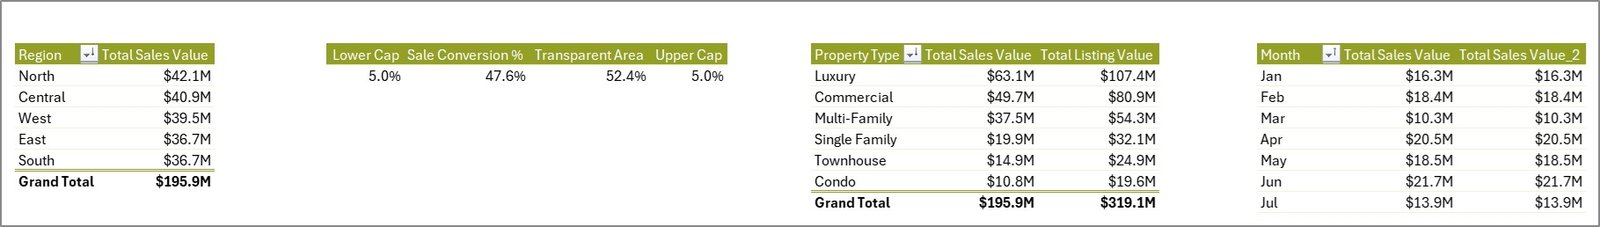
📌 Overview Page – Displays KPI cards for Total Sales Value, Total Commission, Total Records, Avg. Days On Market, and Avg. Client Satisfaction. Charts include Total Sales Value by Region, Sale Conversion %, Total Sales Value and Total Listing Value by Property Type, and Total Sales Value by Month. Multiple slicers let you filter and analyze the dashboard instantly.
Real Estate Agent Dashboard in Excel
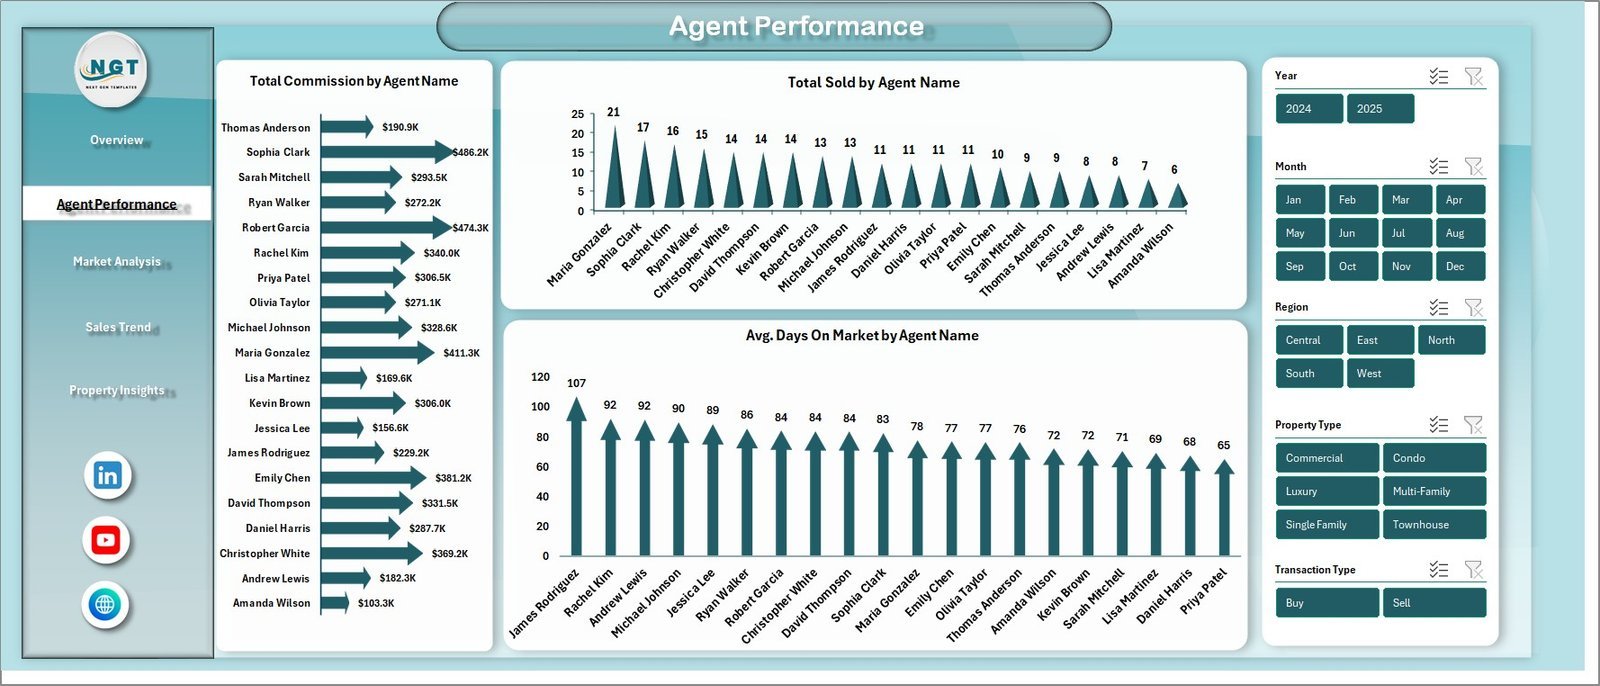
📌 Agent Performance – Analyzes individual agent metrics with charts for Total Commission by Agent Name, Total Sold by Agent Name, and Avg. Days On Market by Agent Name. Quickly identify your top-performing agents and areas for improvement.

Agent Performance
📌 Market Analysis – Provides location-based and source-based insights with charts for Total Sales Value and Total Listing Value by Neighborhood, Avg. Days On Market by Property Type, and Total Records by Lead Source.
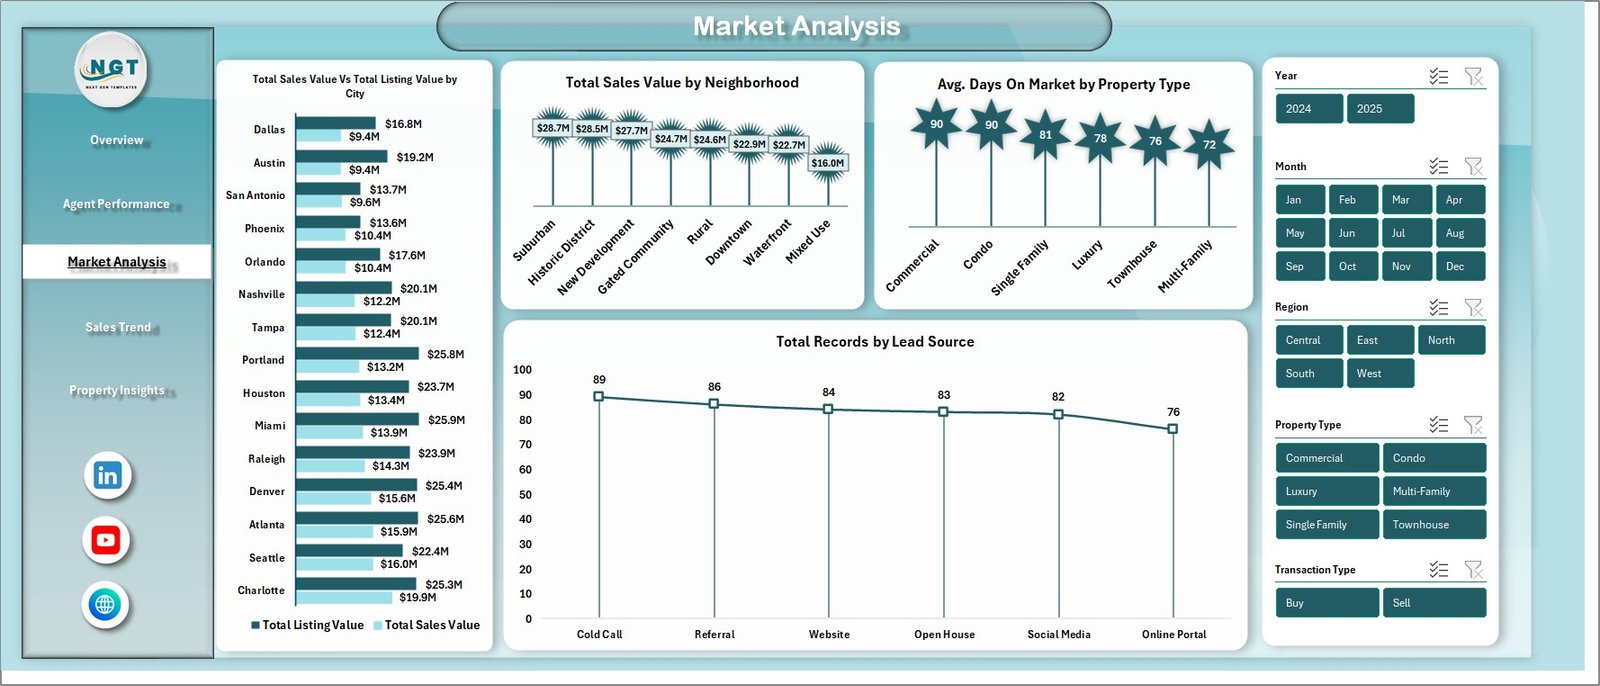
Market Analysis
📌 Sales Trend – Tracks time-based sales patterns with charts for Total Sales Value and Total Commission by Year, Total Commission by Month, Total Sales Value by Transaction Type, and Total Records by Listing Status.
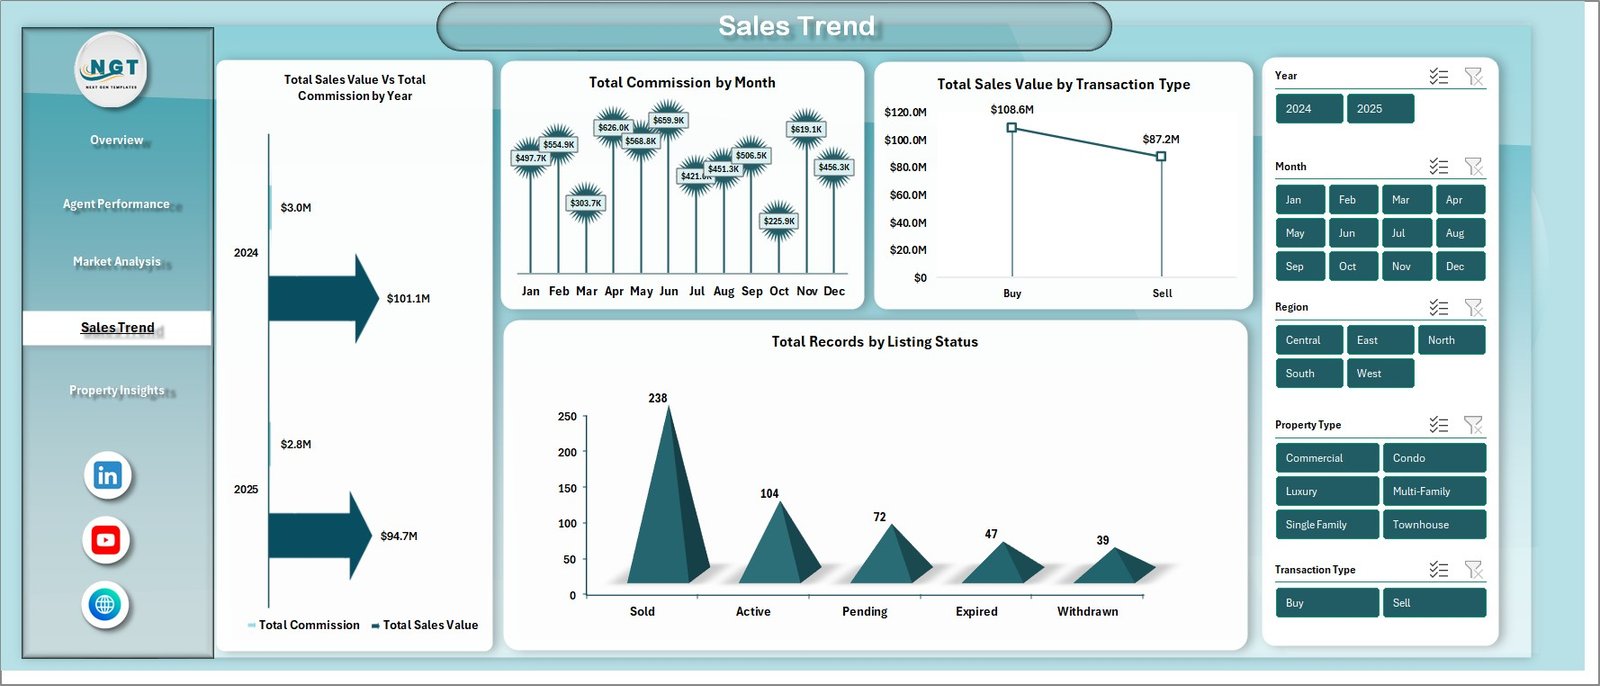
Sales Trend
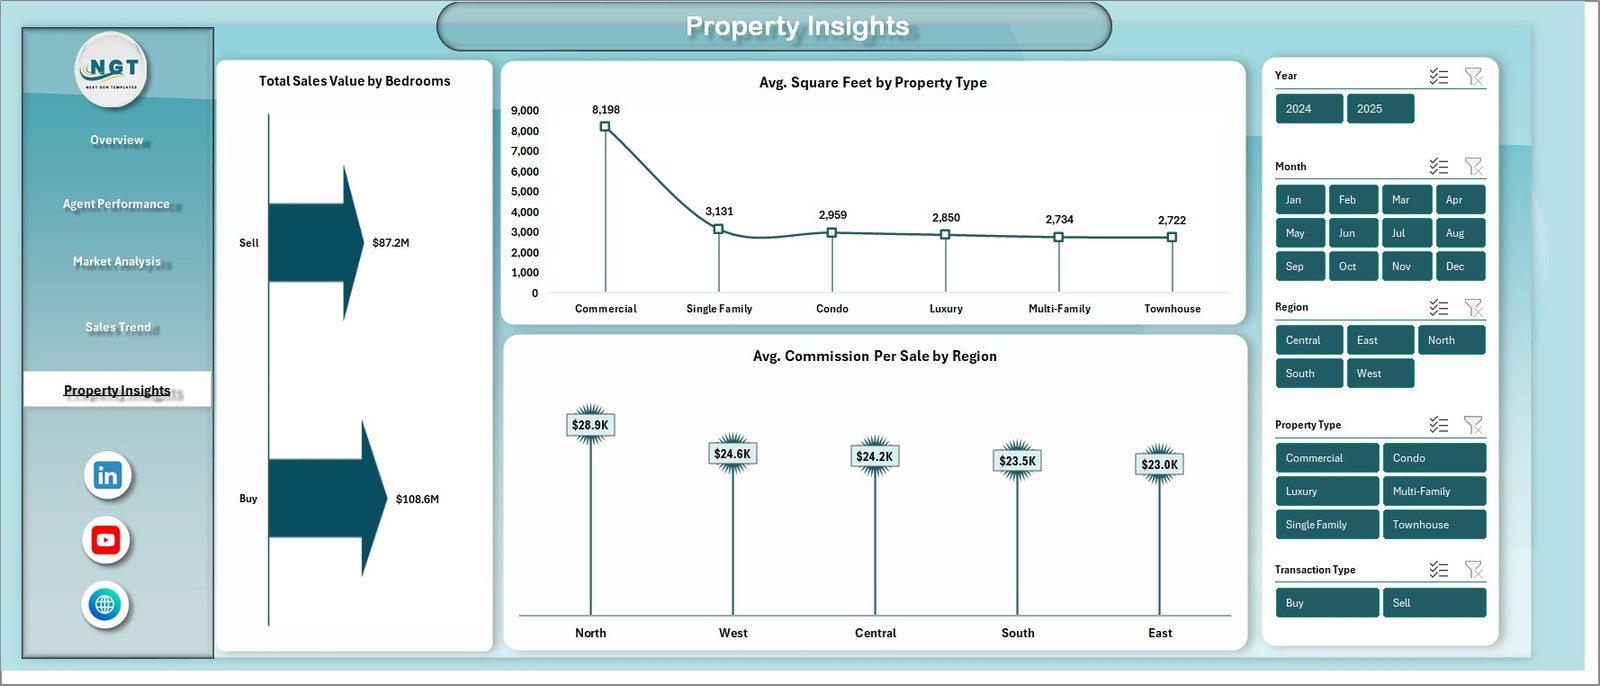
📌 Property Insights – Evaluates property-level analytics with charts for Total Sales Value by Bedrooms, Avg. Square Foot by Property Type, and Avg. Commission Per Sale by Region.

Property Insights
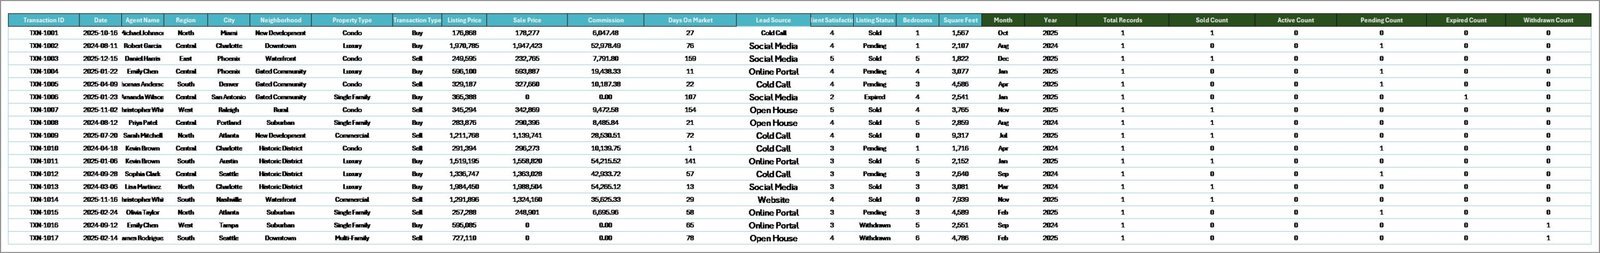
📌 Data Sheet – This is where you enter your real estate transaction data. Add your records in the same format provided and the dashboard will reflect your data after a simple refresh.

Data Sheet Tab
📌 Support Sheet – Contains multiple pivot tables that power the entire dashboard dynamically. After updating data, go to Data tab → Refresh All, and every chart and KPI card updates automatically. You can keep this sheet hidden.
Support Sheet Tab
⚙️ How to Use the Real Estate Agent Dashboard in Excel
1️⃣ Open the downloaded Excel file in Microsoft Excel (desktop version recommended for full slicer and pivot functionality).
2️⃣ Navigate to the Data Sheet tab and replace the sample data with your own real estate transaction records — including property type, region, agent name, sales value, commission, listing value, days on market, and more.
3️⃣ Go to the Data tab in the Excel Ribbon and click Refresh All to update all pivot tables and charts automatically.
4️⃣ Use the slicers on each dashboard page to filter by region, property type, agent name, transaction type, and other dimensions.
5️⃣ Explore each dashboard tab — Overview, Agent Performance, Market Analysis, Sales Trend, and Property Insights — for deep insights into your real estate business.
👥 Who Can Benefit from This Real Estate Agent Dashboard in Excel
🏘️ Real Estate Agents – Track personal sales, commissions, and client satisfaction metrics to improve performance.
🏢 Real Estate Brokerages – Monitor team productivity, compare agent performance, and identify coaching opportunities.
📊 Sales Managers – Analyze regional trends, property type performance, and monthly sales patterns for strategic planning.
💼 Real Estate Analysts – Generate data-driven insights for stakeholders with presentation-ready dashboard analytics.
🏠 Property Investors – Evaluate market trends, neighborhood performance, and property type returns for smarter investments.
❓ Frequently Asked Questions
What KPIs does the Real Estate Agent Dashboard in Excel track?
The Real Estate Agent Dashboard in Excel tracks 5 key performance indicators including Total Sales Value, Total Commission, Total Records, Avg. Days On Market, and Avg. Client Satisfaction. It also provides Sale Conversion %, commission analysis by agent, and property-level insights across 5 interactive dashboard pages.
Do I need advanced Excel skills to use this real estate dashboard?
No. Simply replace the sample data with your own real estate transaction records in the Data Sheet and click Refresh All. All charts, KPI cards, and pivot tables update automatically — no formulas or macros to configure.
How many dashboard pages does this template include?
This template includes 5 interactive dashboard pages — Overview, Agent Performance, Market Analysis, Sales Trend, and Property Insights — plus a Data Sheet for data entry and a Support Sheet with pivot tables.
Can I filter the dashboard by specific agents or regions?
Yes. The dashboard includes multiple slicers that let you filter by Region, Property Type, Agent Name, Transaction Type, Listing Status, Lead Source, and other dimensions for focused analysis.
What is the best Excel template for tracking real estate agent performance?
The Real Estate Agent Dashboard in Excel from NextGenTemplates is one of the best options available. It provides 5 analytical pages covering sales overview, individual agent performance, market analysis, sales trends, and property insights — all powered by dynamic pivot tables that auto-update when you refresh your data.
🔗 Explore Related Templates
🔹 Real Estate Agent Dashboard in HTML – The browser-based version of this dashboard with interactive charts and no software required.
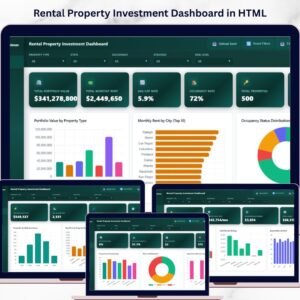
🔹 Rental Property Investment Dashboard in Excel – Track rental income, NOI, occupancy, and ROI across your property portfolio.
🔹 Rental Property Investment Dashboard in Power BI – Advanced Power BI analytics for rental property investment management.
📖 Click here to read the Detailed Blog Post
Watch the step-by-step video tutorial:


Reviews
There are no reviews yet.