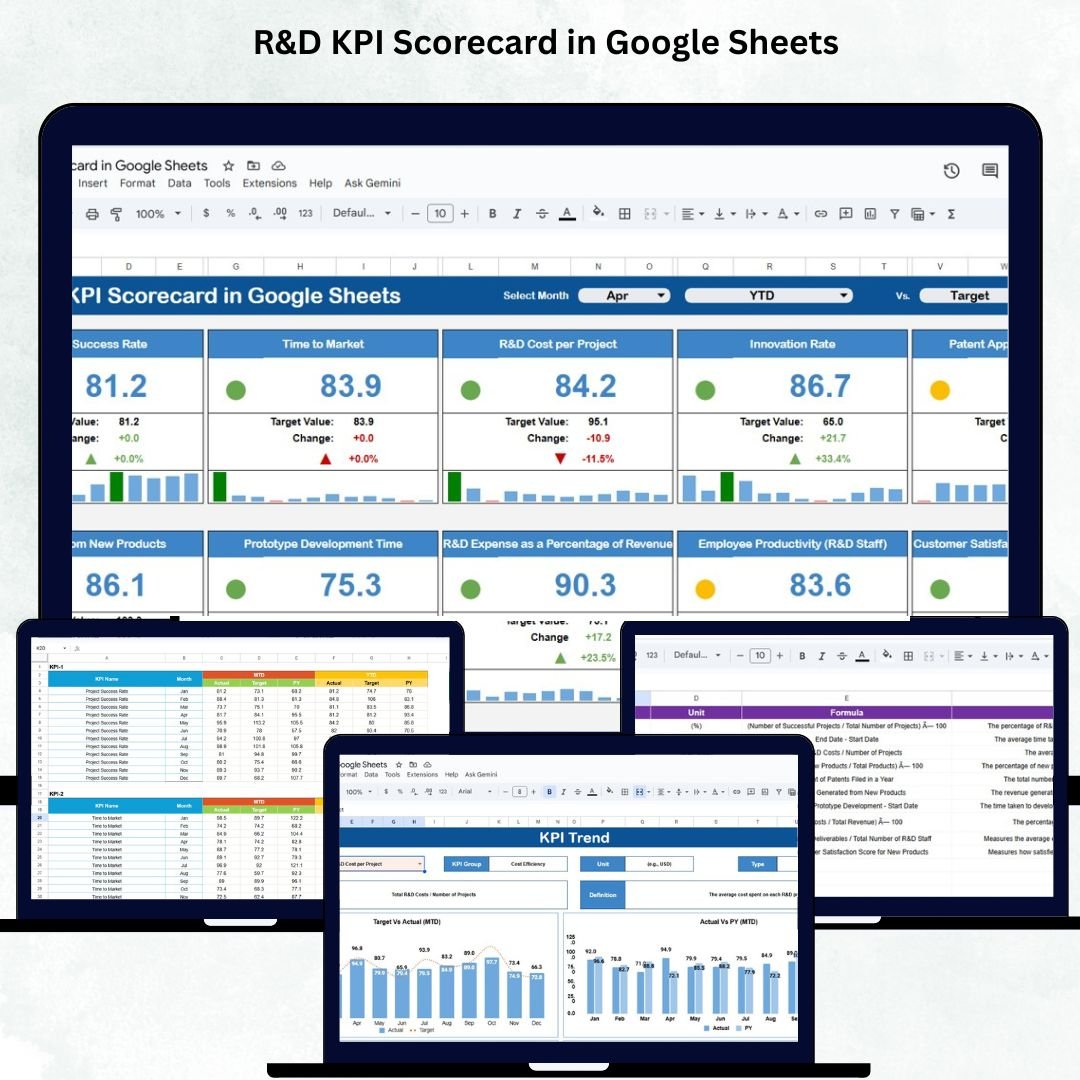
Innovation drives progress — but to manage innovation effectively, you need measurable insights. The R&D KPI Scorecard in Google Sheets is a ready-to-use performance management tool that helps organizations evaluate their research and development effectiveness with real-time data, automated KPIs, and interactive visuals. ⚙️📈
This smart, cloud-based scorecard empowers R&D managers, project leads, and executives to track productivity, resource efficiency, and innovation outcomes — all within a structured and easy-to-use Google Sheets dashboard.
🔑 Key Features of the R&D KPI Scorecard in Google Sheets
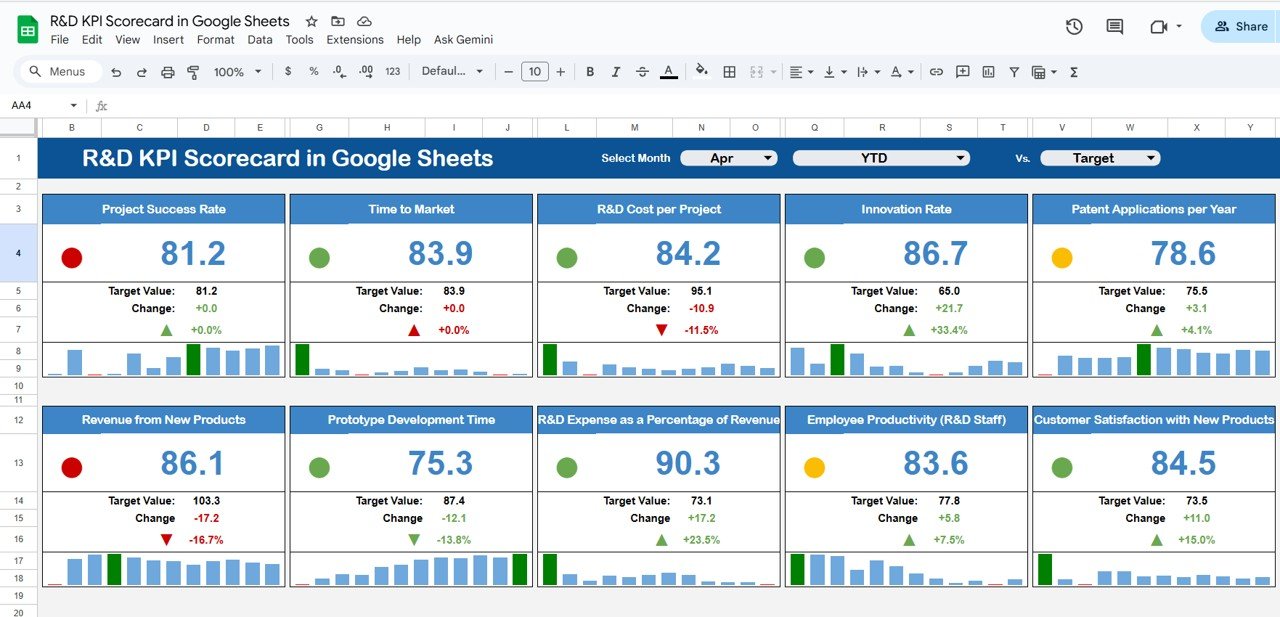
📋 Dashboard Sheet Tab (Main Interface)
Get a snapshot of your R&D department’s health in one visual dashboard.
✨ Features:
-
Month Selector (Cell D3): Instantly switch months to view dynamic data updates.
-
MTD/YTD View Toggle: Compare Month-to-Date and Year-to-Date performance with one click.
-
Comparative Insights:
-
Actual vs Target
-
Actual vs Previous Year
-
-
Visual Indicators:
-
🟢 Green Light: On or above target
-
🔴 Red Light: Below target
-
⬆️ Up Arrow: Performance improved
-
⬇️ Down Arrow: Performance declined
-
This sheet delivers instant visibility into performance trends, allowing leadership to identify strengths and gaps quickly.
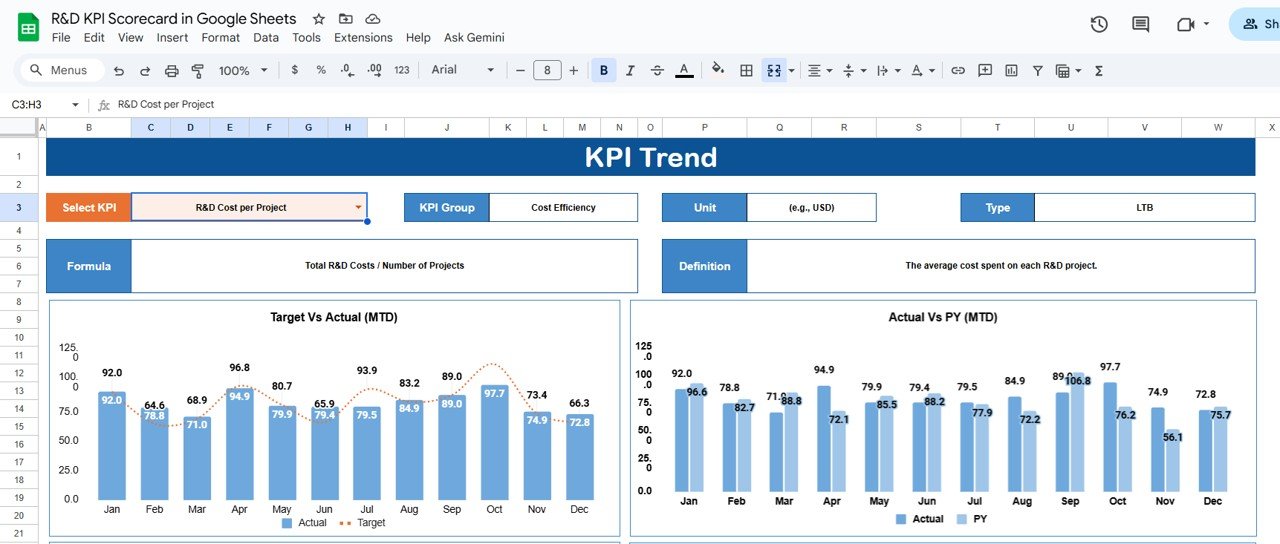
📈 Trend Sheet Tab (Performance Analysis)
This tab provides detailed monthly trends for each KPI.
💡 Features Include:
-
Select a KPI from the dropdown (Cell C3) for in-depth analysis.
-
Automatically display:
-
KPI Group
-
Unit of Measurement
-
KPI Type (UTB/LTB)
-
Formula & Definition
-
-
Dynamic trend charts showing month-by-month performance for actionable insights.
This feature helps spot improvement patterns or potential bottlenecks early.
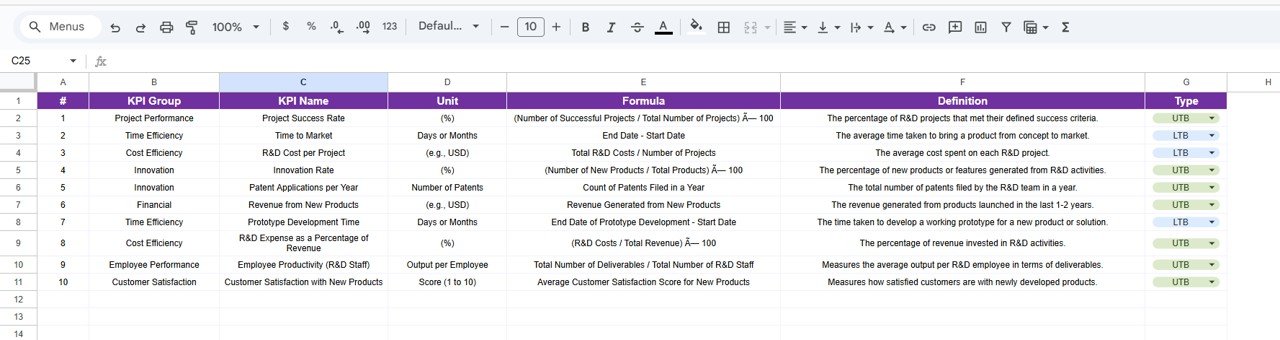
📊 KPI Definition Sheet Tab (Reference Sheet)
Maintain transparency and consistency across teams with clearly defined KPIs.
Includes columns for:
-
KPI Name & Group
-
Unit
-
Formula
-
Definition
-
Type (UTB – Upper the Better / LTB – Lower the Better)
This ensures every team member interprets KPIs uniformly and avoids misreporting.
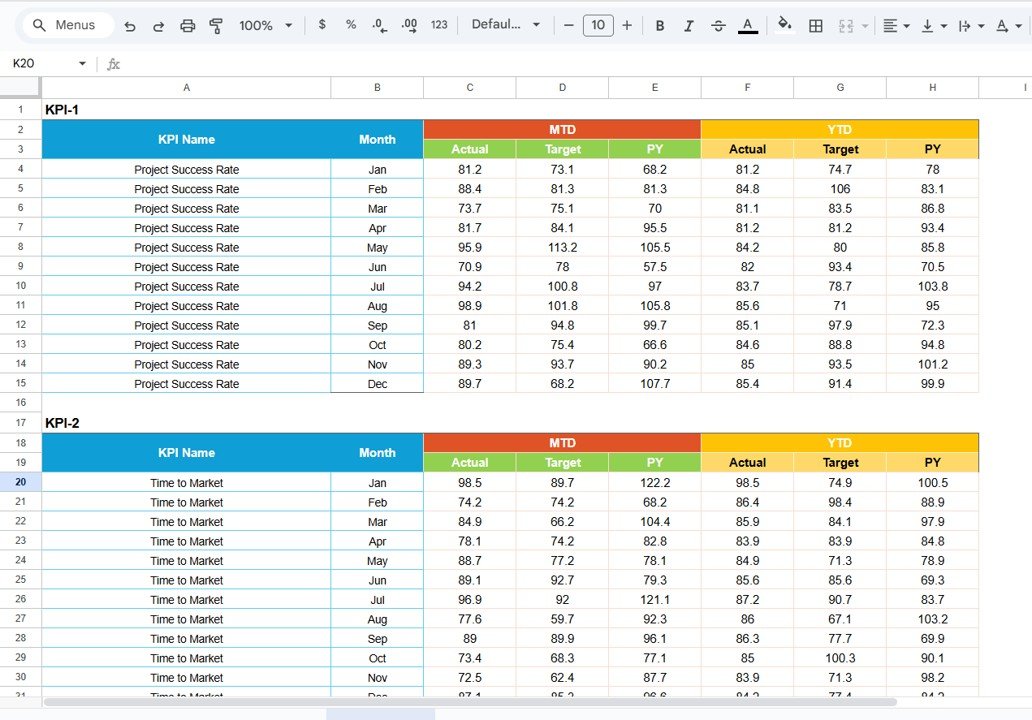
🧾 Data Input Sheet Tab (Data Entry)
The foundation of the entire scorecard. Input MTD and YTD data for each KPI — Actual, Target, and Previous Year values.
As soon as you update this sheet, the dashboard and trend charts auto-refresh, providing instant insights with zero manual recalculation.
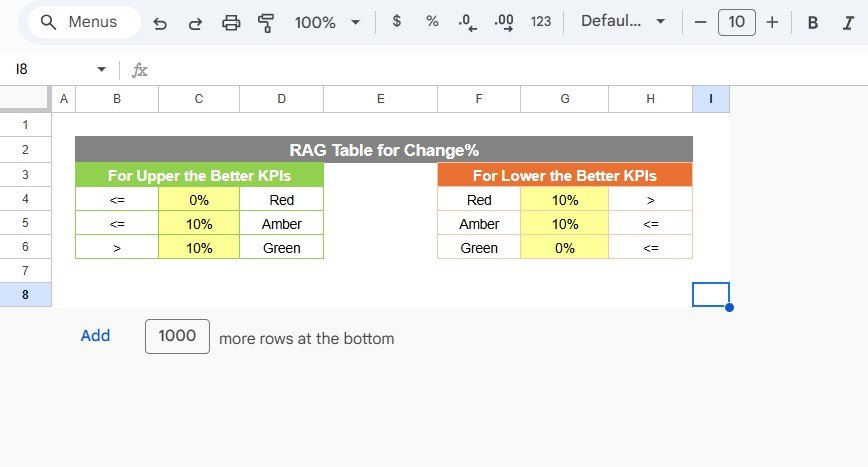
🎨 Color Settings Sheet Tab (Customization Controls)
Adjust visual thresholds and indicator settings effortlessly.
-
Define color codes for various performance levels (e.g., <80% = Red, >100% = Green).
-
Customize arrow symbols and traffic light logic.
Perfect for organizations that prefer tailored visuals and reporting standards.
📦 What’s Inside the R&D KPI Scorecard
✅ Pre-built Google Sheets dashboard with 100% editable setup
✅ Automated KPI calculations and visuals
✅ Trend analysis and monthly comparison
✅ KPI definition table for consistency
✅ Customizable color and threshold settings
✅ MTD & YTD toggle view for deeper insights
✅ Cloud collaboration for real-time access
Everything you need to evaluate R&D performance — all in one dynamic scorecard.
🧑💼 Who Can Benefit from This Scorecard
🎯 R&D Managers – Track innovation performance, budget utilization, and project outcomes.
🔬 Project Leads – Monitor progress against targets and detect performance dips.
🏢 Executives – Access real-time insights into innovation ROI and departmental efficiency.
💼 Startups & Enterprises – Perfect for both early-stage innovation teams and large corporate R&D divisions.
This scorecard transforms scattered R&D data into structured, visual insights that accelerate strategic decision-making.
🧪 How to Use the R&D KPI Scorecard
1️⃣ Enter KPI Data – Input Actual, Target, and Previous Year values in the Data Input sheet.
2️⃣ Select Month – Choose the month in the Dashboard tab to auto-update KPIs.
3️⃣ View Insights – Instantly visualize performance with traffic lights and arrows.
4️⃣ Analyze Trends – Open the Trend Sheet to explore month-by-month patterns.
5️⃣ Customize – Adjust visuals or thresholds in the Color Settings sheet.
💡 Pro Tip: Connect Google Forms or automation scripts to collect and update KPI data automatically from your R&D teams!
🌟 Why Choose This Scorecard
-
Real-time R&D performance tracking
-
Intuitive visualization through color-coded indicators
-
100% customizable metrics and layout
-
Fully cloud-based and shareable
-
Ideal for continuous innovation and strategic R&D improvement
The R&D KPI Scorecard in Google Sheets brings clarity and precision to innovation management — helping your organization stay focused, agile, and future-ready. 🌟


Reviews
There are no reviews yet.