
A powerful railway system supports the growth of every nation—but managing such a large network requires real-time visibility, accurate insights, and fast decision-making. The Railways KPI Dashboard in Power BI is designed to help railway teams track performance with clarity, improve operational efficiency, and monitor critical KPIs with ease. Whether you manage routes, safety, punctuality, freight movement, or maintenance, this dashboard helps you stay in control with clean visuals and automated reporting.Railways KPI Dashboard in Power BI
Built using Excel as the data source and Power BI as the analytics platform, this ready-to-use dashboard converts railway data into interactive charts, KPI tables, slicers, and drill-through insights. With just a quick refresh, you can view updated MTD (Month-to-Date), YTD (Year-to-Date), and PY (Previous Year) comparisons. It’s the perfect tool for railway departments that want accuracy, speed, and smarter performance tracking.Railways KPI Dashboard in Power BI
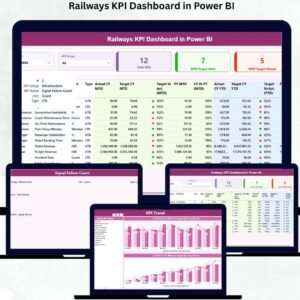
🚆 Key Features of the Railways KPI Dashboard in Power BI
The dashboard comes packed with powerful features that simplify railway reporting and empower teams to take faster decisions:
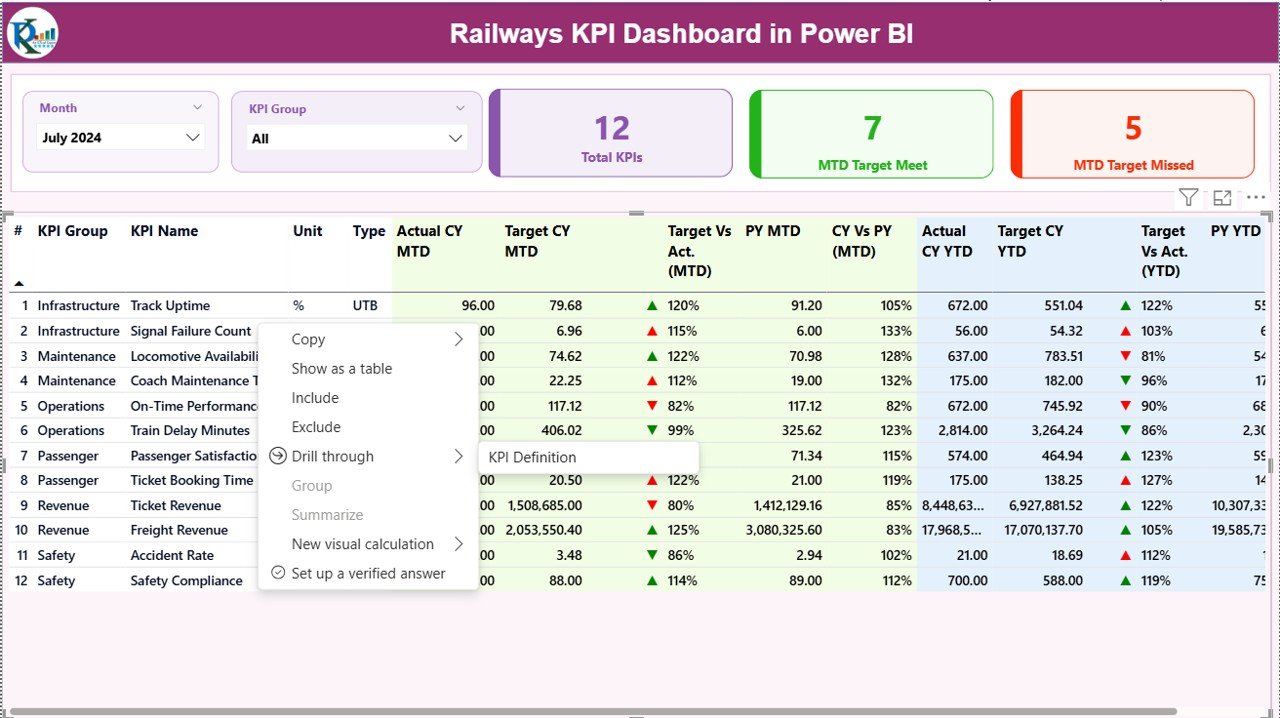
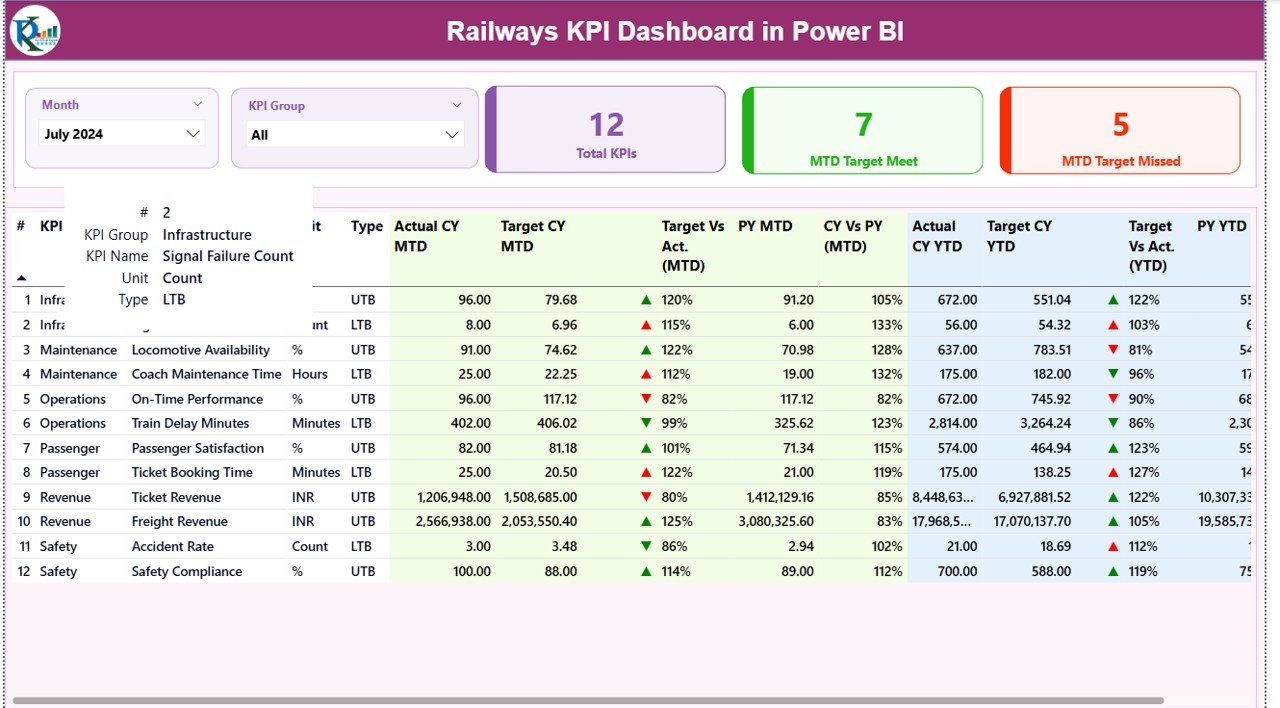
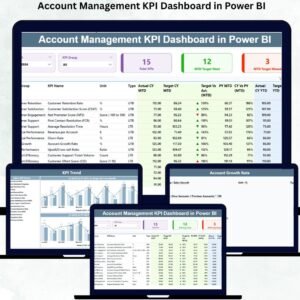
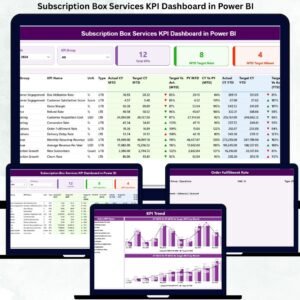
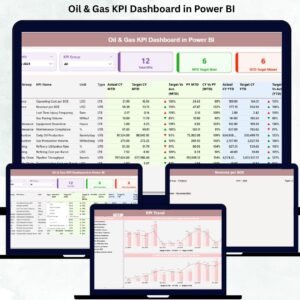
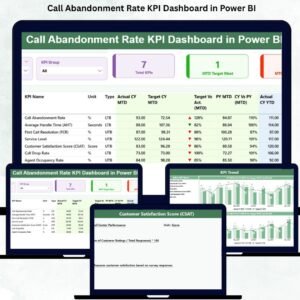
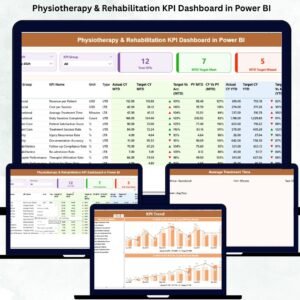
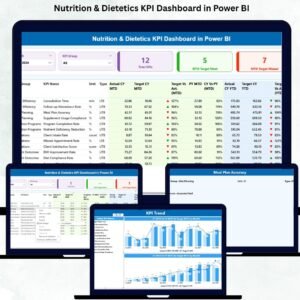
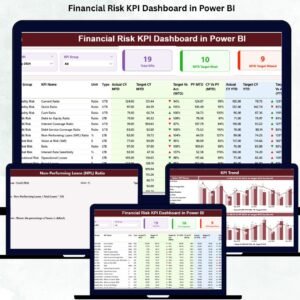
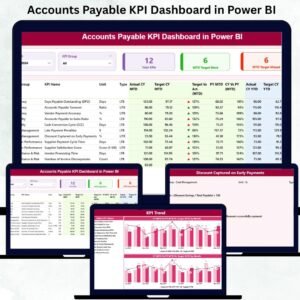
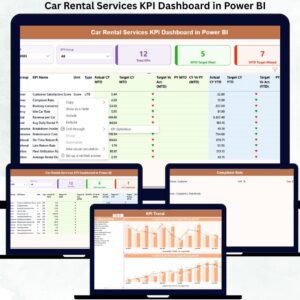
✨ Interactive Summary Page – View complete performance in one place using Month and KPI Group slicers.
📊 MTD & YTD Analysis – Track current performance, identify misses, and compare results with targets and previous year metrics.
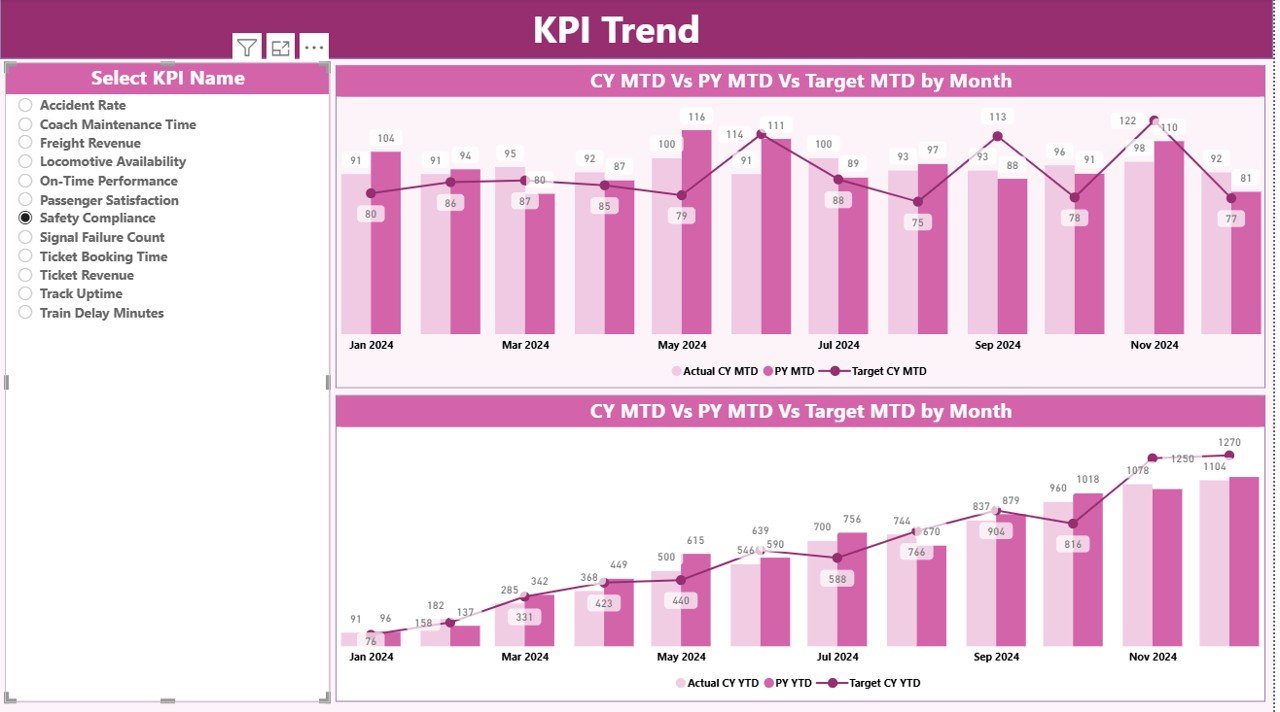
📈 KPI Trend Charts – Analyze month-wise patterns, seasonal changes, and yearly improvements.
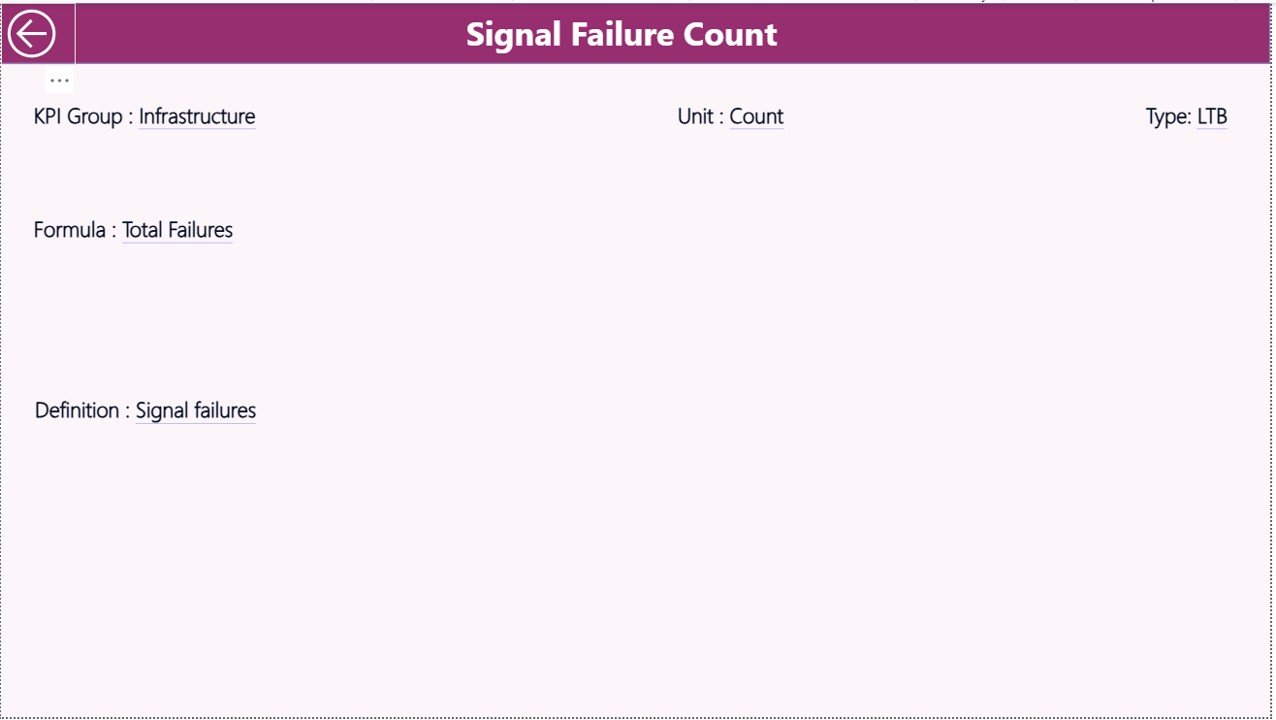
📘 Automated KPI Definitions – Drill into KPI details such as formulas, units, and LTB/UTB types for deeper understanding.
⚡ Excel-Based Input – Update only the Excel sheets and Power BI refreshes everything automatically.
🟢 Performance Icons – Clear green and red arrows instantly highlight KPIs that need attention.
🛠️ Ready-to-Use Visuals – Includes cards, tables, combo charts, slicers, navigation panels, and drill-through options.
📂 What’s Inside the Railways KPI Dashboard in Power BI
The product includes a structured and professionally designed Power BI file along with Excel data templates:
📁 Power BI Dashboard (.pbix)
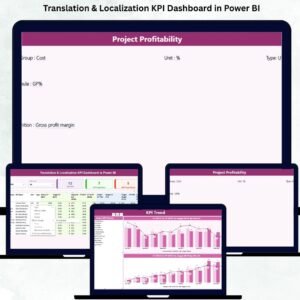
• Summary Page
• KPI Trend Page
• KPI Definition Page
📘 Excel Input File
• Actual Data Sheet (MTD & YTD values)
• Target Data Sheet (Monthly Targets)
• KPI Definition Sheet (Formula, Unit, Type, Group)
📝 Full KPI Structure
• KPI Number
• KPI Group
• KPI Name
• Formula & Definition
• Unit of Measurement
• Lower the Better (LTB) / Upper the Better (UTB)
📊 Visualization Pack
• KPI Cards
• Trend Charts
• Comparison Metrics
• Conditional Icons
• Drill-through Insights
This complete package ensures you don’t have to build anything from scratch—just update your Excel sheets and you’re ready to analyze railway performance in seconds.
🧭 How to Use the Railways KPI Dashboard in Power BI
Using the dashboard is simple and requires no technical or coding skills:
-
Open the Power BI Desktop file
-
Update data in the Excel sheets (Actual, Targets, KPI Definitions)
-
Click Refresh to update visuals
-
Select Month or KPI Group from filters
-
Analyze Summary Page for instant performance updates
-
Check KPI Trend Page for monthly variations
-
Use Drill-Through to understand KPI formulas and definitions
-
Share insights with teams and decision-makers
With this dashboard, your monthly reporting becomes faster, clearer, and highly accurate.
👥 Who Can Benefit from This Railways KPI Dashboard?
This dashboard is designed specifically for railway professionals and teams responsible for performance management:
🚉 Railway Operations Managers – Track punctuality, efficiency, and delays
🛠️ Maintenance Departments – Monitor breakdown patterns and resource usage
📦 Freight Teams – View freight volume, delays, and revenue KPIs
👥 Customer Service Departments – Track satisfaction scores and complaints
🧮 Data Analysts & BI Teams – Simplify reporting and automate analysis
📊 Leadership Teams – Get a complete snapshot of railway performance in seconds
Whether you manage passenger services, freight routes, or overall railway operations, this dashboard helps you make data-driven decisions instantly.


Reviews
There are no reviews yet.