In today’s competitive business world, organizations can’t afford to make decisions without reliable insights. 📊 Monitoring quality is no longer about checking final outputs—it’s about ensuring consistency, efficiency, and continuous improvement across all processes. That’s why the Quality KPI Scorecard in Excel is a must-have for modern businesses.
This ready-to-use Excel tool helps you track, evaluate, and compare quality KPIs against targets in a structured and visual way. Instead of scattered reports, the scorecard consolidates everything into one place—making performance monitoring simple, transparent, and actionable. 🚀
✨ Key Features of the Quality KPI Scorecard in Excel
✔ 4 Structured Worksheets – Includes Scorecard, KPI Trend, Input Data, and KPI Definition sheets for complete coverage.
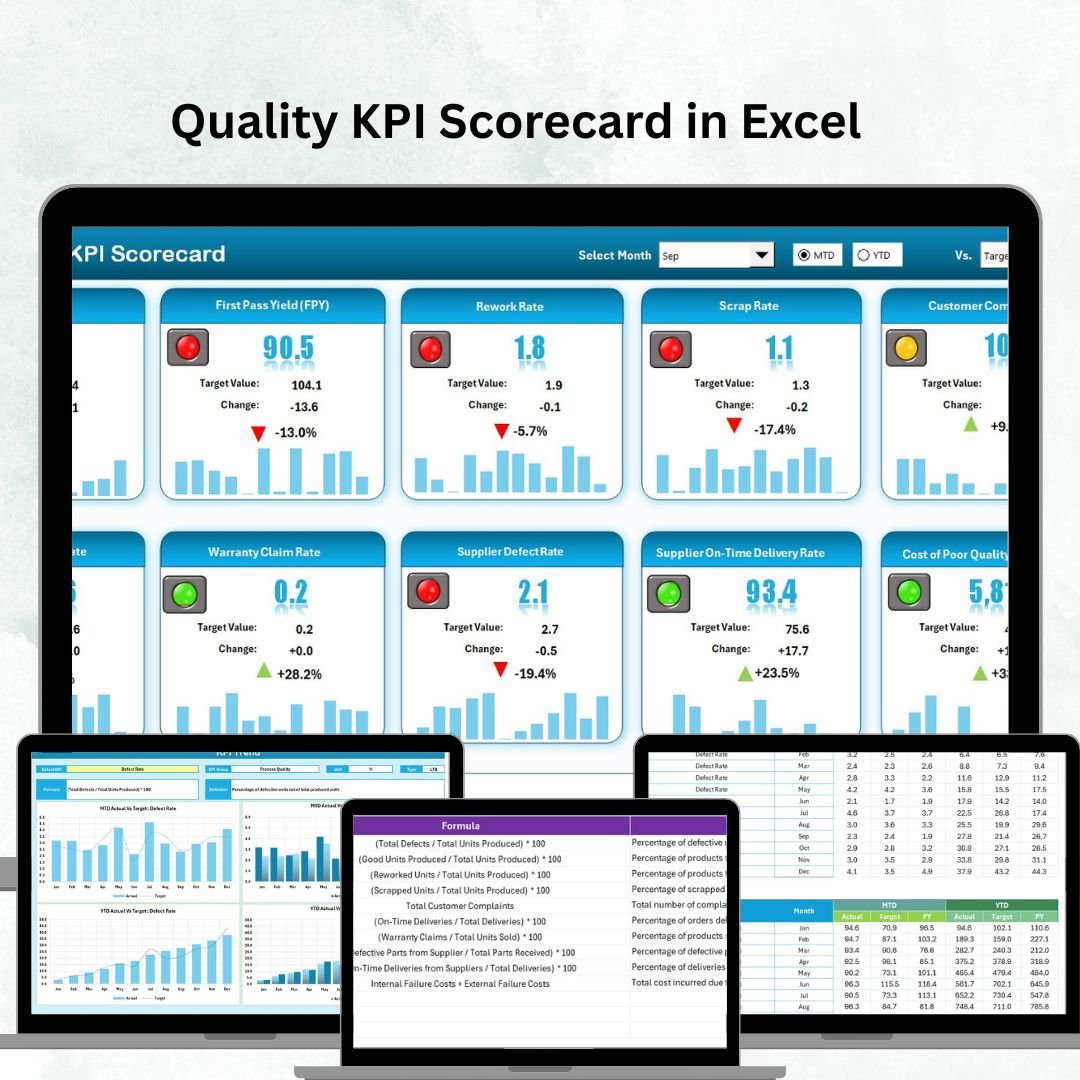
✔ Scorecard Dashboard – Central sheet with dropdowns for Month selection, MTD & YTD view, Actual vs Target comparisons, and visual indicators.
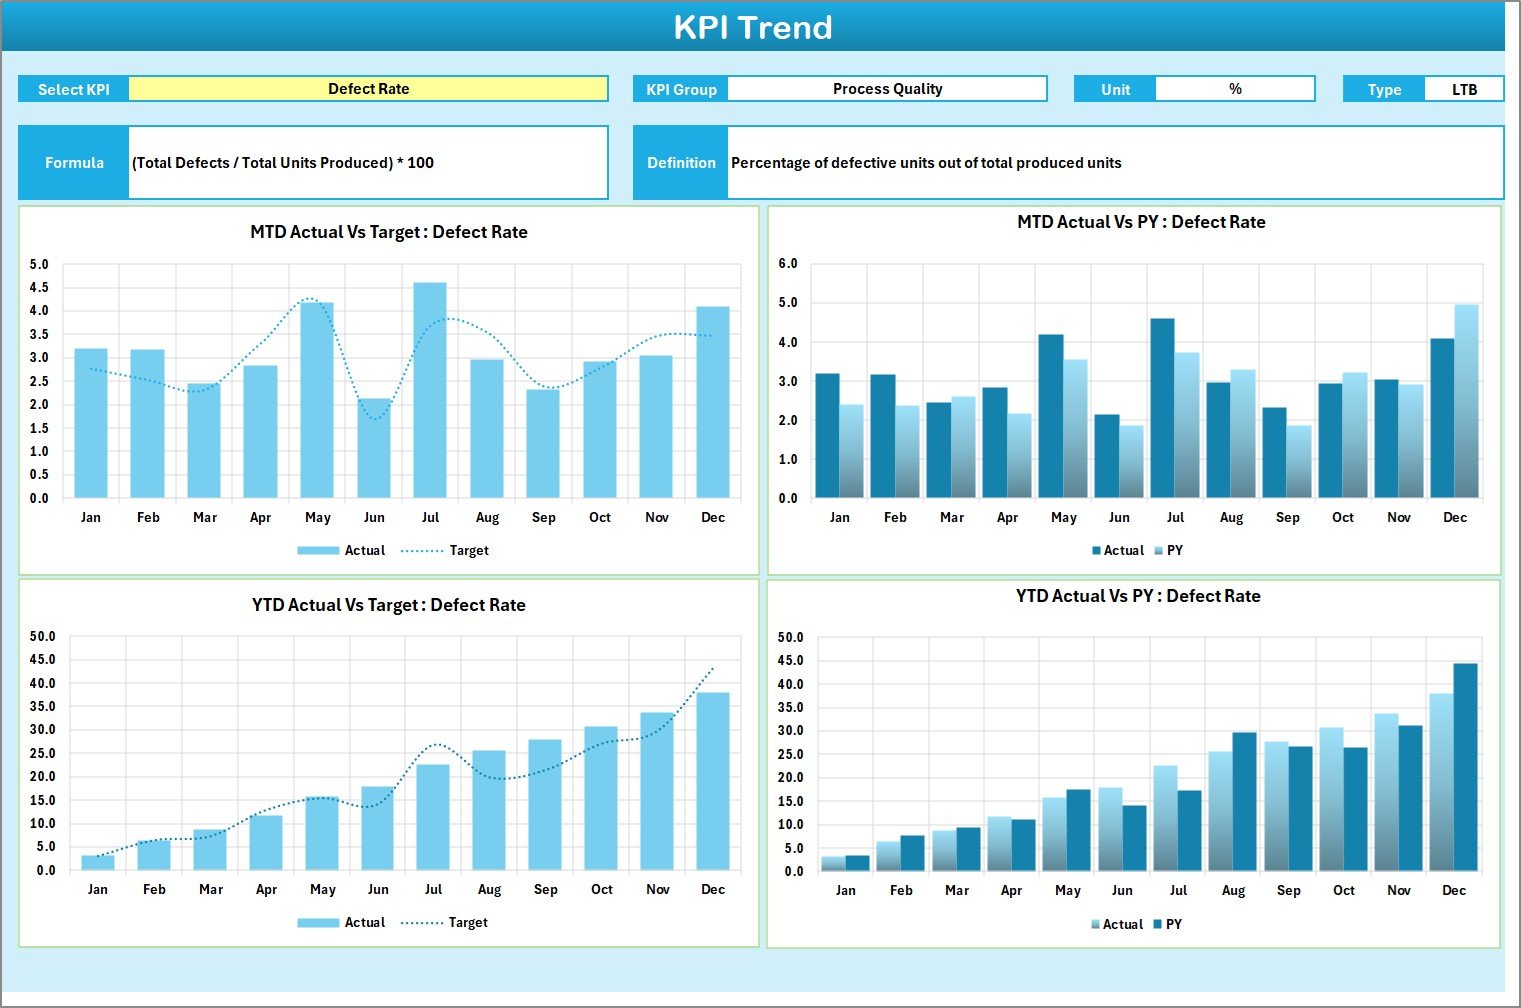
✔ KPI Trend Analysis – Drill into specific KPIs with dropdown filters and review historical charts, formulas, and definitions.
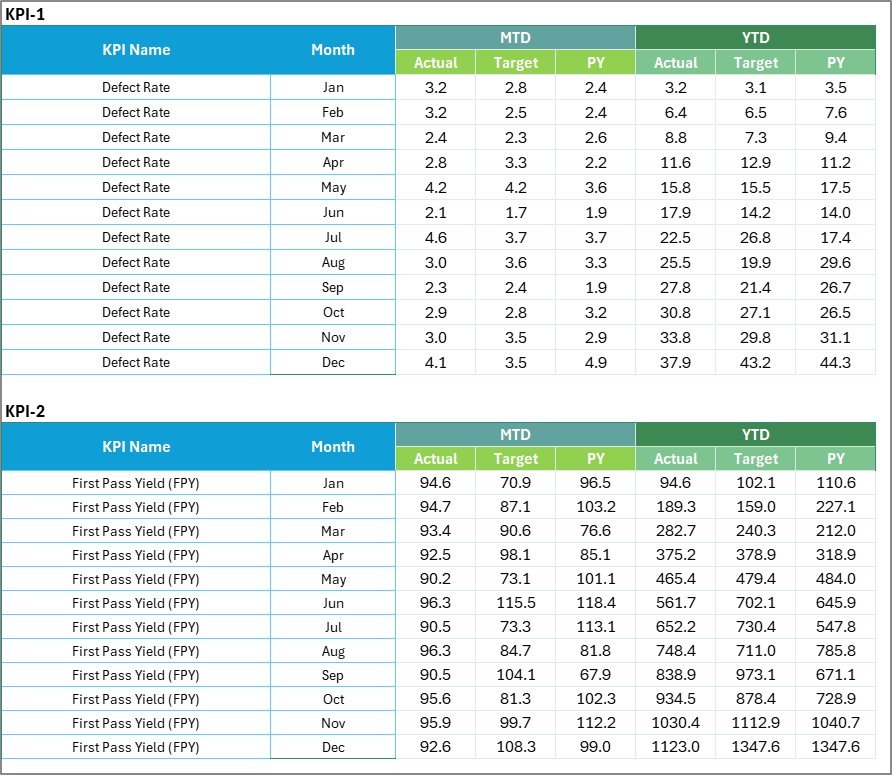
✔ Data Entry Made Simple – Input sheet acts as a single source of truth for all actual values and targets.
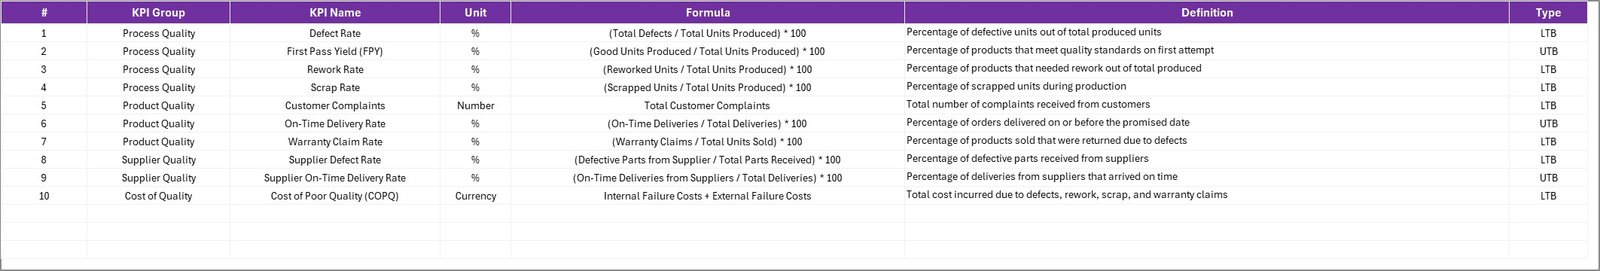
✔ Standardized KPI Definitions – Keep metrics consistent across teams with a dedicated reference sheet.
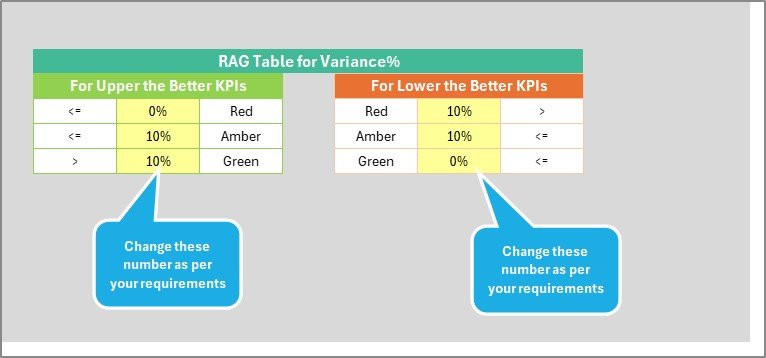
✔ Visual Performance Highlights – Use color codes and arrows to instantly identify gaps or improvements.
✔ Fully Customizable – Add or remove KPIs, adjust formulas, or expand charts to meet business-specific needs.
📂 What’s Inside the Quality KPI Scorecard
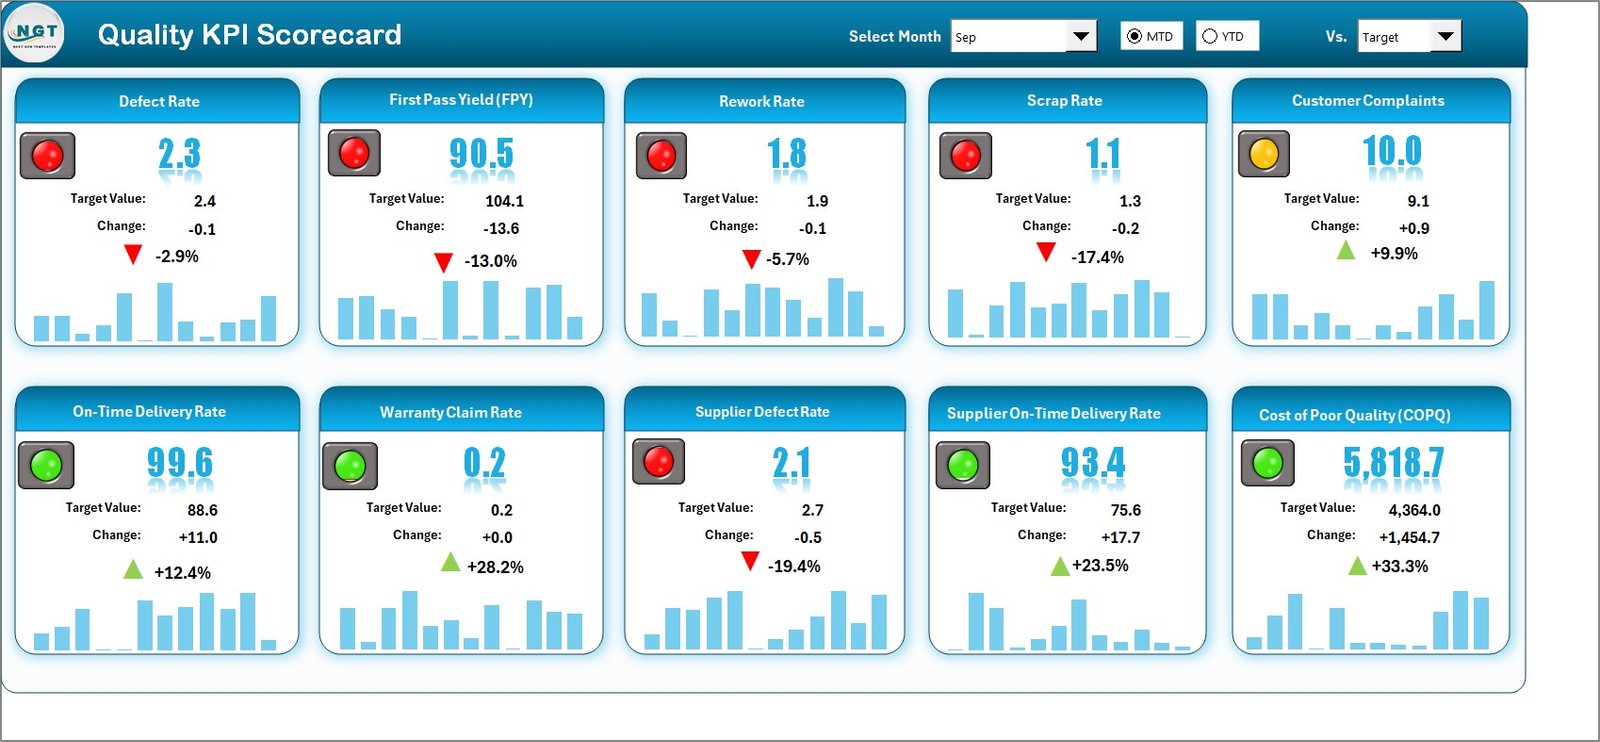
🔹 Scorecard Sheet – Your one-stop dashboard to monitor MTD & YTD KPI performance with targets and visual alerts.
🔹 KPI Trend Sheet – Drill down into long-term KPI performance with detailed metadata and charts.
🔹 Input Data Sheet – Enter actual and target values regularly to keep the scorecard accurate.
🔹 KPI Definition Sheet – Store KPI details such as Name, Unit, Formula, and Definition for consistency.
🛠️ How to Use the Quality KPI Scorecard in Excel
-
Download & Open – Works directly in Excel, no special tools required.
-
Set KPI Definitions – Use the KPI Definition sheet to add or adjust metrics.
-
Enter Data – Update the Input Data Sheet with actual and target values.
-
Select Month & Range – In the Scorecard, choose the month and view MTD or YTD results.
-
Analyze Trends – Use the KPI Trend Sheet for performance over time.
-
Compare Against Targets – Instantly see gaps with Actual vs Target comparisons.
-
Review Regularly – Keep data updated weekly or monthly for accuracy.
👥 Who Can Benefit from This Scorecard?
✅ Manufacturing Teams – Track defects, rework rates, and compliance.
✅ Healthcare Providers – Monitor patient satisfaction, error rates, and service efficiency.
✅ Retail & E-commerce – Evaluate returns, delivery accuracy, and customer satisfaction.
✅ Education Institutions – Measure student performance, feedback scores, and quality of teaching.
✅ IT & Software Teams – Monitor bug resolution time, uptime, and testing coverage.
✅ Executives & Managers – Get a clear, structured view of overall quality performance.
By using the Quality KPI Scorecard in Excel, organizations can:
💡 Identify quality gaps before they escalate.
💡 Monitor both short-term and long-term performance trends.
💡 Standardize KPI definitions across departments.
💡 Save costs compared to BI tools.
💡 Enhance decision-making with visual, data-driven insights.
This scorecard isn’t just a reporting tool—it’s a quality improvement system that helps businesses scale with confidence and consistency. 🌟


Reviews
There are no reviews yet.