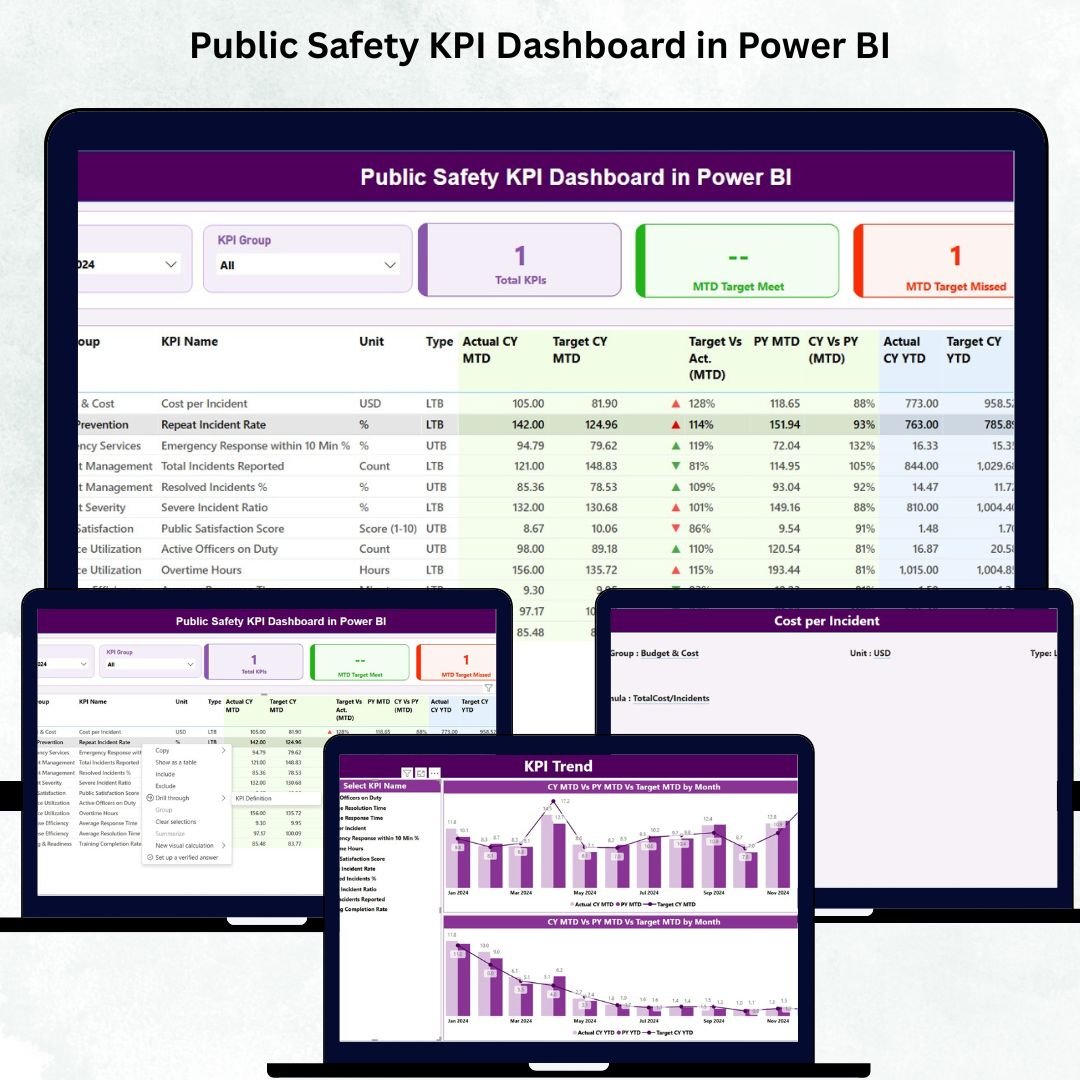
A safer community begins with accurate, real-time data. The Public Safety KPI Dashboard in Power BI is a powerful, ready-to-use analytics tool designed for police departments, emergency response teams, disaster management authorities, security units, municipal councils, and public safety agencies. Instead of juggling multiple spreadsheets or scattered data sources, this dashboard brings all your critical KPIs together in one interactive, easy-to-use visual system. With just a click, you can track crime trends, monitor emergency response time, review compliance metrics, compare current performance with targets, and evaluate year-over-year improvements. 🚨📊
This dashboard transforms the way public safety teams monitor and interpret their performance. Whether you’re analyzing crime reduction progress, traffic safety improvements, response time efficiency, or community engagement metrics—everything is displayed clearly, visually, and instantly. No technical expertise required. Simply update the Excel file, refresh the report, and your dashboard is ready with fresh insights.
✨ Key Features of Public Safety KPI Dashboard in Power BI
This dashboard is designed with simplicity, clarity, and speed in mind. Key features include:
🔹 Interactive Slicers
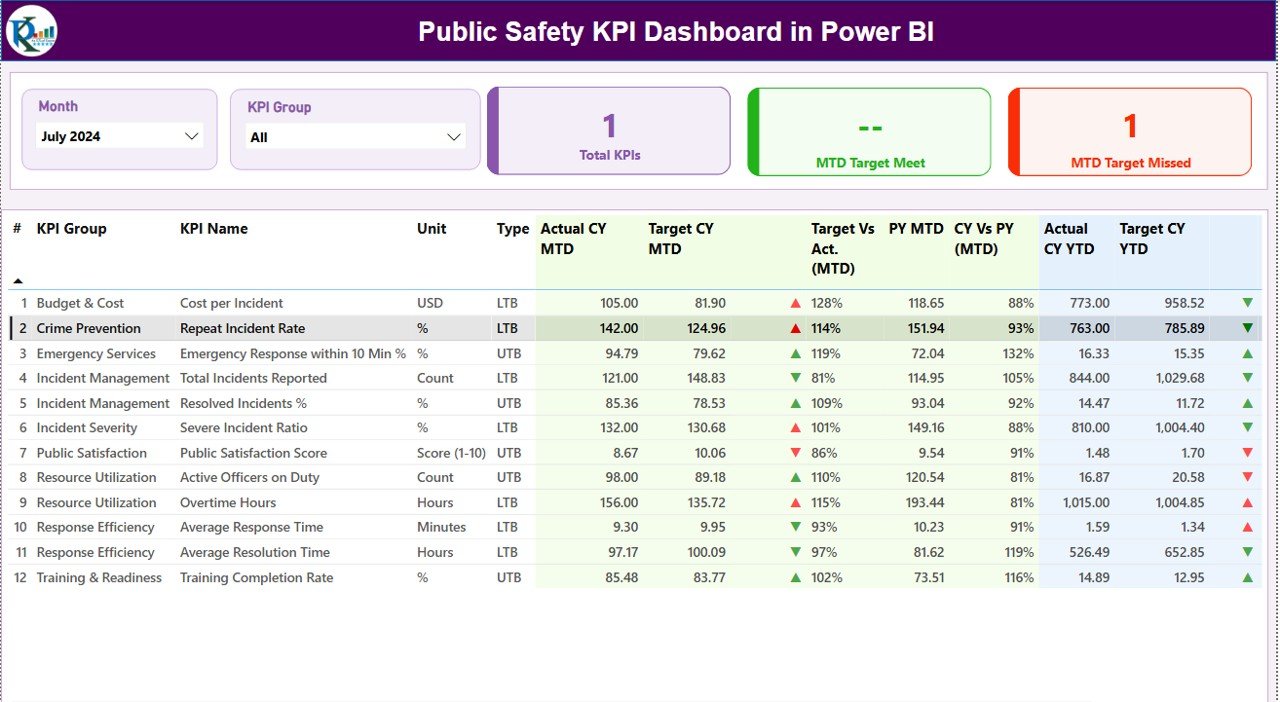
Easily filter KPIs by Month or KPI Group such as Crime, Traffic Safety, Incident Response, or Community Policing.
🔹 Performance Cards
Get quick insights with Total KPIs, MTD Target Met, and MTD Target Missed—helping managers review overall performance instantly.
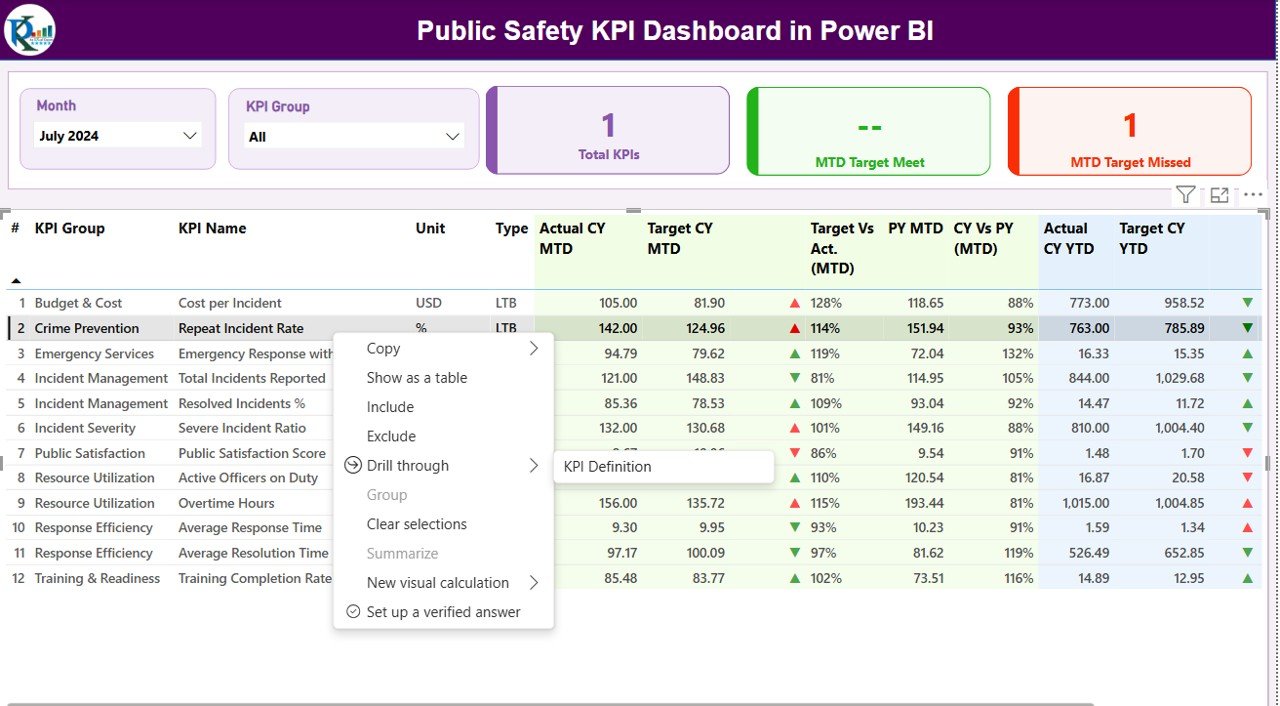
🔹 Detailed KPI Table
Analyze every metric in detail including Actual vs Target, CY vs PY, MTD & YTD performance, icons for trend direction, KPI type, and more.
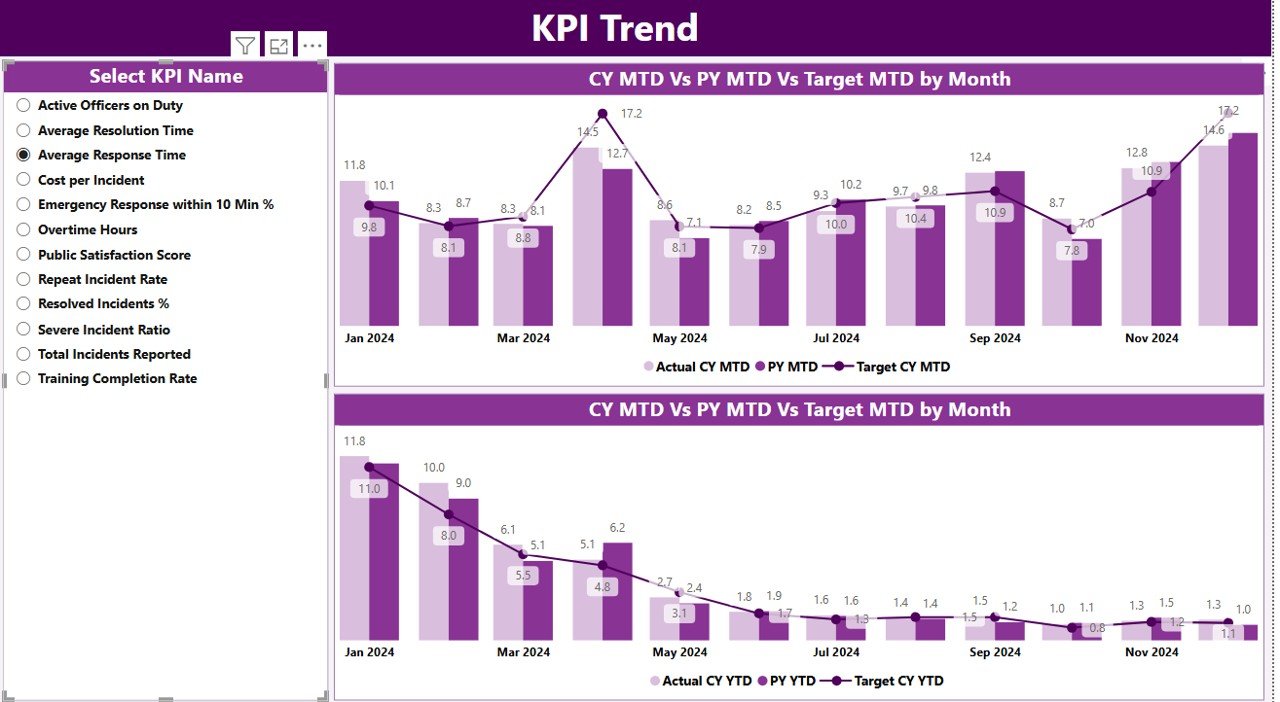
🔹 Trend Charts
Compare monthly vs yearly patterns using interactive charts for Actual, Target, and Previous Year values.
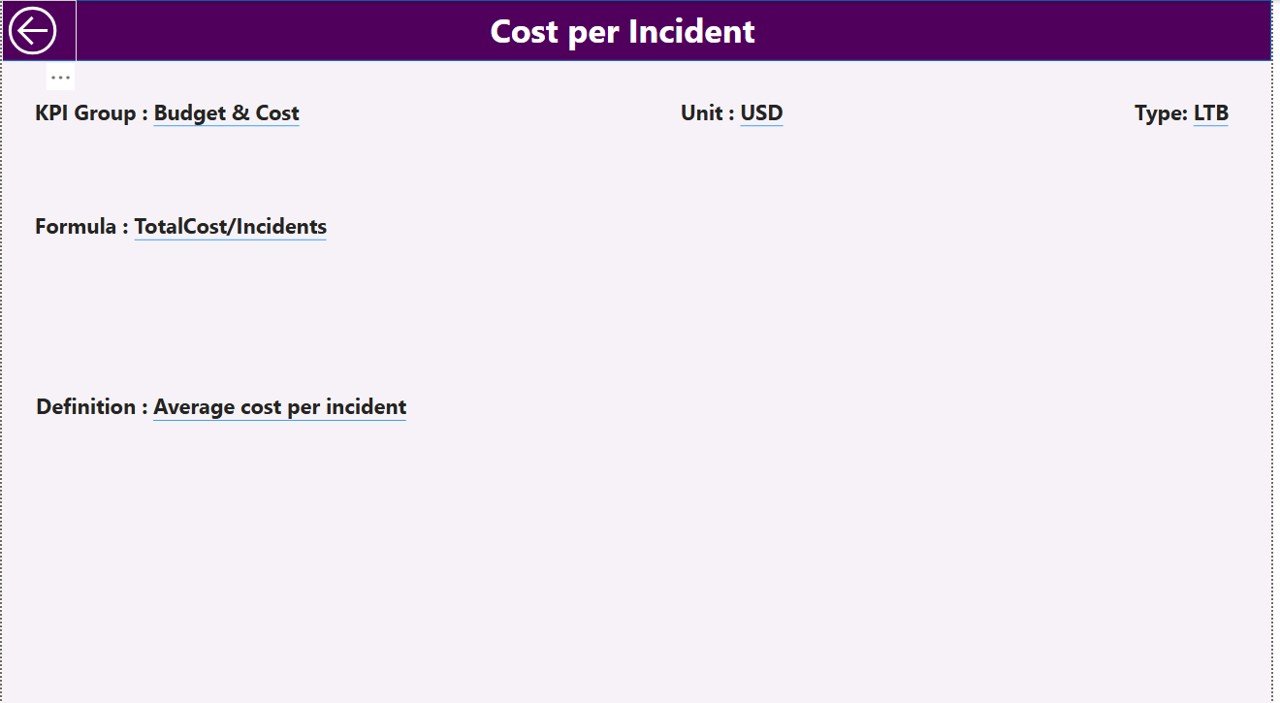
🔹 Drill-Through Page
Right-click any KPI to view its definition, formula, KPI type, unit, category, and more.
🔹 Excel-Based Data Source
All inputs—Actuals, Targets, and Definitions—come from a structured Excel file making updates super easy.
🔹 Fully Customizable
Add more KPIs, change formulas, or modify visuals without any limitations.
📦 What’s Inside the Public Safety KPI Dashboard
When you download this product, you will receive:
-
Power BI Dashboard File (.PBIX)
Ready-to-use, fully formatted, and professionally designed. -
Excel Input File (.XLSX)
Includes 3 structured sheets:
✔ Input_Actual
✔ Input_Target
✔ KPI_Definition -
KPI Definition Page
With KPI Group, Formula, KPI Type (UTB/LTB), and measurement units. -
Multiple Dashboard Pages
✔ Summary Page
✔ KPI Trend Page
✔ KPI Definition Page -
Drill-Through Feature
Learn how each KPI is calculated with one click.
Everything is organized, simplified, and designed for immediate use—saving hours of manual reporting work. 📝➡️📊
🛠️ How to Use the Public Safety KPI Dashboard
Using this dashboard is extremely simple:
🔸 Step 1: Update the Excel File
Enter your monthly Actual & Target numbers for each KPI.
🔸 Step 2: Refresh the Dashboard
Open the Power BI file and refresh. All visuals update instantly.
🔸 Step 3: Navigate Using Slicers
Choose the month, KPI group, or KPI name to view detailed insights.
🔸 Step 4: Compare Key Metrics
Analyze:
-
Actual vs Target
-
CY vs PY
-
MTD vs YTD
-
Trend charts
🔸 Step 5: Drill Through for Detailed Definitions
Right-click any KPI to view its formula and explanation.
Within minutes, your entire public safety performance becomes clear, visual, and actionable. 🚓📈
👥 Who Can Benefit from This Public Safety KPI Dashboard?
This dashboard is ideal for:
-
Police Departments – Track crime rate, arrests, response time
-
Emergency Response Teams – Monitor emergency call handling and readiness
-
Traffic Safety Units – Analyze road accident data and patrol performance
-
Disaster Management Teams – Track preparedness and response efficiency
-
Security Agencies – Evaluate incident reporting and compliance
-
Municipal Councils – Improve public satisfaction and safety initiatives
-
Public Safety Analysts – Standardize reporting across departments
Anyone responsible for maintaining community safety will benefit from this dashboard’s clarity, accuracy, and simplicity. 🛡️✨
### Click here to read the Detailed Blog Post
Watch the step-by-step video tutorial:


Reviews
There are no reviews yet.