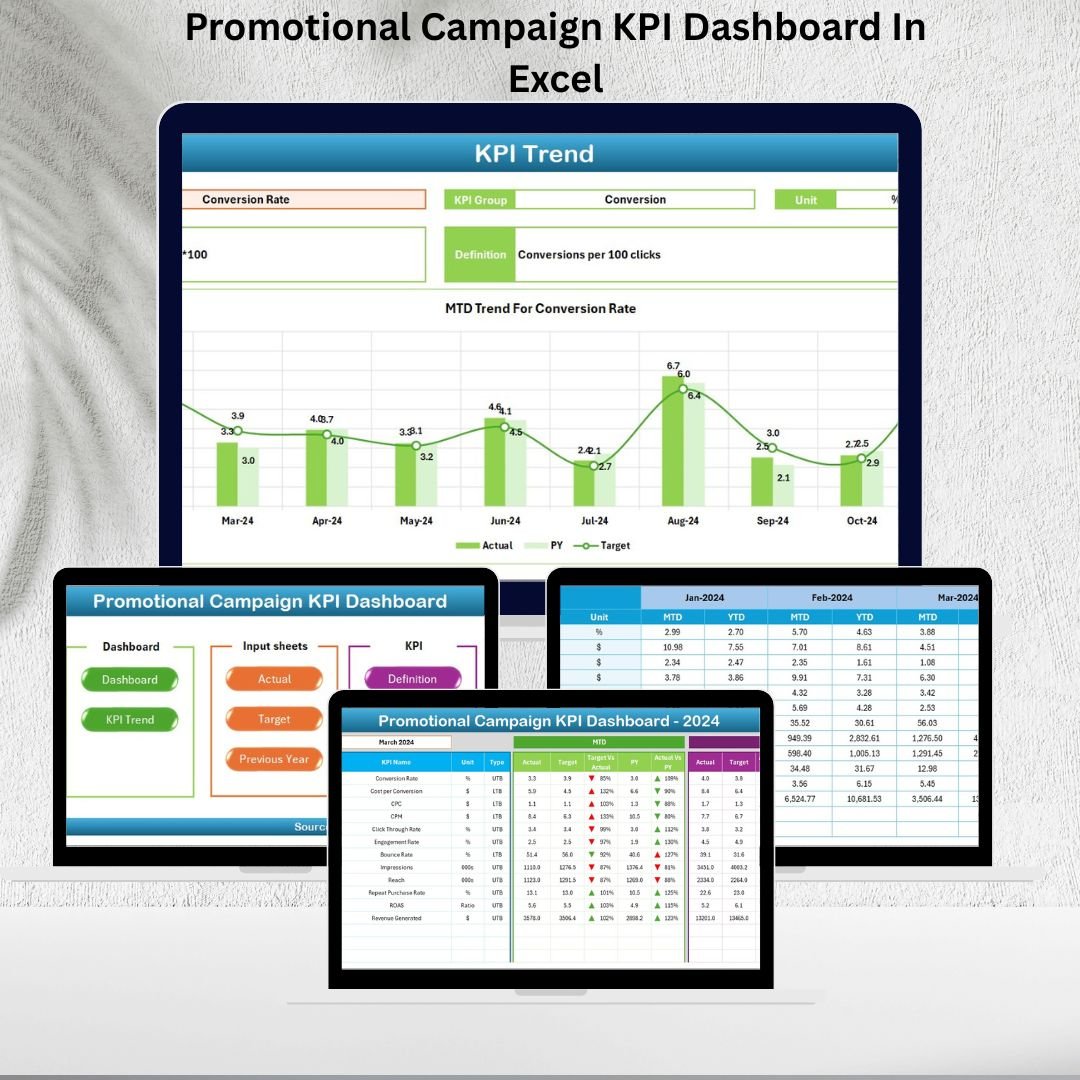
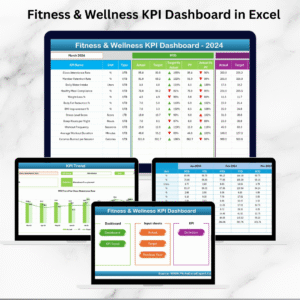
Promotional Campaign KPI Dashboard in Excel is your ultimate tool to monitor, analyze, and maximize the performance of every marketing initiative. Running successful promotional campaigns is not just about flashy ads or catchy slogans—it’s about tracking numbers, understanding patterns, and taking action at the right time. With this Excel-based dashboard, you get a single, powerful platform that converts raw campaign data into actionable insights .Promotional Campaign KPI Dashboard In Excel
This ready-to-use template is designed for marketers, business owners, and campaign managers who want to save time, reduce guesswork, and make smarter decisions. Whether you’re in retail, e-commerce, hospitality, or education, this dashboard ensures your campaigns remain transparent, measurable, and profitable.Promotional Campaign KPI Dashboard In Excel
✨ Key Features of Promotional Campaign KPI Dashboard in Excel
✅ All-in-One Reporting – Consolidates campaign performance into one easy-to-use file.
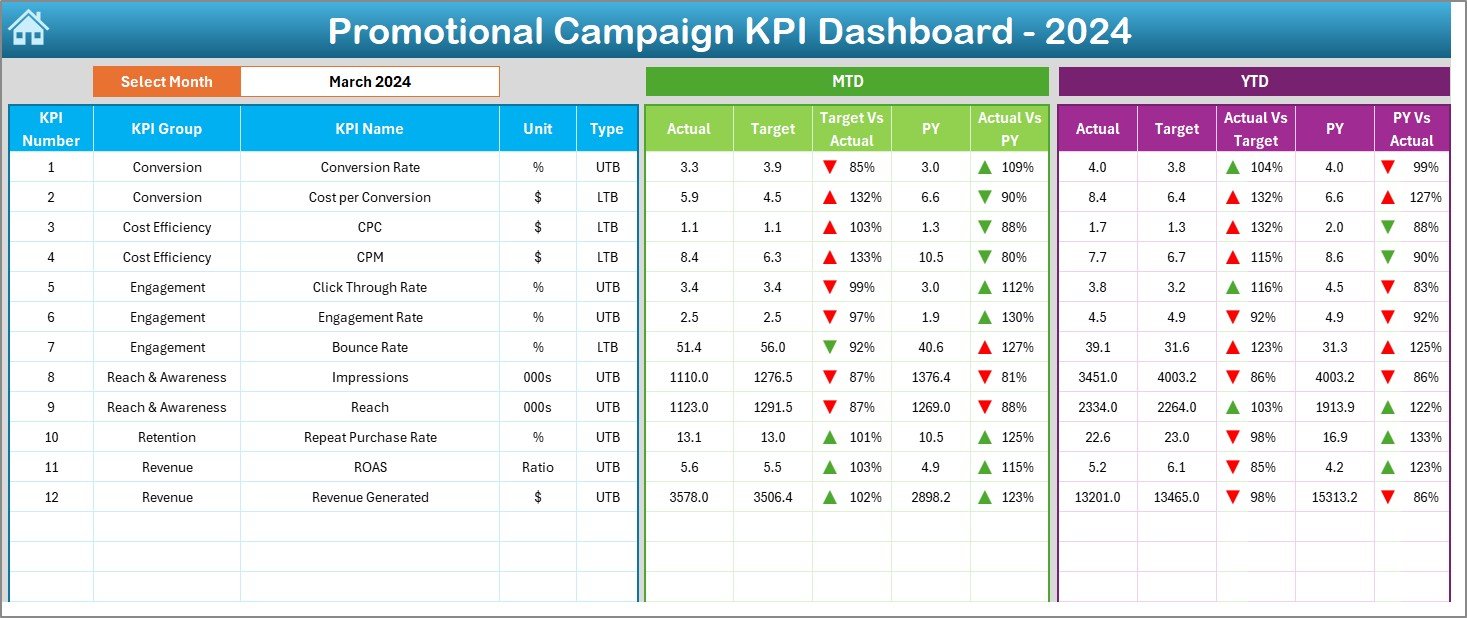
✅ MTD & YTD Comparison – Track month-to-date and year-to-date results against targets and last year.
✅ Interactive Drop-Downs – Switch between months or KPIs effortlessly.
✅ Smart Visuals – Conditional formatting with arrows highlights growth or gaps instantly.
✅ Customizable KPIs – Add or remove metrics as per business needs.
✅ Historical Tracking – Compare current results with previous campaigns.
✅ Cost-Effective Solution – No expensive software required, just Excel.
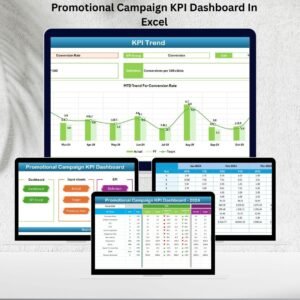
📂 What’s Inside the Promotional Campaign KPI Dashboard
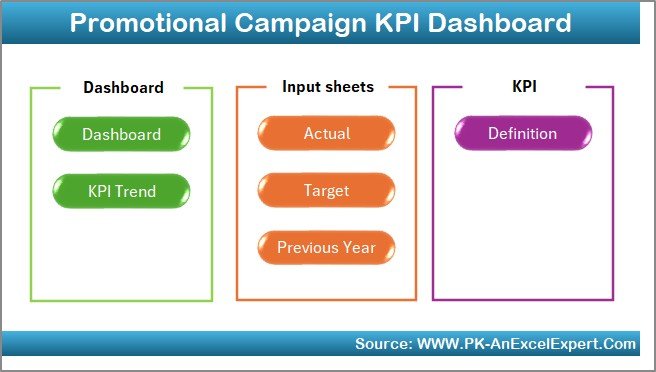
When you download this product, you get a well-structured Excel file with 7 interconnected sheets, each serving a unique purpose:Promotional Campaign KPI Dashboard In Excel
-
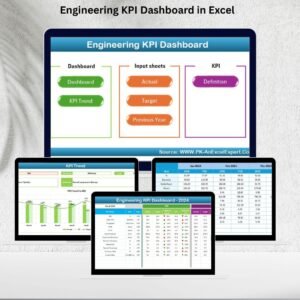
Home Sheet – Quick index page with navigation buttons.
-
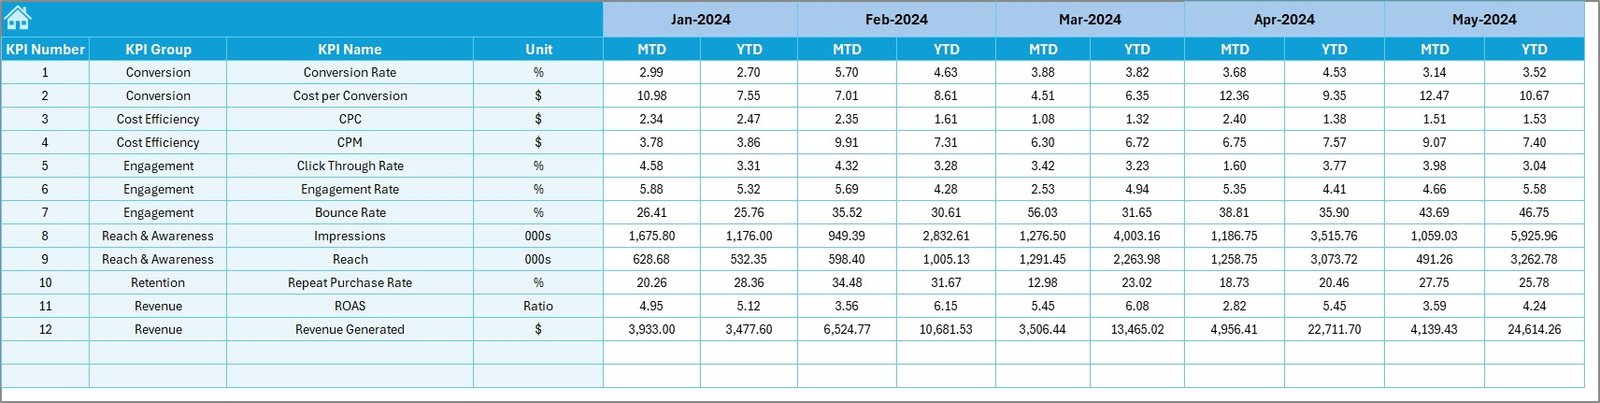
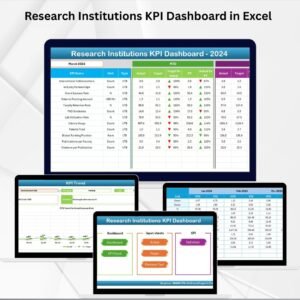
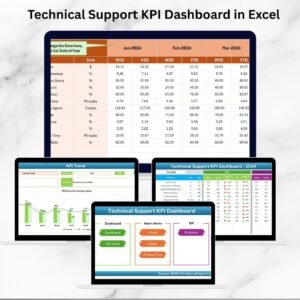
Dashboard Sheet – Main reporting hub with MTD & YTD Actuals, Targets, and Previous Year numbers.
-
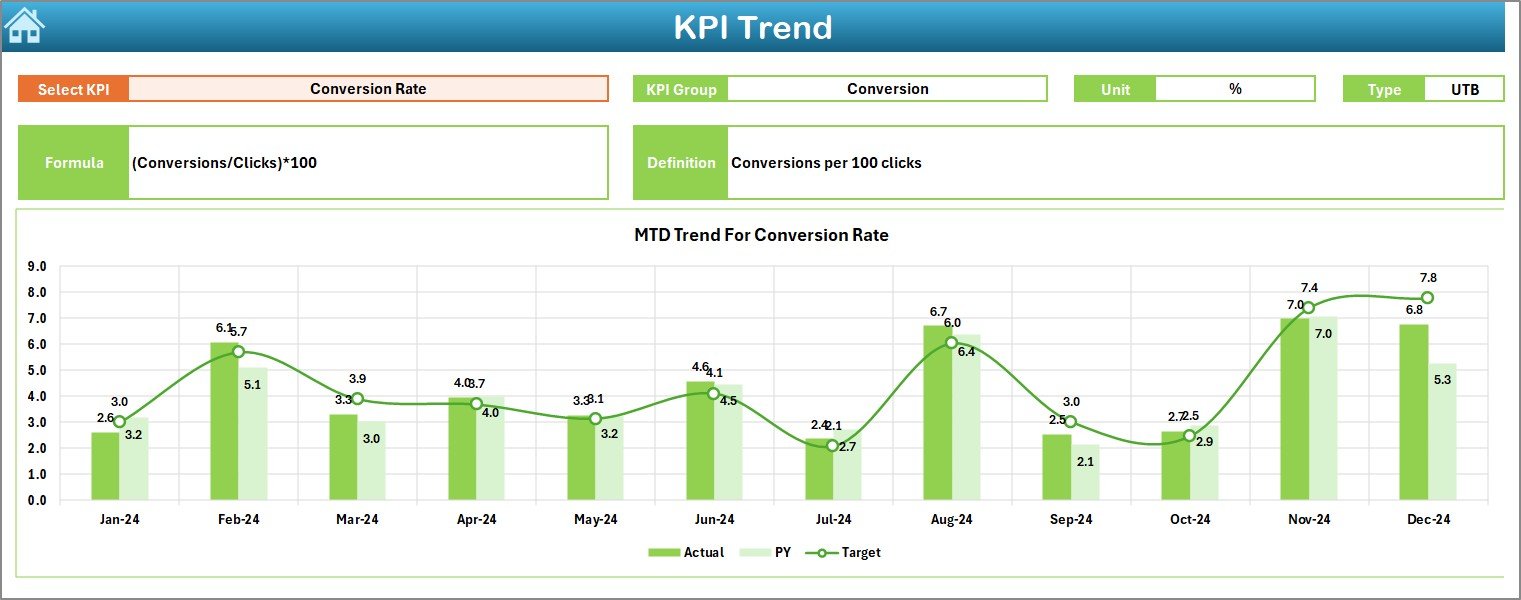
KPI Trend Sheet – Track KPI trends using charts and detailed breakdowns.
-
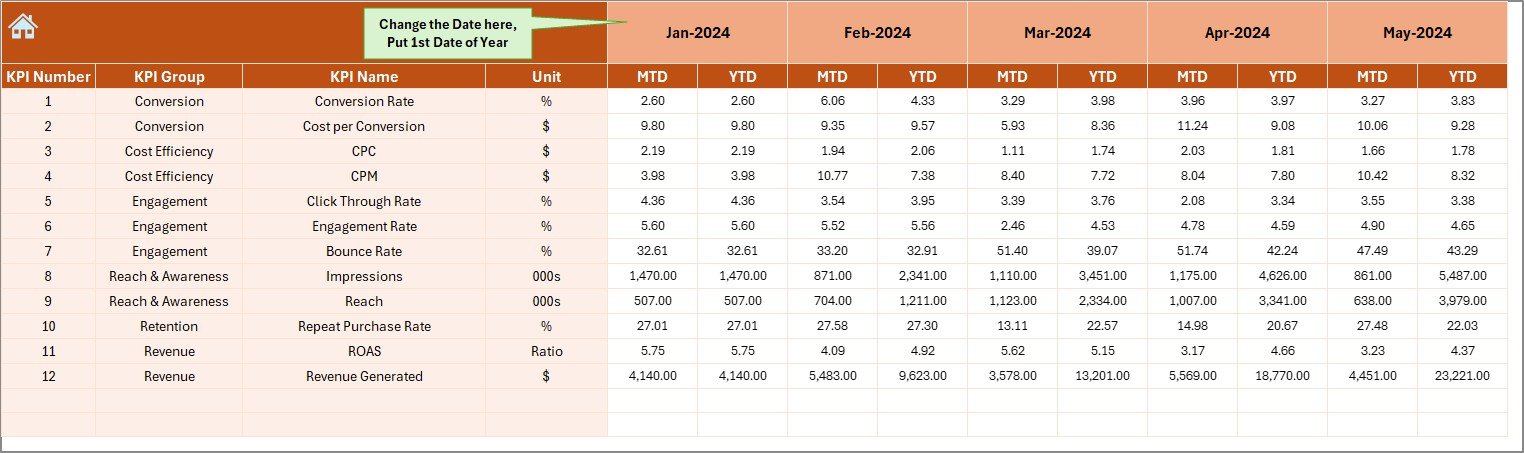
Actual Numbers Input Sheet – Enter campaign performance numbers monthly.
-
Target Sheet – Define MTD & YTD targets for each KPI.
-
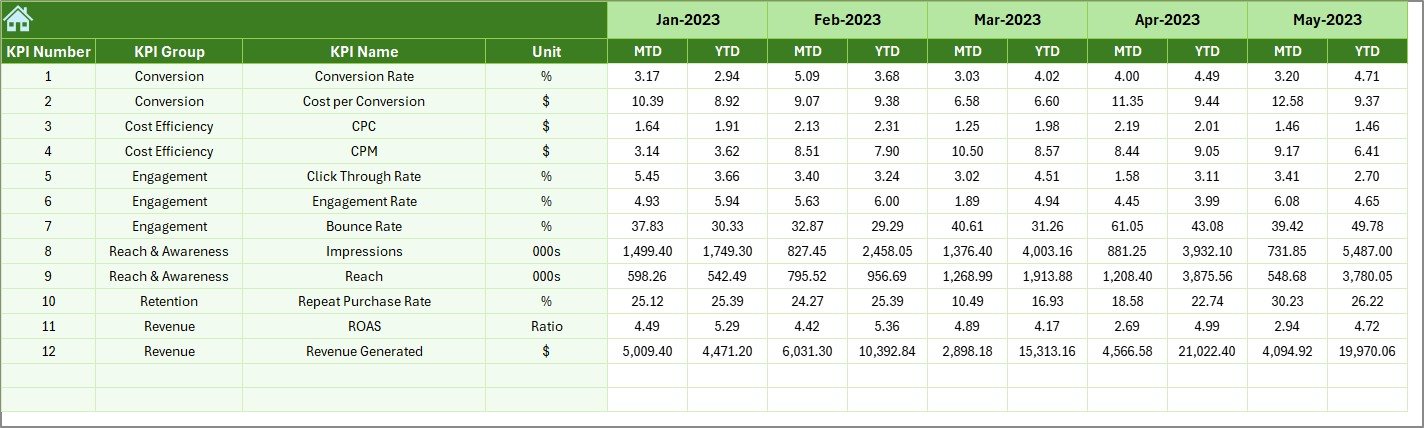
Previous Year Sheet – Store past campaign data for year-on-year comparison.
-
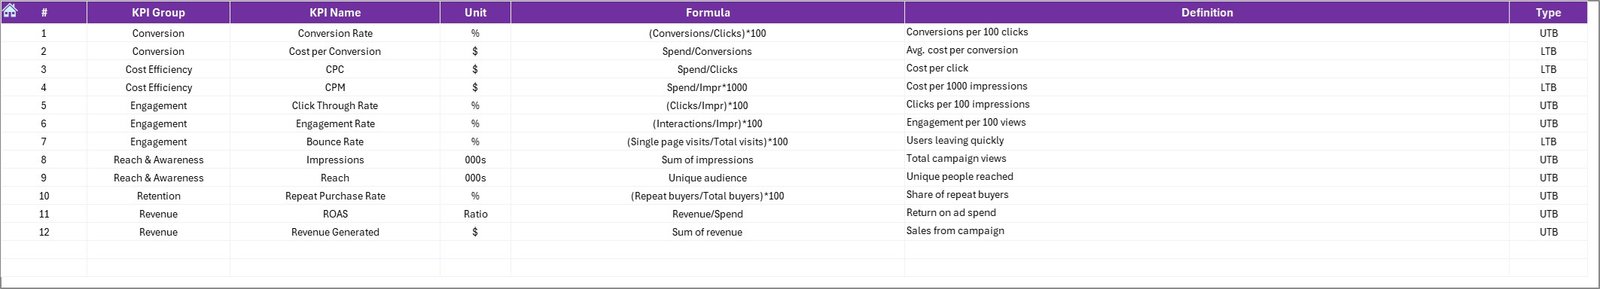
KPI Definition Sheet – Document formulas, definitions, and types for clarity.
This structured approach ensures you never lose track of what matters most—ROI, Conversion Rates, CPL, CAC, and more.
🛠 How to Use the Promotional Campaign KPI Dashboard
-
Start with KPI Definition Tab – Define all KPIs with formulas and units.
-
Set Campaign Targets – Enter monthly and yearly goals in the Target Sheet.
-
Input Actual Results – Update actual campaign data in the input sheet.
-
Review Historical Data – Add last year’s numbers for context.
-
Analyze Performance – Use the Dashboard sheet to compare targets vs actuals.
-
Monitor Trends – Check the KPI Trend sheet for deeper insights.
-
Adjust Quickly – Identify underperforming campaigns and make real-time corrections.
With this workflow, you can track ROI instantly, optimize ad spend, and present professional reports to management.
👥 Who Can Benefit from This Promotional Campaign KPI Dashboard
💼 Marketing Managers – Monitor multiple campaigns and optimize results.
🛒 Retail & E-commerce Businesses – Track seasonal sales, online ads, and lead conversions.
🏨 Hospitality Industry – Evaluate festive promotions and ROI of offers.
🎓 Education Sector – Measure admissions campaigns and student acquisition.
🏥 Healthcare Providers – Assess awareness campaigns and outreach effectiveness.
📈 Agencies & Freelancers – Provide clients with transparent, data-driven reporting.
If your business runs any kind of promotional activity, this dashboard ensures you stay ahead of the curve with clear, actionable insights.


Reviews
There are no reviews yet.