


Enhance your project management efficiency with our Project Management Office (PMO) KPI Dashboard in Power BI! 🚀 In today’s fast-paced business world, keeping track of project performance is essential for meeting deadlines, staying on budget, and achieving organizational goals. This ready-to-use dashboard is designed to give project managers, PMO teams, and executives complete control over project tracking and reporting.
With a PMO KPI Dashboard in Power BI, you get a dynamic, interactive tool that consolidates all your project KPIs into one centralized platform. No more scattered reports or manual tracking — just clean, actionable insights at your fingertips.
Key Features of PMO KPI Dashboard in Power BI 📊
-
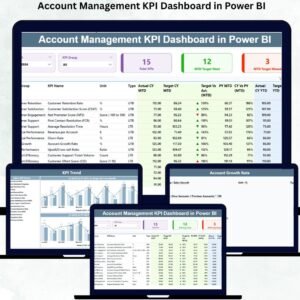
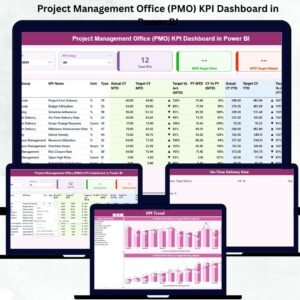
Interactive Summary Page: View total KPIs, targets met/missed, and compare current vs previous year performance at a glance.
-
KPI Trend Analysis: Identify trends, patterns, and performance gaps over time with combo charts and slicers.
-
KPI Definition Drill-Through: Access detailed KPI definitions, formulas, and types (LTB/UTB) directly from the dashboard.
-
Excel Integration: Seamlessly connect with Excel sheets for actuals, targets, and KPI definitions for dynamic updates.
-
Real-Time Insights: Get instant updates as soon as your Excel data changes, enabling proactive decision-making.
-
Customizable Reports: Tailor dashboards by project, team, or KPI group to match your organizational needs.
-
Visual Alerts: Red ▼ and green ▲ icons indicate KPIs off-target or meeting/exceeding targets.
-
Trend Comparisons: Easily compare current month/year results with previous periods for better benchmarking.

What’s Inside the PMO KPI Dashboard 🗂️
-
Summary Page: Overview of all KPIs with MTD/YTD actual vs target, performance indicators, and previous year comparisons.
-
KPI Trend Page: Visualize KPI progress over time, analyze seasonal trends, and identify potential risks.
-
KPI Definition Page: Detailed KPI descriptions, formulas, and type classification for clarity and standardization.
-
Excel Data Structure: Three sheets — Input_Actual, Input_Target, and KPI Definition — for seamless integration.
How to Use the PMO KPI Dashboard ⚙️
-
Prepare Your Data: Enter your actual and target KPI values in the Excel sheets provided.
-
Load into Power BI: Connect your Excel data source to the dashboard.
-
Explore KPIs: Use slicers to filter by month, KPI group, or project team.
-
Analyze Trends: Review combo charts to track KPI performance over time.
-
Drill Down: Access KPI definitions for formulas and calculation details.
-
Make Decisions: Identify bottlenecks, allocate resources efficiently, and act on real-time insights.
Who Can Benefit from This PMO KPI Dashboard 👥
-
Project Managers: Track project progress, resource utilization, and timelines effortlessly.
-
PMO Teams: Standardize KPI reporting across multiple projects and departments.
-
Executives & Stakeholders: Get a quick, visual overview of organizational project health.
-
Data Analysts: Easily analyze trends, generate reports, and monitor performance gaps.
-
Organizations of All Sizes: Centralized, real-time insights help optimize project performance.
With this PMO KPI Dashboard in Power BI, you can track progress, identify risks, benchmark performance, optimize resources, and improve accountability like never before. Enhance your PMO efficiency, ensure projects align with business goals, and make smarter, data-driven decisions! 🌟


Reviews
There are no reviews yet.