Successful project management depends on clarity, accountability, and performance tracking. Without a structured system, managers often spend endless hours juggling reports, chasing updates, and trying to identify where things went wrong. That’s why we built the Project Management KPI Scorecard in Excel — a smart, interactive, and cost-effective solution for measuring project health.
This ready-to-use template consolidates your most important KPIs into a single, easy-to-understand scorecard. Whether you want to track Month-to-Date (MTD), Year-to-Date (YTD), or compare actual performance against targets, this scorecard ensures that you always have the right insights at the right time.
No more manual errors, no more scattered updates—just one clean, centralized view of your project performance.
✨ Key Features of the Project Management KPI Scorecard in Excel
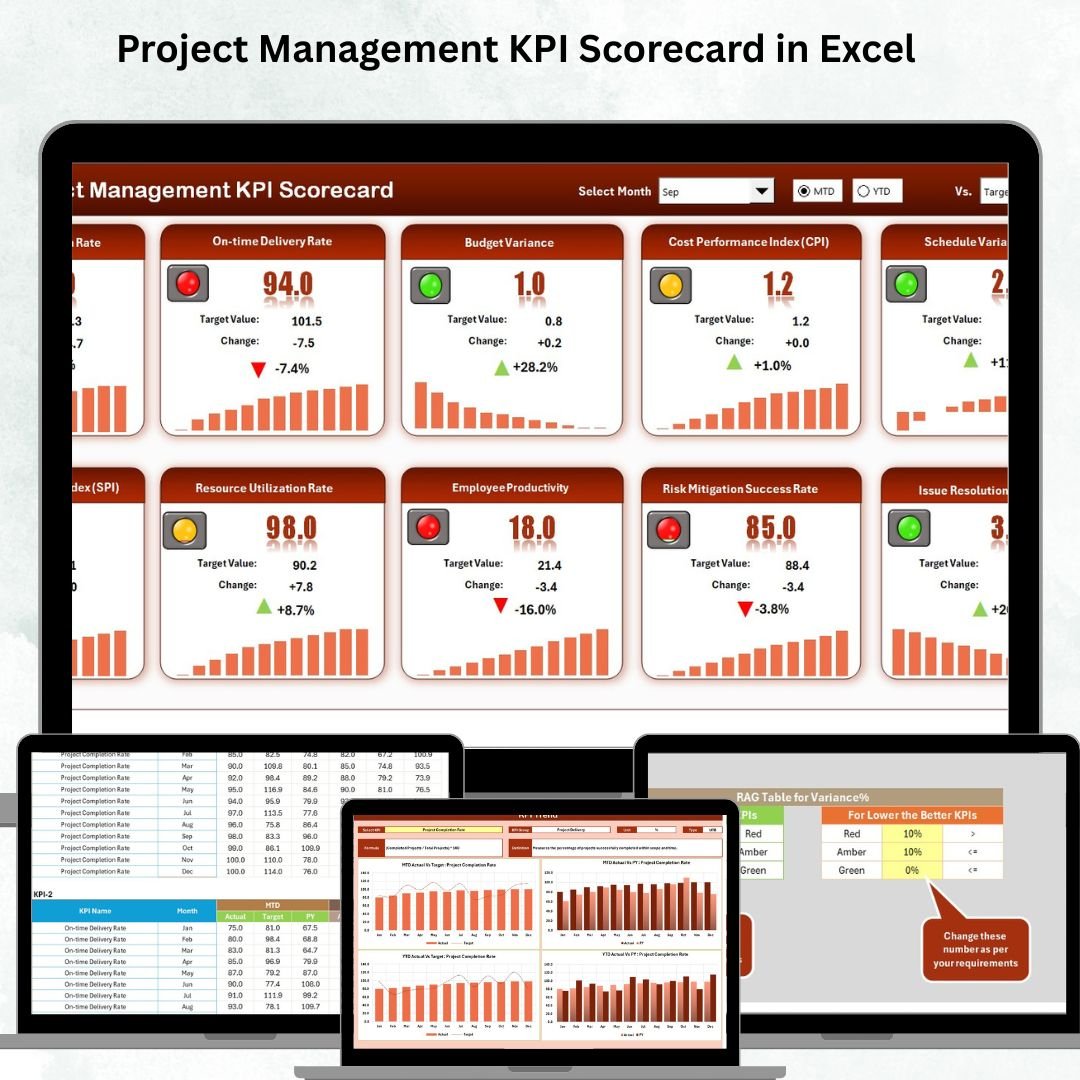
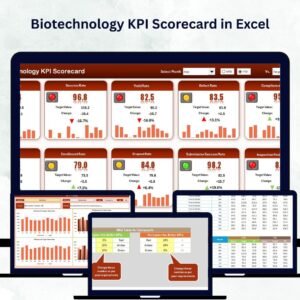
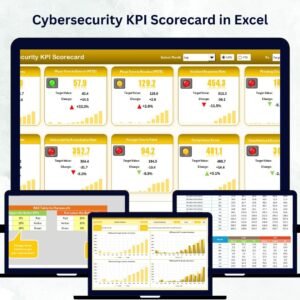
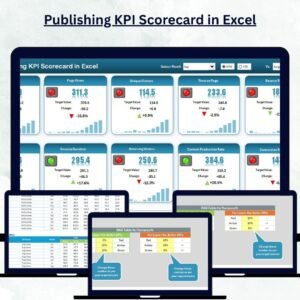
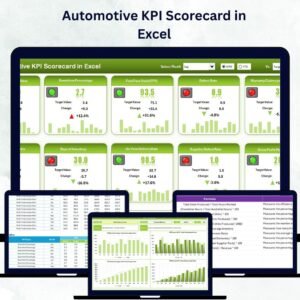
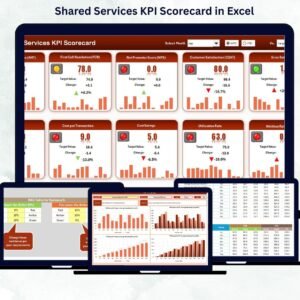
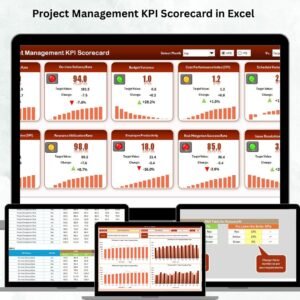
✅ Scorecard Sheet – The heart of the tool:
-
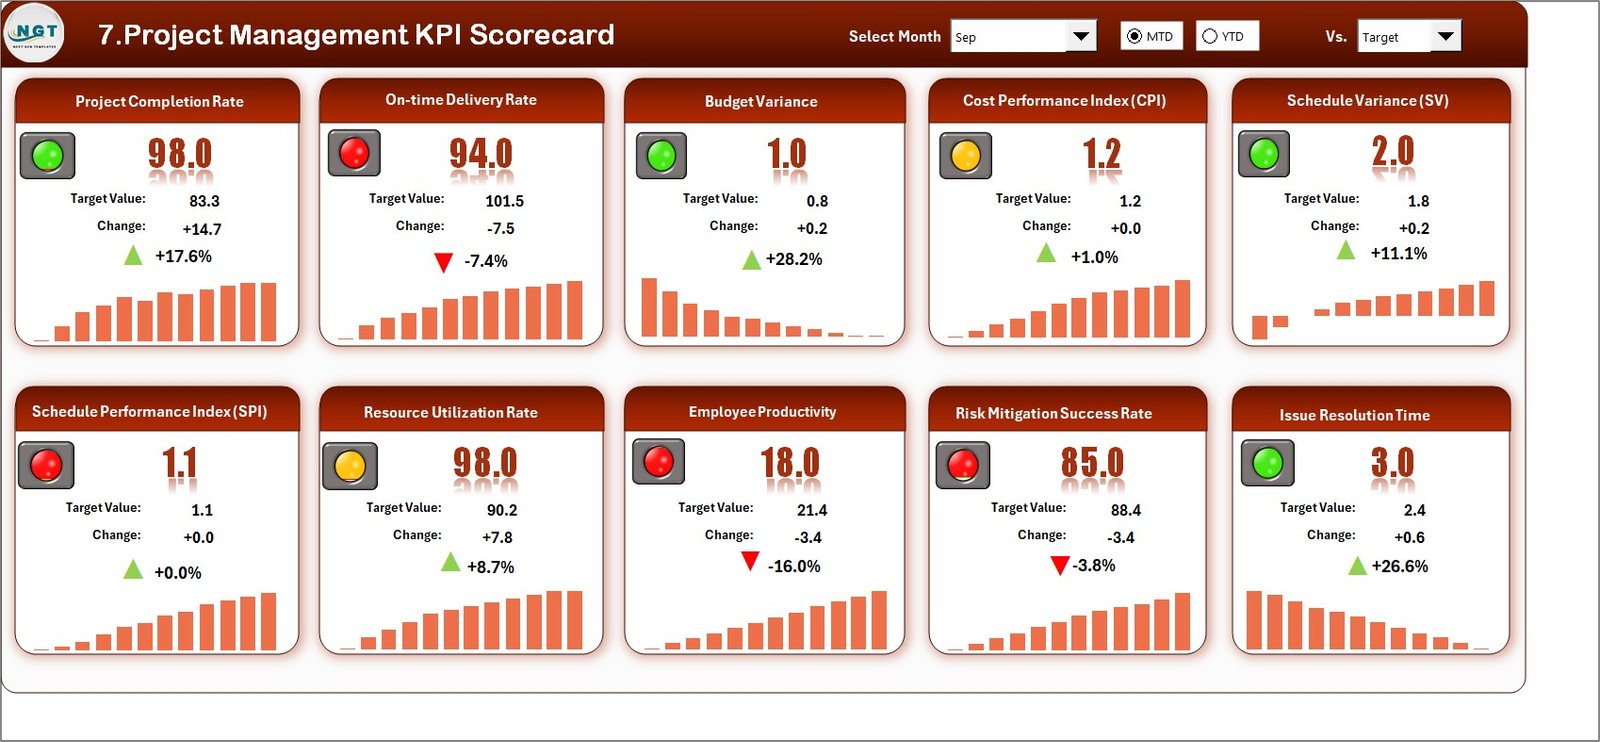
Dropdown menus to switch between MTD, YTD, and specific months.
-
Compare Actual vs Target performance instantly.
-
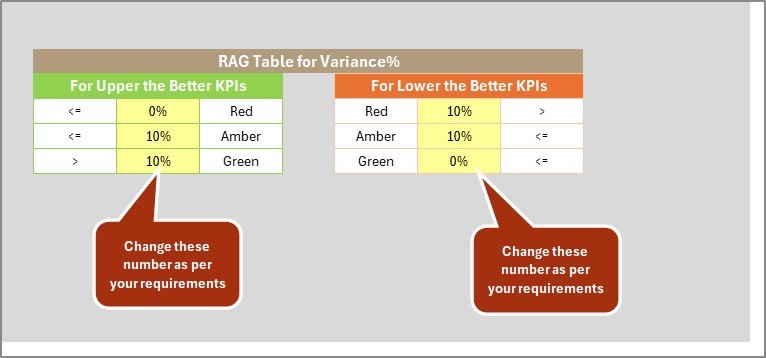
Visual indicators (✔, ✘, arrows, and colors) for quick status checks.
-
All KPIs consolidated in one clean view.
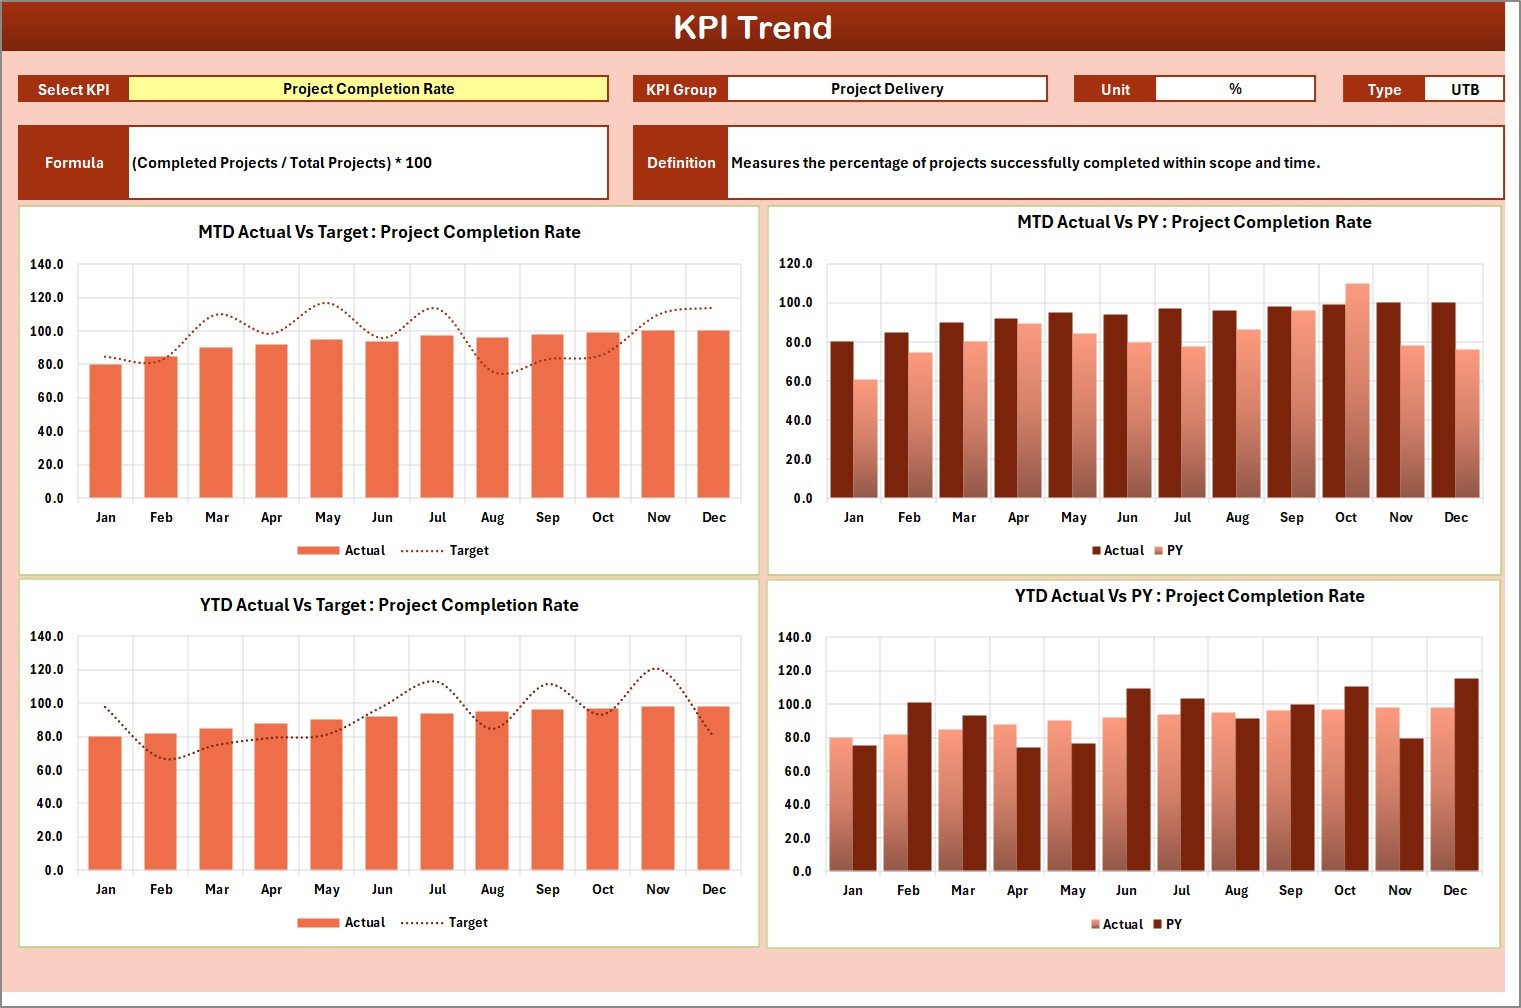
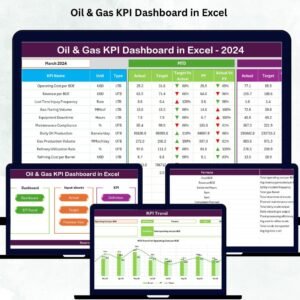
✅ KPI Trend Sheet – Spot performance patterns with:
-
Dropdown selection for any KPI.
-
Details like KPI Group, Unit, Formula, and Type (UTB/LTB).
-
Trend charts showing Actual vs Target, Previous Year, and variance.
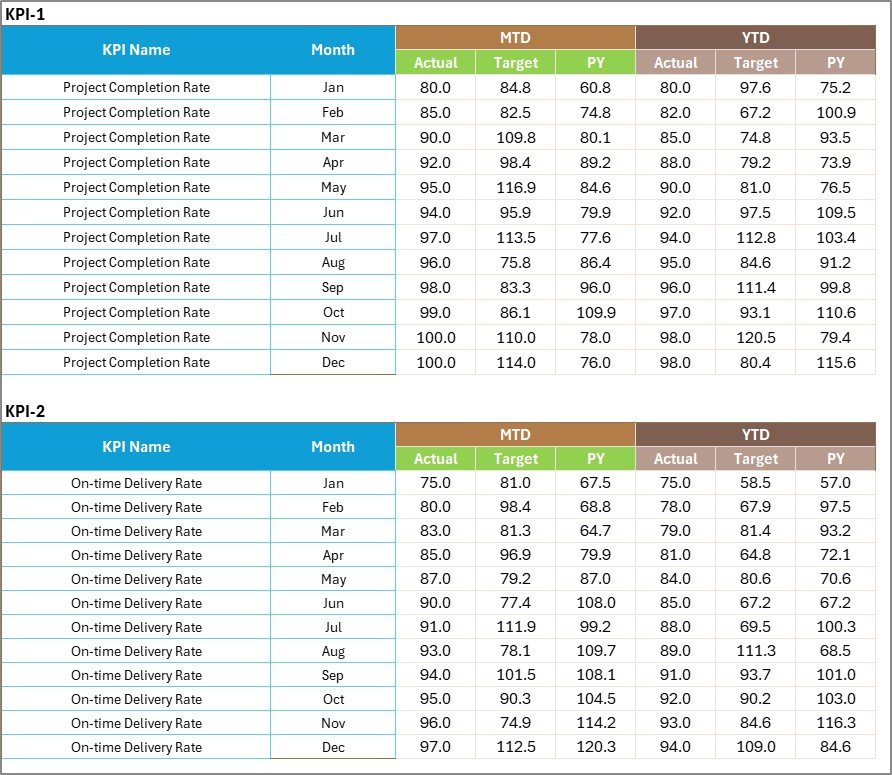
✅ Input Data Sheet – The backbone of accuracy:
-
Easy-to-update data entry for actuals and targets.
-
Centralized input to keep numbers consistent across all sheets.
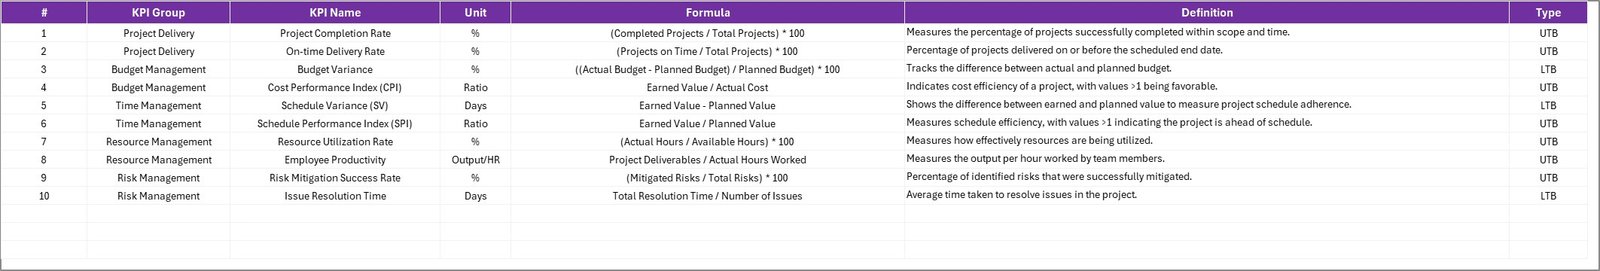
✅ KPI Definition Sheet – Ensures clarity:
-
Standardized KPI names, formulas, and definitions.
-
Eliminates confusion among teams and stakeholders.
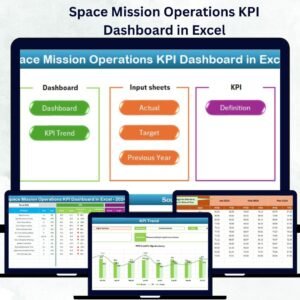
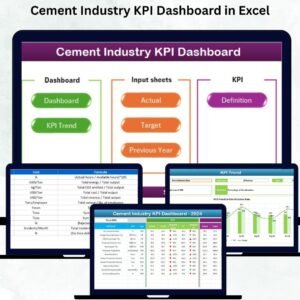
📂 What’s Inside the Project Management KPI Scorecard in Excel
When you download the template, you’ll receive:
-
Scorecard Sheet – Your main project health view.
-
KPI Trend Sheet – Analyze how KPIs evolve over time.
-
Input Data Sheet – Simplify data entry and updates.
-
KPI Definition Sheet – Keep KPIs standardized and transparent.
This four-tab structure provides the perfect balance between simplicity and depth.
⚡ How to Use the Project Management KPI Scorecard
1️⃣ Enter KPI data in the Input Data Sheet.
2️⃣ Open the Scorecard Sheet to instantly see Actual vs Target results.
3️⃣ Use dropdowns to filter by MTD, YTD, or month.
4️⃣ Check trends in the KPI Trend Sheet to spot long-term patterns.
5️⃣ Refer to definitions to ensure consistent KPI understanding.
6️⃣ Share results with teams and stakeholders for better alignment.
🎯 Who Can Benefit from the Project Management KPI Scorecard?
-
👨💼 Project Managers – Track schedules, costs, and deliverables.
-
🏢 PMOs – Standardize performance measurement across multiple projects.
-
📊 Business Analysts – Monitor KPIs and identify improvement areas.
-
💼 Small Businesses – Affordable way to manage project performance.
-
📈 Leadership Teams – Gain clarity on whether projects support business goals.
✅ Why Choose This Scorecard?
-
📊 Centralized dashboard – All KPIs in one place.
-
⏳ Time-saving – No need to build complex reports.
-
🛠 Customizable – Add, edit, or adjust KPIs and formulas.
-
🔄 Interactive – Dropdowns and charts for dynamic analysis.
-
💰 Cost-effective – Works in Excel, no extra software required.
-
✔ Accurate & reliable – Standardized formulas reduce errors.
-
📢 Improved communication – Easy-to-share visuals for stakeholders.
📖 Click here to read the Detailed blog post
📺
Visit our YouTube channel to learn step-by-step video tutorials


Reviews
There are no reviews yet.