


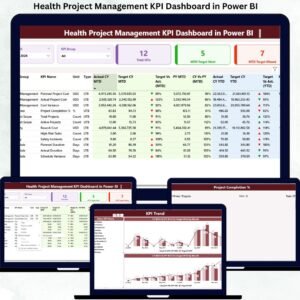
The Project Management KPI Dashboard in Power BI is a powerful and interactive tool designed for project managers, team leaders, and business owners who want to track, analyze, and optimize their project performance. This customizable dashboard allows you to monitor key performance indicators (KPIs) such as project progress, cost management, resource utilization, risk management, and overall project health, enabling you to make data-driven decisions and keep your projects on track.
With real-time data integration, the Project Management KPI Dashboard in Power BI provides a comprehensive view of project performance across multiple parameters. Whether you’re managing a single project or overseeing a portfolio of projects, this tool helps you gain insights into project milestones, budgets, deadlines, and team performance, ensuring successful project delivery and efficient resource management.
Key Features of the Project Management KPI Dashboard in Power BI
📊 Comprehensive Project Tracking
Track a wide range of KPIs related to project performance, including completion percentage, budget adherence, resource allocation, and task progress. Get a complete view of project health and status.
⚡ Real-Time Data Monitoring
Monitor project performance in real time, from planning through execution. Track project timelines, milestones, cost overruns, and resource bottlenecks as they occur, ensuring timely adjustments.
📈 Budget & Cost Management
Analyze project budget, actual costs, and variance to ensure that your projects stay within budget. Visualize cost overruns and reallocate resources accordingly to optimize project spending.
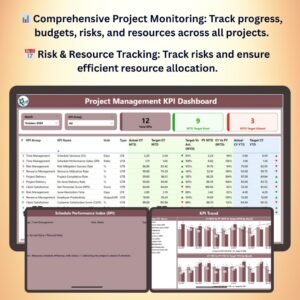
📅 Risk Management & Resource Allocation
Track project risks and mitigation strategies to minimize potential disruptions. Monitor resource allocation to ensure efficient use of time, manpower, and materials throughout the project lifecycle.
🖥️ Interactive & User-Friendly Interface
The Power BI dashboard is easy to navigate, offering interactive charts, filters, and slicers to explore project data, identify issues, and drill down into detailed performance insights.
Why You’ll Love the Project Management KPI Dashboard in Power BI

✅ Track Multiple Projects Simultaneously
Monitor and manage the performance of multiple projects with a single dashboard. Keep track of project progress, costs, and timelines across your entire project portfolio.
✅ Ensure Projects Stay On Time & On Budget
Monitor project timelines, budgets, and cost overruns in real-time, ensuring that your projects stay on track and within budget without compromising quality.
✅ Optimize Resource Utilization
Track resource allocation and team performance to ensure that resources are being utilized efficiently across all projects, reducing downtime and maximizing productivity.
✅ Improve Risk Management
Track project risks and mitigation strategies in real-time to address potential issues before they escalate, ensuring smooth project delivery.
✅ Make Data-Driven Decisions
Leverage real-time insights to make informed decisions about resource allocation, project adjustments, and cost management to ensure successful project outcomes.
What’s Inside the Project Management KPI Dashboard Template?
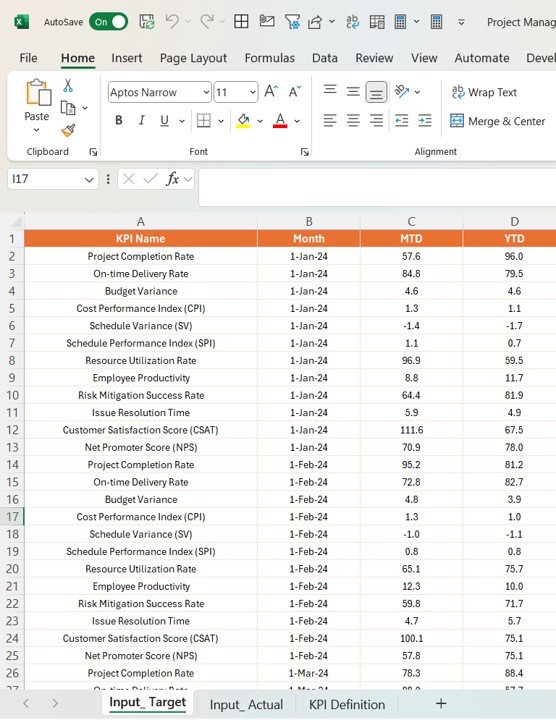
- Project Progress & Milestone Tracking: Monitor project completion percentage, milestones, and deadlines to ensure projects stay on track.
- Budget & Cost Management: Visualize project budgets, actual costs, and cost variances to optimize spending.
- Resource Allocation Monitoring: Track resource utilization to ensure projects are adequately staffed and resourced.
- Risk Management Tracking: Monitor potential risks, mitigation strategies, and issues that may affect project delivery.
- Interactive Reporting: Use dynamic charts, filters, and slicers to dive deeper into project data and identify trends, bottlenecks, and opportunities for improvement.
After downloading and unzipping this file, ensure that macros are enabled before use. Refer to our below tutorial link for step-by-step instructions on enabling macros in Excel.
How to Use the Project Management KPI Dashboard in Power BI
1️⃣ Download the Template: Get instant access to your Project Management KPI Dashboard in Power BI.
2️⃣ Input Project Data: Enter data related to project timelines, budgets, resources, and risks.
3️⃣ Track & Monitor KPIs: Use the dashboard to monitor project performance, budget adherence, and resource usage.
4️⃣ Analyze & Optimize: Use insights from the dashboard to adjust resources, address risks, and keep projects on time and within budget.
Who Can Benefit from the Project Management KPI Dashboard in Power BI?
🔹 Project Managers & Team Leaders
🔹 Business Owners & Entrepreneurs
🔹 Resource Managers & Scheduling Coordinators
🔹 Operations & Strategy Teams
🔹 Data Analysts & Business Intelligence Professionals
🔹 Anyone Involved in Project Planning & Execution
Track, analyze, and optimize your projects with the Project Management KPI Dashboard in Power BI. Monitor key performance metrics, manage resources efficiently, and ensure that your projects are completed on time and within budget.
Click here to read the Detailed blog post
Visit our YouTube channel to learn step-by-step video tutorials
Youtube.com/@PKAnExcelExpert


Reviews
There are no reviews yet.