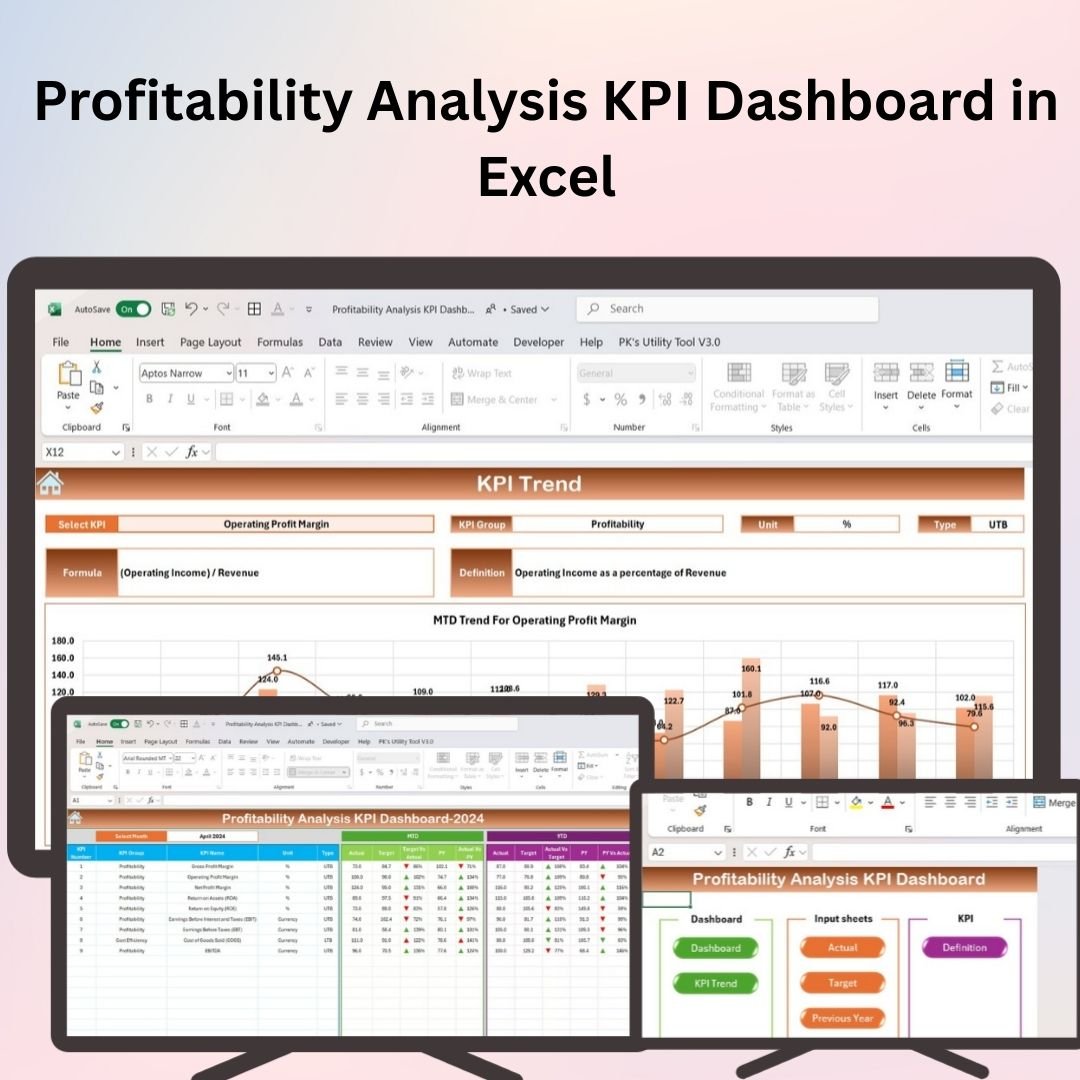


The Profitability Analysis KPI Dashboard in Excel is an essential tool for businesses, finance teams, and analysts looking to track and measure profitability. This powerful dashboard allows you to monitor key performance indicators (KPIs) related to revenue, expenses, and overall profitability, helping you make informed financial decisions.
With customizable fields, automatic calculations, and interactive charts, this Excel dashboard provides a clear, visual representation of your company’s financial health. Whether you’re managing a small business or a large enterprise, this tool helps you stay on top of your profitability and ensures you’re meeting your financial goals.
Key Features of the Profitability Analysis KPI Dashboard in Excel
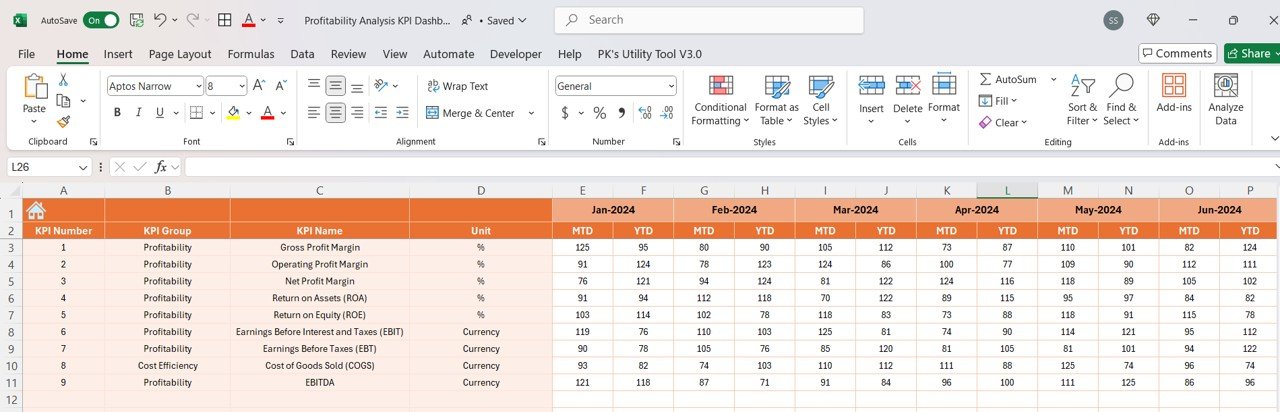
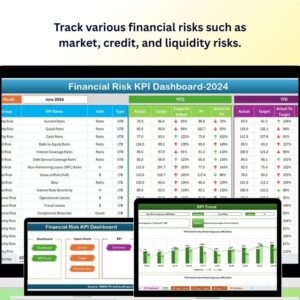
📊 Profitability Metrics Tracking: Monitor key profitability indicators such as gross profit margin, net profit margin, return on investment (ROI), and more.
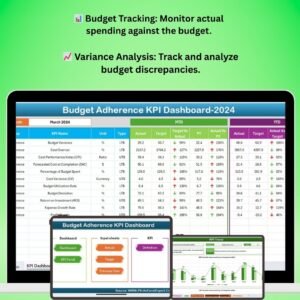
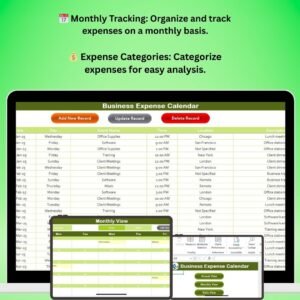
⚙️ Expense Management: Track operational expenses and analyze their impact on profitability.
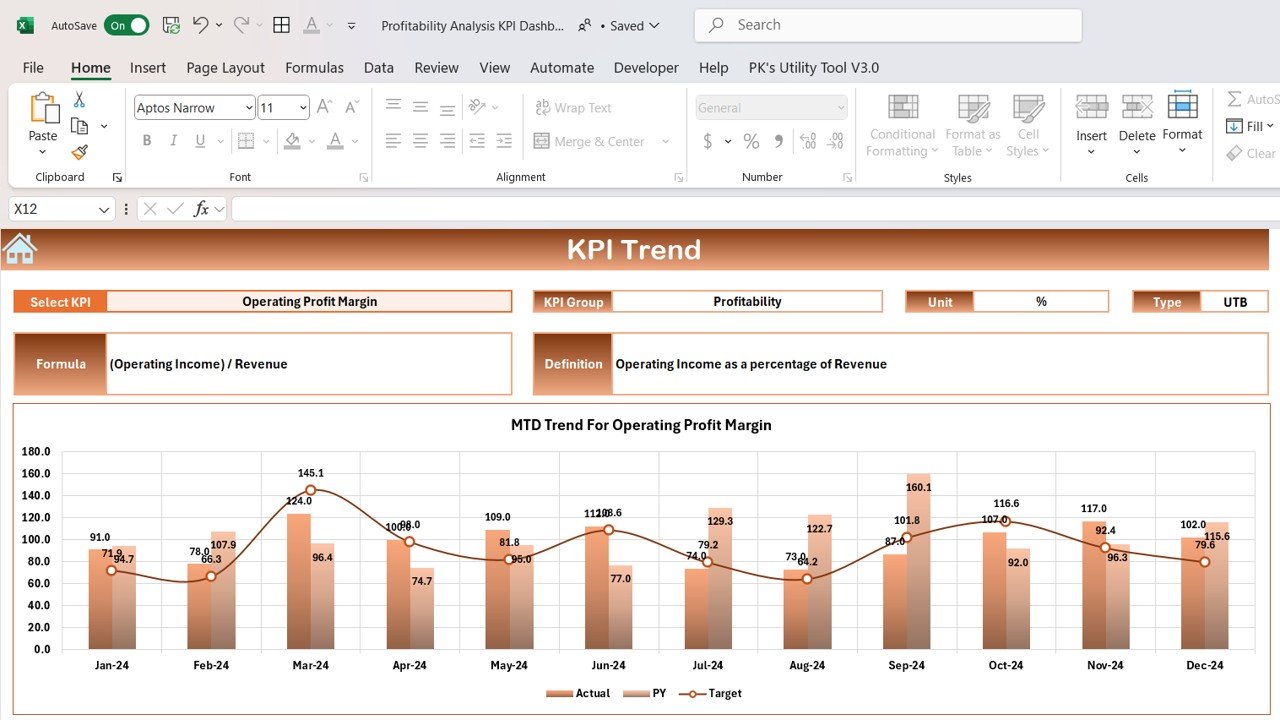
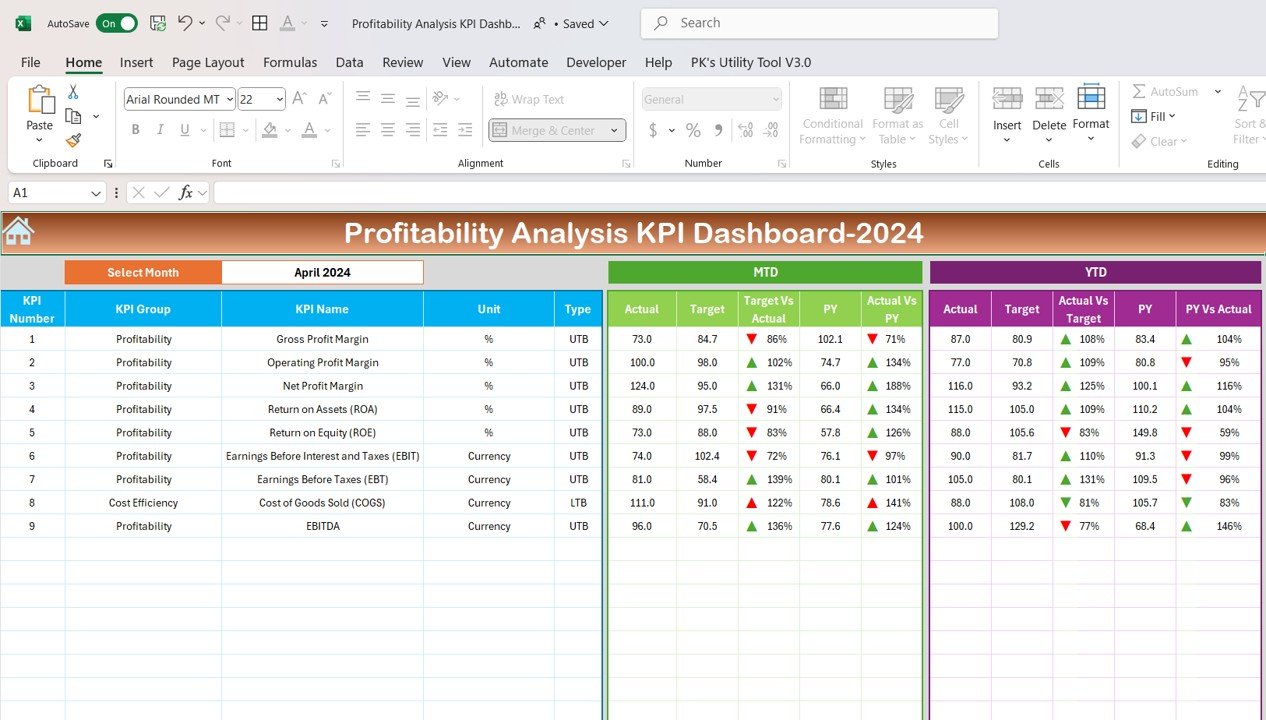
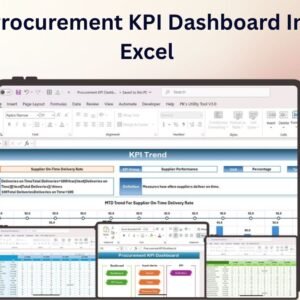
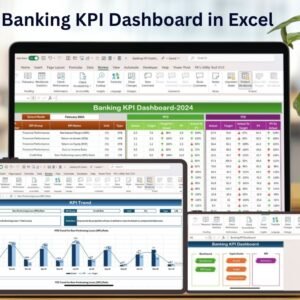
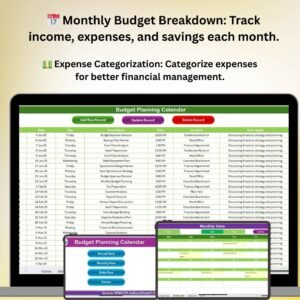
📈 Visual Dashboards: Use interactive charts and graphs to visualize financial data and trends.
💼 Customizable KPIs: Modify the dashboard to track your specific business KPIs, such as product profitability, department performance, and revenue growth.
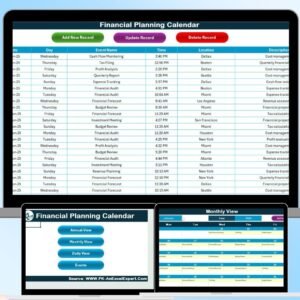
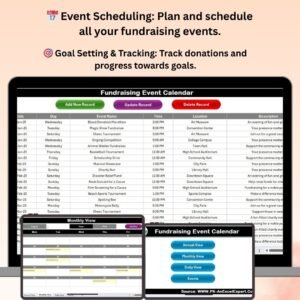
📅 Period Comparison: Compare profitability over different periods (monthly, quarterly, yearly) to identify trends and improve forecasting.
🔄 Real-Time Updates: Enter data and receive immediate updates in the dashboard for real-time analysis.
Why You’ll Love the Profitability Analysis KPI Dashboard in Excel
✅ Comprehensive Profitability Tracking: Monitor all critical profitability metrics in one place to ensure business success.
✅ Data-Driven Insights: Use visualized data to make informed financial decisions that improve profitability.
✅ Customizable: Tailor the dashboard to fit your specific financial analysis needs, whether for tracking revenue, expenses, or ROI.
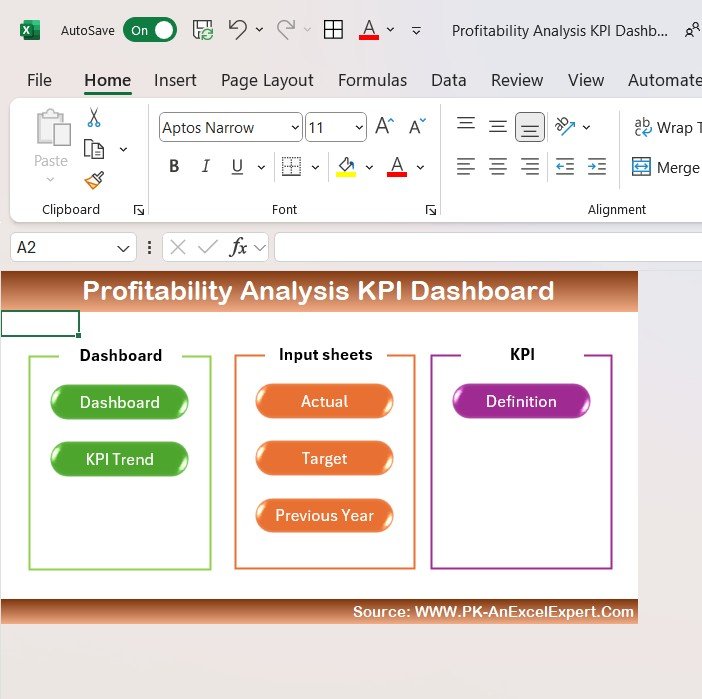
✅ Easy-to-Use Interface: Simple navigation with clear, visual indicators to track financial performance effortlessly.
✅ Periodic Comparison: Compare profitability across different time periods for better forecasting and trend analysis.
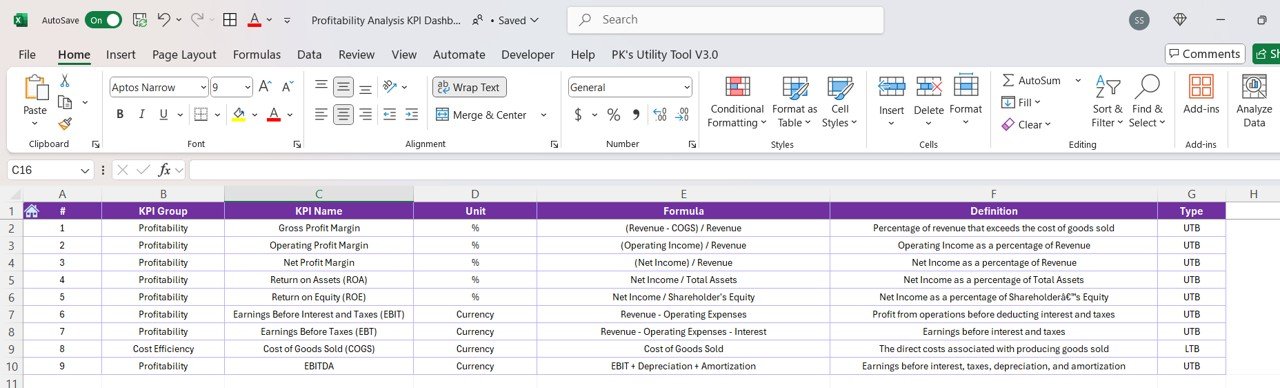
What’s Inside the Profitability Analysis KPI Dashboard in Excel?
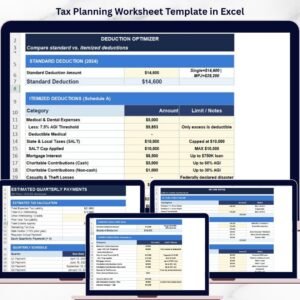
📊 Profitability Metrics Tracker: Track essential profitability KPIs, such as gross and net profit margins.
⚙️ Expense Tracker: Monitor operational expenses and assess their impact on profits.
📈 Interactive Dashboard: Visual charts and graphs that provide insights into your financial performance.
💼 Custom KPIs: Track and modify KPIs that are specific to your business goals and profitability targets.
📅 Period Comparison: View comparisons of profitability across various time periods to spot trends and improve forecasting.
How to Use the Profitability Analysis KPI Dashboard in Excel
1️⃣ Download the Template – Access the pre-configured profitability analysis KPI dashboard.
2️⃣ Input Financial Data: Enter your revenue, expense, and profitability data into the designated fields.
3️⃣ Track KPIs: Use the dashboard to track key financial performance indicators such as profit margin, ROI, and revenue growth.
4️⃣ Visualize Trends: Analyze data using built-in charts to understand profitability trends and identify opportunities for improvement.
5️⃣ Update Periodically: Keep the dashboard up to date by entering new data for real-time analysis and forecasting.
Who Can Benefit from the Profitability Analysis KPI Dashboard in Excel?
🔹 Finance Teams
🔹 Business Owners
🔹 Financial Analysts
🔹 Entrepreneurs
🔹 Project Managers
🔹 Accountants
🔹 Marketing Teams
Improve your financial tracking and decision-making with the Profitability Analysis KPI Dashboard in Excel. Monitor key profitability metrics, track expenses, and visualize trends to optimize your business’s financial health.
Click here to read the detailed blog post
Visit our YouTube channel to learn step-by-step video tutorials


Reviews
There are no reviews yet.