Managing procurement efficiently is one of the most important responsibilities of any business. Whether you are a finance manager, procurement officer, or business owner, having visibility into your purchasing activities can make the difference between controlled costs and wasted resources. That’s why we’ve created the Procurement Analysis Report in Excel – a ready-to-use, professional-grade tool that centralizes your procurement data, visualizes performance, and helps you make informed, data-driven decisions.
This report eliminates the challenges of scattered records, manual reporting, and lack of insights. By using this Excel template, you gain a structured and interactive system to track suppliers, analyze purchase trends, and ensure full financial transparency.
✨ Key Features of the Procurement Analysis Report in Excel
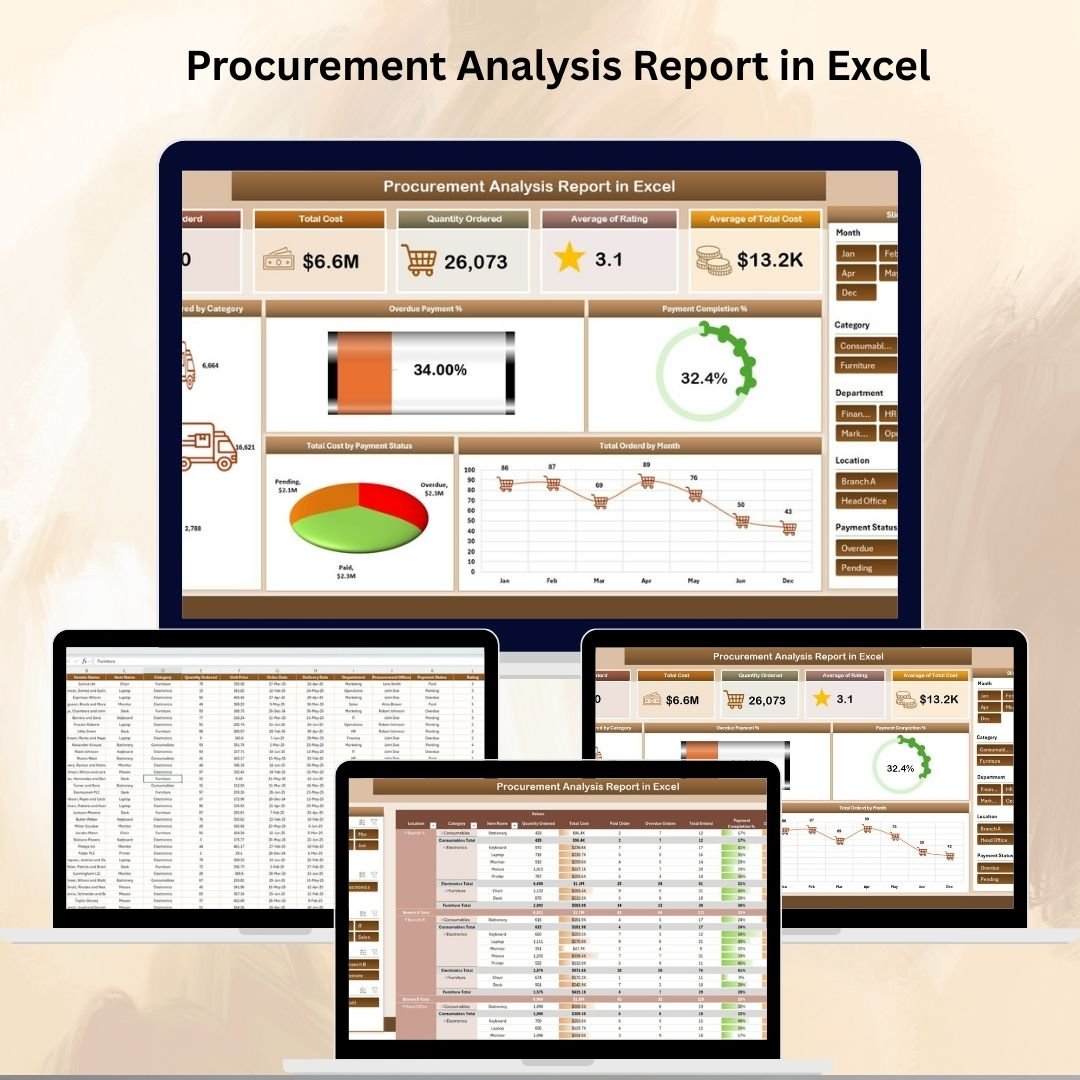
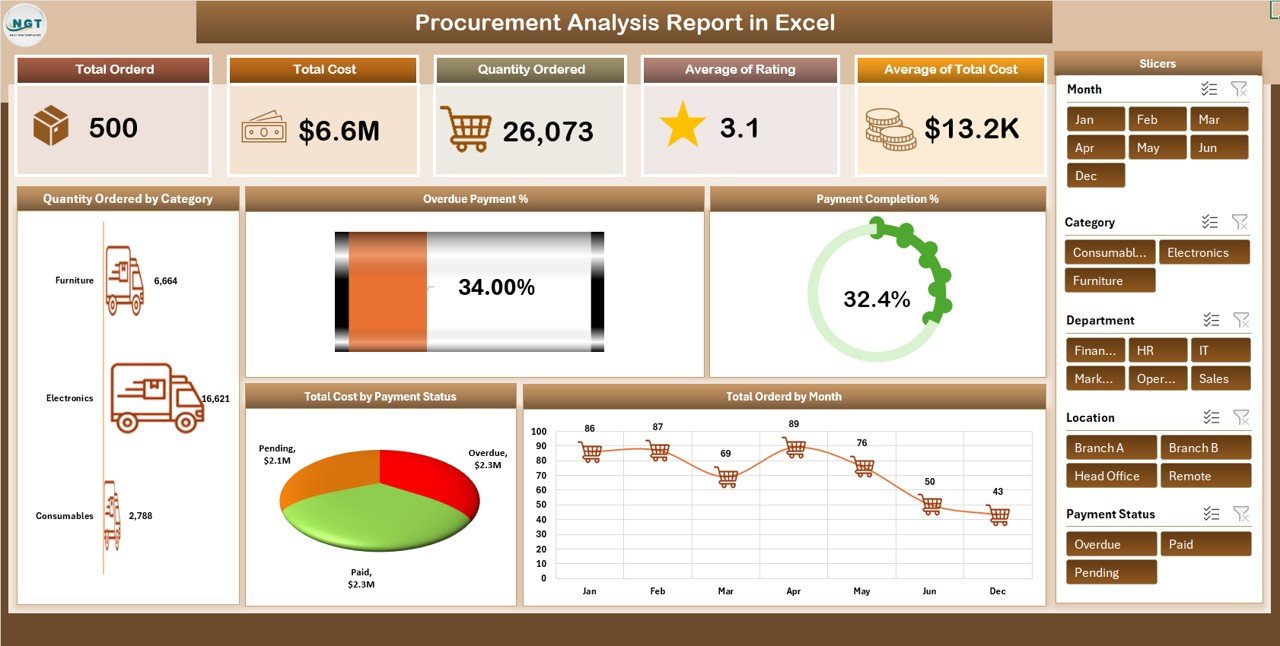
📊 1. Summary Sheet Tab – Instant Insights at a Glance
The Summary Sheet is your dashboard for procurement performance. It features interactive cards and charts that provide quick answers to critical questions:
-
Cards:
✅ Total Orders – number of purchase orders placed.
✅ Total Cost – overall procurement spend for the selected period.
✅ Quantity Ordered – total number of units purchased.
✅ Average Rating – supplier or product average rating.
✅ Average Total Cost – average procurement cost per order. -
Charts:
📈 Payment Completion % – monitor how many orders are fully paid.
📊 Quantity Ordered by Category – see which product groups dominate.
🔴 Overdue Payment % – keep an eye on delayed payments.
📅 Total Orders by Month – understand purchasing cycles.
💰 Total Cost by Payment Status – track pending vs. paid commitments.
This sheet provides an at-a-glance view of procurement health and helps managers make fast, informed decisions.
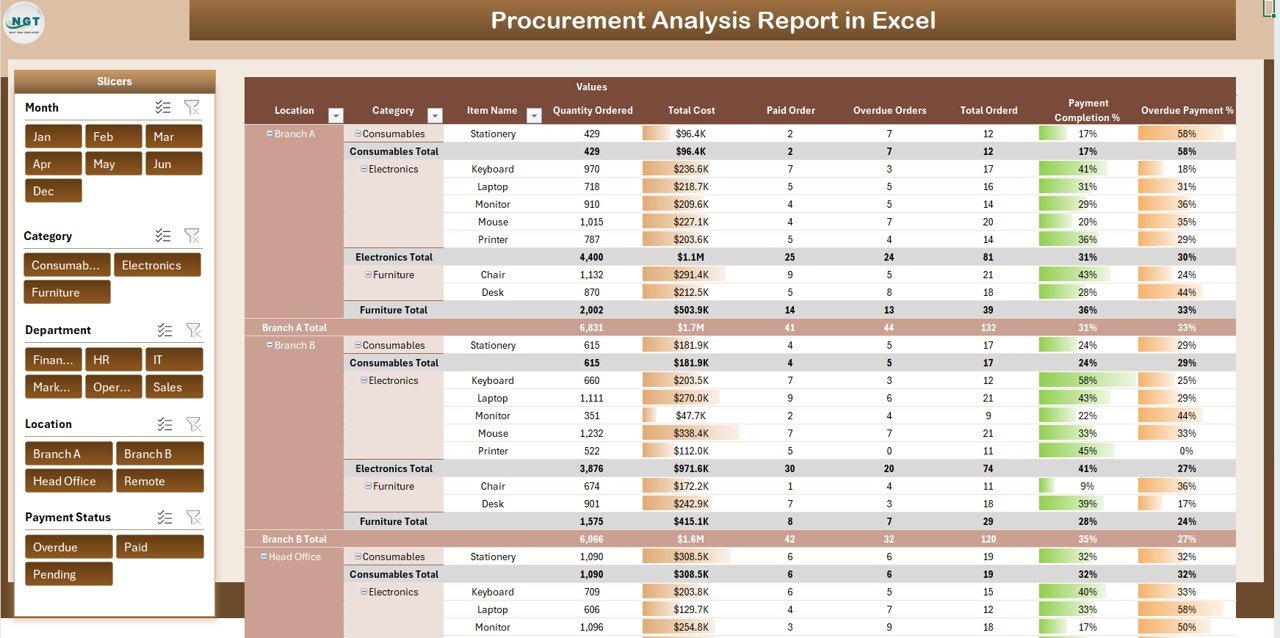
📑 2. Report Sheet Tab – Deep Dive Analysis
For detailed procurement insights, the Report Tab is your best friend. Powered by pivot tables, it allows you to filter, slice, and compare data across multiple dimensions:
-
Break down procurement by supplier, category, or location.
-
Compare supplier performance side by side.
-
Track overdue payments and identify financial risks.
-
Spot purchasing trends and seasonal cost fluctuations.
This is perfect for presentations, internal reports, and boardroom meetings where evidence-based decisions matter.
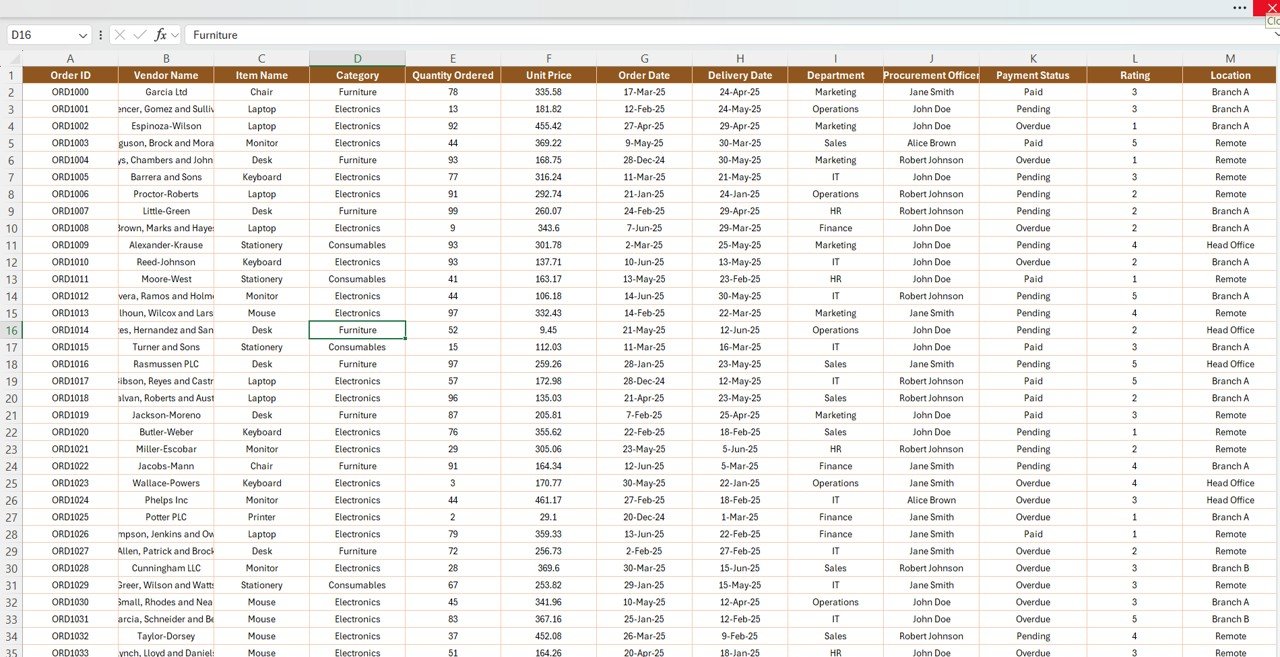
🗂️ 3. Data Sheet Tab – Organized Data Input
The Data Sheet is where all procurement transactions are recorded. Every entry automatically feeds into your Summary and Report tabs. Fields include:
-
Order ID (unique identifier)
-
Supplier Name
-
Category (product or service type)
-
Order Date & Delivery Date
-
Quantity Ordered
-
Unit Cost & Total Cost
-
Payment Status (Paid, Pending, Overdue)
-
Rating (supplier/product quality)
-
Remarks
This tab ensures all information is centralized, structured, and ready for automated analysis.
💡 Advantages of Using This Report
✔️ Centralized Procurement Data – All information in one professional Excel file.
✔️ Time-Saving Automation – Interactive dashboards update instantly.
✔️ Visual Insights – Cards and charts provide clarity on procurement health.
✔️ Supplier Performance Tracking – Identify reliable vendors and weak links.
✔️ Cost Optimization – Monitor overdue payments and control spending.
✔️ Flexibility – Fully customizable to match your organization’s needs.
🔧 Opportunities for Improvement
Although the template is robust, you can take it even further by:
-
Integrating with ERP or accounting systems for auto-data updates.
-
Adding supplier scorecards for long-term performance evaluation.
-
Including predictive analysis to forecast procurement costs.
-
Expanding KPI metrics to track compliance and contract adherence.
🏆 Best Practices
-
Update the Data Sheet consistently to maintain accuracy.
-
Use the Report Tab filters for supplier and category-level analysis.
-
Review monthly trends to optimize procurement strategies.
-
Align procurement reports with budget planning for better financial control.
🎯 Who Can Benefit?
-
Procurement Teams – gain full visibility into purchasing trends.
-
Finance Managers – track payments, costs, and overdue commitments.
-
Business Owners – control expenses and identify savings opportunities.
-
Operations Teams – monitor supplier reliability and efficiency.
✅ Conclusion
The Procurement Analysis Report in Excel is more than just a spreadsheet – it’s a powerful, professional-grade procurement management system designed to simplify your workflow. By centralizing data, providing actionable dashboards, and supporting detailed analysis, this tool helps you make smarter, faster, and more profitable decisions.
🔗 Click here to read the Detailed blog post
Watch the step-by-step video Demo:


Reviews
There are no reviews yet.