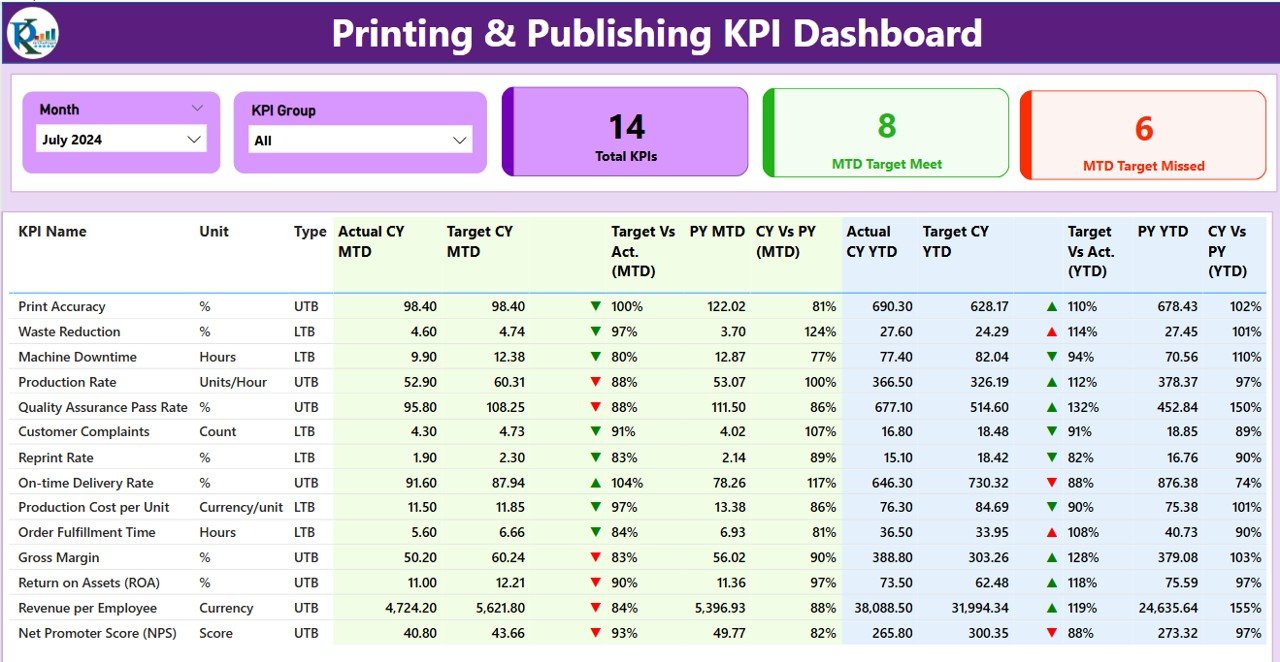
The Printing & Publishing KPI Dashboard in Power BI is a powerful tool designed for businesses in the printing and publishing industry to track and monitor key performance indicators (KPIs) related to production, sales, and operational efficiency. This dynamic, data-driven dashboard helps businesses streamline processes, optimize operations, and improve overall performance by providing actionable insights into critical metrics like production output, sales volume, profitability, and more.
By leveraging real-time data integration and customizable features, the dashboard empowers printing and publishing companies to make data-driven decisions, improve productivity, and enhance customer satisfaction. Whether you’re tracking order volumes, print runs, or the financial health of your business, this dashboard offers everything you need to stay ahead of the competition.
Key Features of the Printing & Publishing KPI Dashboard in Power BI
📊 Production Tracking
Monitor key production metrics such as print runs, order fulfillment time, and production costs. Track the efficiency of production processes and identify areas for improvement.
📈 Sales & Revenue Analysis
Track sales volume, revenue generation, and profitability. Get insights into which products are performing well and which require attention to boost sales.
💡 Customer Satisfaction Metrics
Measure customer satisfaction through KPIs such as delivery times, order accuracy, and feedback ratings. Use this data to improve customer service and enhance loyalty.
📅 Time-Based Performance Monitoring
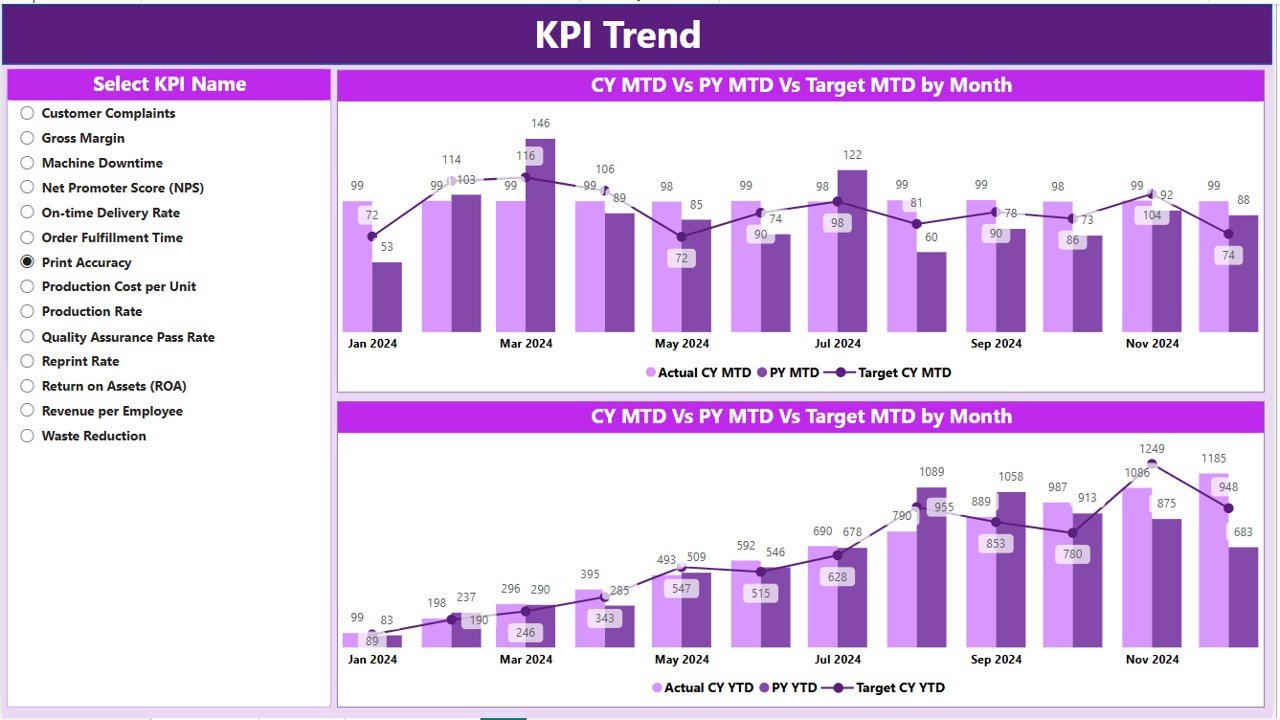
Track KPIs over time, including daily, weekly, monthly, and yearly performance. Identify trends, seasonality, and areas where improvements can be made.
⚙️ Operational Efficiency Insights
Measure the efficiency of internal processes like inventory management, order processing, and workflow efficiency. Ensure that operations are running smoothly and effectively.
🔑 Customizable KPIs & Metrics
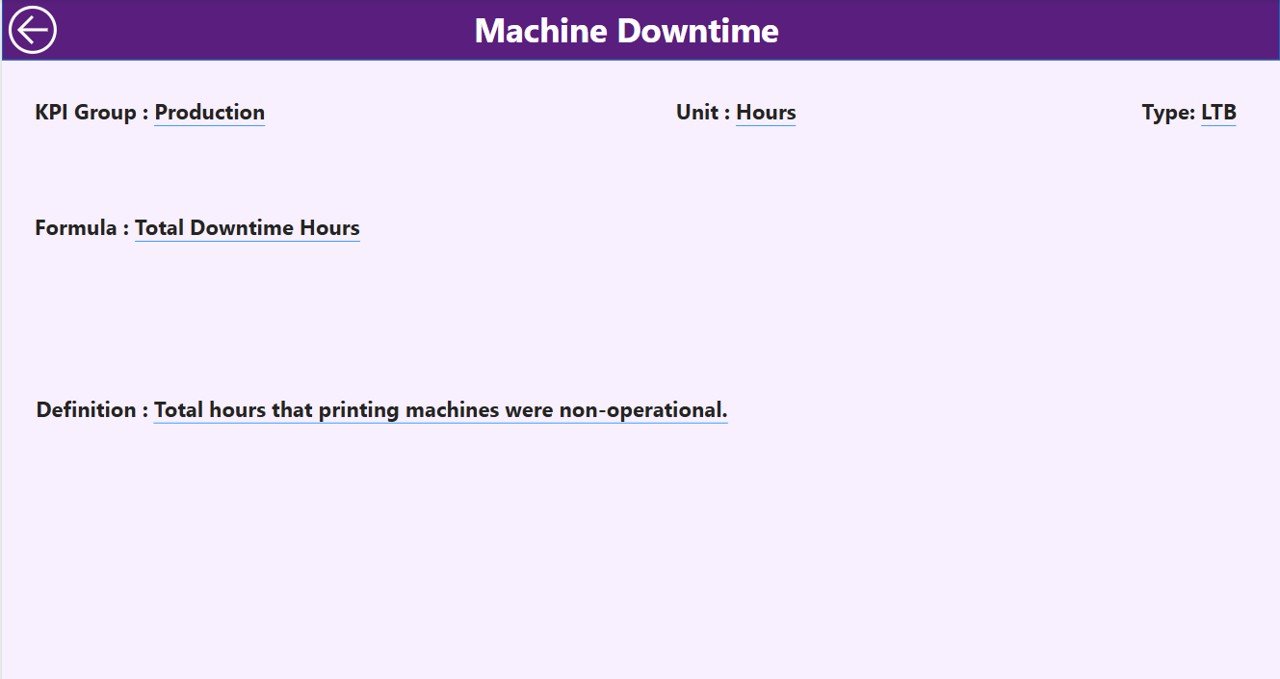
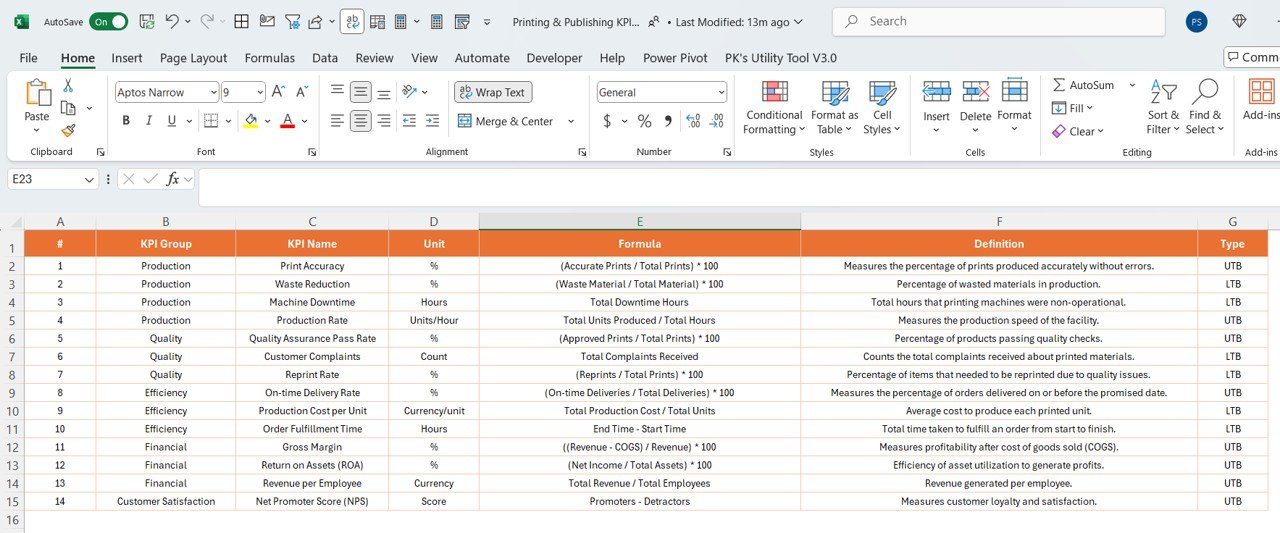
Tailor the dashboard to reflect the most relevant KPIs for your business. Add custom metrics such as raw material costs, lead times, or any other performance indicators specific to your company.
Why You’ll Love the Printing & Publishing KPI Dashboard in Power BI
✅ Comprehensive Overview of Operations
Get a complete picture of your business performance across key areas like production, sales, and customer satisfaction in one consolidated dashboard.
✅ Improve Operational Efficiency
Identify bottlenecks in production or operational processes and implement strategies to improve efficiency, reduce costs, and maximize output.
✅ Optimize Sales & Revenue Generation
Analyze sales and revenue data to make informed decisions about pricing, product offerings, and marketing strategies. Increase profitability by focusing on high-performing products.
✅ Enhance Customer Experience
Track customer feedback and satisfaction metrics to ensure that your customers are happy with their orders and improve areas that may need attention.
✅ Data-Driven Decision Making
Make better decisions based on real-time insights into your operations. Leverage the data to enhance performance, increase sales, and boost operational efficiency.
What’s Inside the Printing & Publishing KPI Dashboard in Power BI?
-
Production Tracking: Monitor print runs, production times, and efficiency metrics.
-
Sales & Revenue Analysis: Track sales volume, revenue, and profitability.
-
Customer Satisfaction Metrics: Measure delivery accuracy, customer feedback, and service quality.
-
Time-Based Performance Monitoring: Analyze trends over various periods for informed decision-making.
-
Operational Efficiency Insights: Track internal processes like inventory management and order processing.
-
Customizable KPIs: Adapt the dashboard to suit your specific printing and publishing business needs.
How to Use the Printing & Publishing KPI Dashboard in Power BI
1️⃣ Download the Template: Access the Printing & Publishing KPI Dashboard in Power BI instantly.
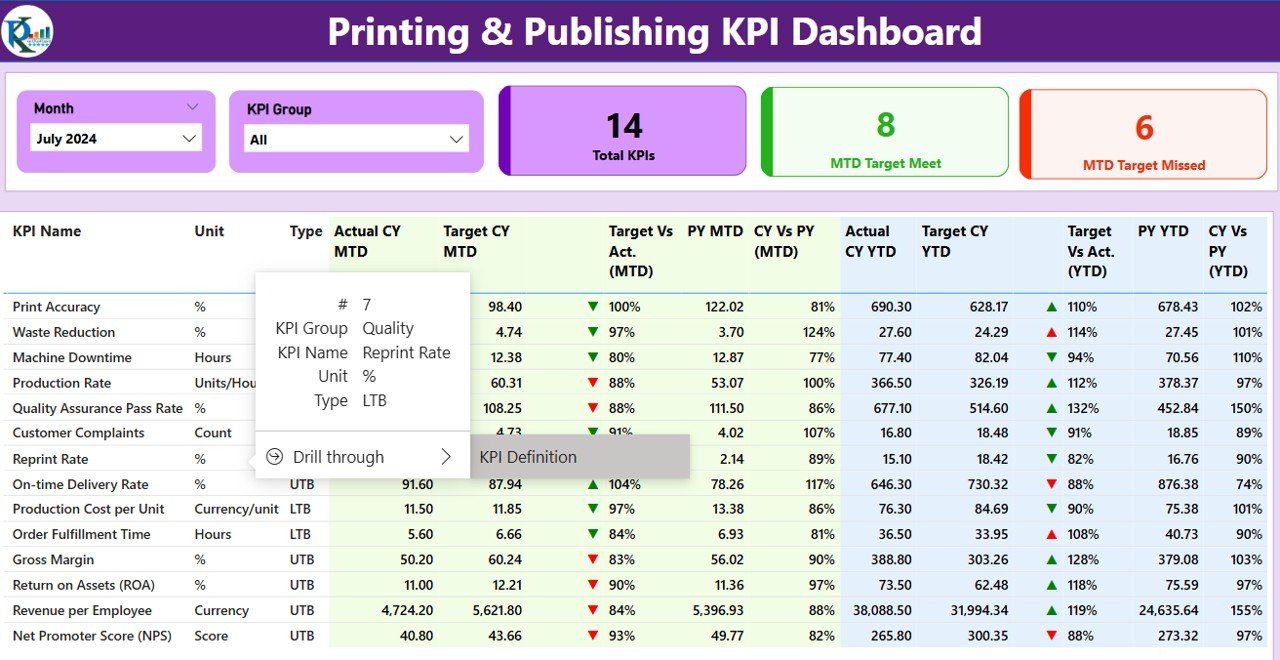
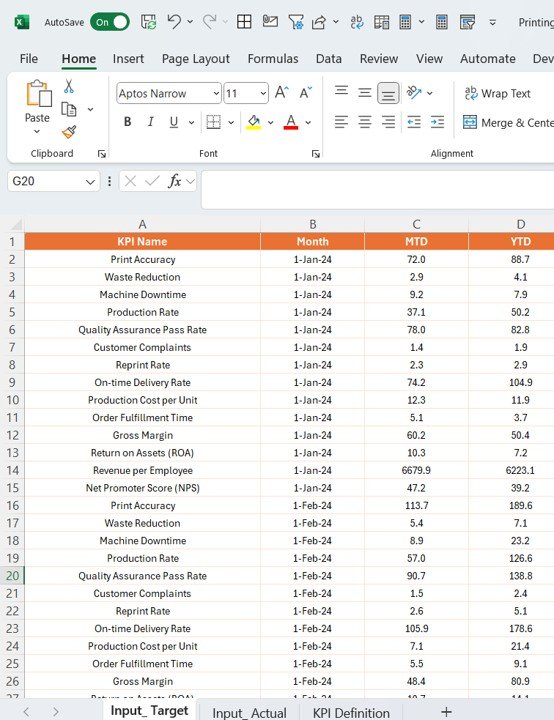
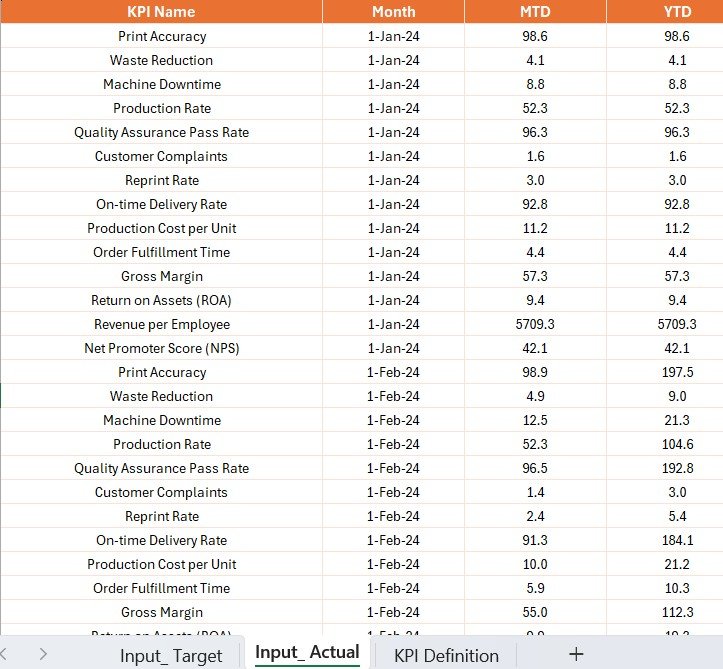
2️⃣ Integrate Your Data Sources: Connect your printing, sales, and customer data to the dashboard for real-time insights.
3️⃣ Track KPIs & Performance: Monitor critical metrics such as print runs, sales volume, and customer satisfaction.
4️⃣ Analyze Trends & Data: Use time-based analysis to identify trends and areas for improvement.
5️⃣ Optimize Your Operations: Leverage insights from the dashboard to streamline production, increase sales, and improve overall operational efficiency.
Who Can Benefit from the Printing & Publishing KPI Dashboard in Power BI?
🔹 Printing & Publishing Companies
🔹 Production Managers & Supervisors
🔹 Sales & Marketing Teams
🔹 Customer Service & Support Teams
🔹 Business Owners & Executives
🔹 Operations & Supply Chain Managers
🔹 E-commerce Platforms & Online Retailers in the Publishing Sector
Ensure optimal performance and operational efficiency in your printing and publishing business with the Printing & Publishing KPI Dashboard in Power BI. Track your performance metrics in real-time, analyze trends, and make data-driven decisions to improve productivity and profitability.
Click here to read the Detailed blog post
Visit our YouTube channel to learn step-by-step video tutorials
Youtube.com/@PKAnExcelExpert
















Reviews
There are no reviews yet.